Has Bitcoin Topped? Trump’s SBR Impact | Deep Dive Analysis🚨 Has COINBASE:BTCUSD topped? Even with Trump's Bitcoin Strategic Reserve? 🚨
In this deep dive, we analyze COINBASE:BTCUSD major factors that could point to a major reversal or breakout and to uncover whether a market top is forming.
We’ll cover:
Powerful Indicators
Bitcoin / BTC Trends
Price Action
EMA / SMA Trends
Volume Delta
Trend reversal / breakout
Bullish / Bearish / Confirmation from Indicators
order flow analysis
Timeframes (1W, 1D, 1m, 6M etc.)
Bullish and Bearish Sentiment
Strength Candles
👉 Like, comment below, and follow for more pro-level crypto insights.
MartyBoots here , I have been trading for 17 years and sharing my thoughts on COINBASE:BTCUSD .
Whether you're a short-term trader or long-term investor, this post provides the technical insight and edge to help you make better informed decisions.
📉 Stay ahead of the market. Watch the full breakdown and view charts to decide for yourself: Has Bitcoin really topped?
Watch video for more details and below I will show some powerful charts with descriptions.
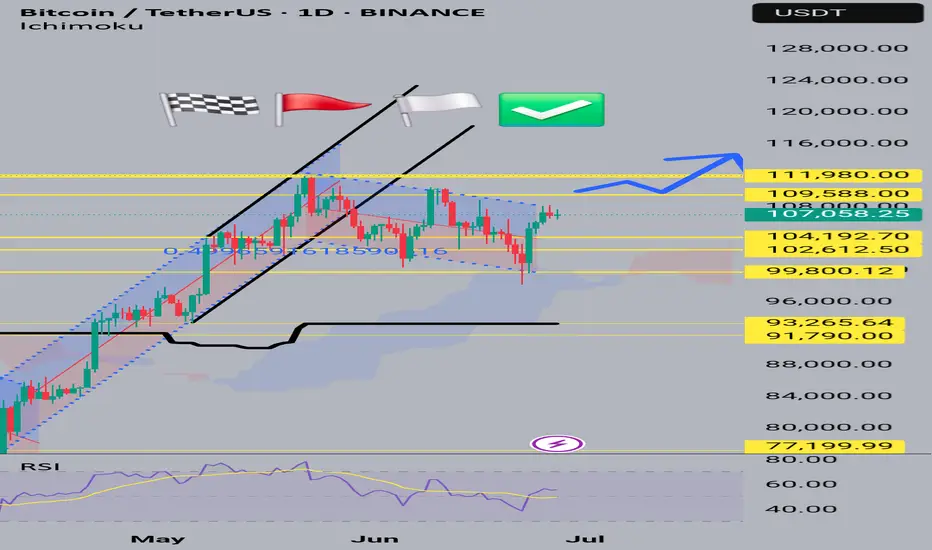
Warning in near term - LARGE ORDERS
Consolidation in price with large orders above
The Red lines = LARGE ORDERS
Large orders can act as an magnet to price
Large orders can also be support and resistance
Price Above the white 100 moving average
Price strong above it
Price weak below it
Strength Candles
Still Bullish
Multiple timeframes still green
Sentiment Tool Still Bullish
Still Bullish
Multiple timeframes and settings still green
3 Drive Structure
Equal Measured moves
Implies Top Is Not In
Target = $126k
Bullish Engulfing Candle
Implies higher prices to come
👉 Like, comment below, and follow for more pro-level crypto insights.
#Bitcoin #Trump #BTC #CryptoTrading #TechnicalAnalysis #CryptoMarket #BitcoinTop #TradingView #StrategicBitcoinReserve
Bitcoin (Cryptocurrency)

BTC - Will the Bears finally get their chance?Buy Side Liquidity Sweep in Progress
Price is currently climbing toward a region densely packed with resting buy side liquidity, marked by multiple previous highs. The area around 108,900 to 111,000 is especially significant, with two clear liquidity pools stacked above recent swing highs. These levels are likely to attract price as market participants seek to trigger stop orders and induce fresh buying interest—setting the stage for a potential reversal.
Weakness in the Current Impulse
The recent rally has advanced with minimal retracement and virtually no visible Gaps. This lack of corrective structure often indicates imbalance and suggests the move is overextended. When price moves upward too cleanly, it tends to leave behind thin liquidity zones, making the entire leg vulnerable to a sharper correction once exhaustion sets in.
Fair Value Gap as a Draw Below
Below current price lies a prominent bullish Fair Value Gap around 104,000. This inefficiency was left unfilled during the last leg up and may now serve as a magnet for price. These types of Gaps are often revisited by the market in an effort to rebalance supply and demand, especially after aggressive moves that break structure to the upside.
Once the higher liquidity levels are swept, watch for a clear reaction—either a strong rejection or lower timeframe structure shift—which could signal that the top is in. If that shift materializes, price may begin a downward leg targeting the unfilled Gap below. The magnitude of the move, combined with the lack of structure on the way up, leaves plenty of room for corrective action.
For those looking to engage, waiting for confirmation on a lower timeframe—such as a break of short-term bullish structure or the formation of a bearish Gap—can help time entries more precisely. In setups like these, patience is key: let the Sweep play out, observe how price reacts, and only then consider stepping in.

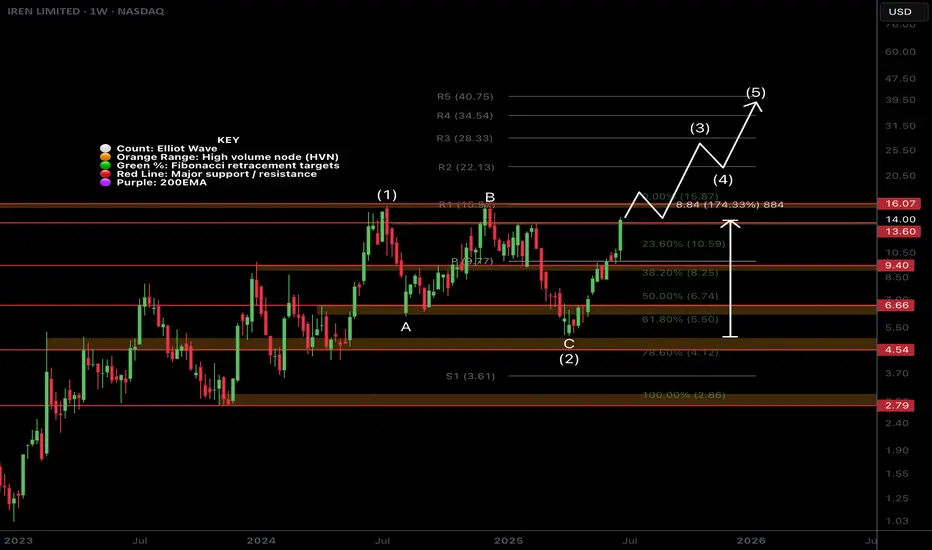
IRENs Incredible Surge Continue next wWeek?NASDAQ:IREN has been on a rampage since the April surging 175% and nearing all time high! A great couple of trades for us so far!
Price is likely to hit all time high next week with such a strong trend, where resistance and a pullback is a high probability.
The weekly pivot is $9.77, the most likely area for price to find support just above the 0.382 Fibonacci retracement (which will be dragged up to the weekly pivot once a new high is made).
Price discovery terminal target are the R3 & R5 weekly pivot points at $28 and $40.
Safe trading
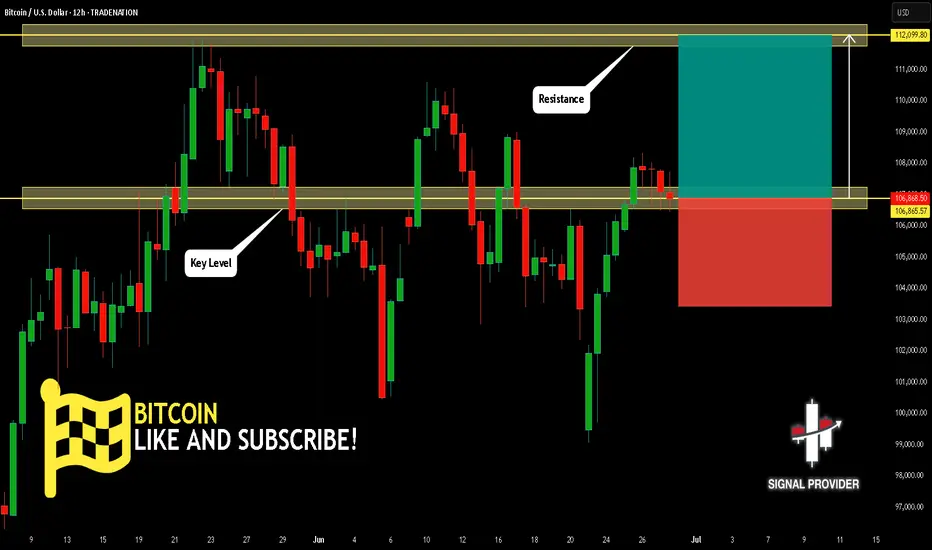
BITCOIN Is Bullish! Buy!
Here is our detailed technical review for BITCOIN.
Time Frame: 12h
Current Trend: Bullish
Sentiment: Oversold (based on 7-period RSI)
Forecast: Bullish
The market is approaching a significant support area 106,865.57.
The underlined horizontal cluster clearly indicates a highly probable bullish movement with target 112,099.80 level.
P.S
Overbought describes a period of time where there has been a significant and consistent upward move in price over a period of time without much pullback.
Disclosure: I am part of Trade Nation's Influencer program and receive a monthly fee for using their TradingView charts in my analysis.
Like and subscribe and comment my ideas if you enjoy them!
Bitcoin Bullish But... Support Zones (Incl. Altcoins)Bitcoin is bullish right now but we know things can change. As long as the action is happening within the blue and gray space, all is good, the bullish bias remains intact. If the action moves below the gray zone and enters the orange zone, this is the danger zone. This danger zone can turn into a buy opportunity or a wait and see approach.
On the other hand, if Bitcoin remains above the blue zone this is ultra-bullish short-term. This is specially bullish for the altcoins but it is bullish for Bitcoin as it reveals consolidation at high prices, but right now we have a lower high so anything goes.
The chart is mixed when looked at up-close. Bullish long-term and on all bigger timeframes. Corrections tend to develop from high prices.
One more thing to consider
When we look at the action short-term we can miss the bigger picture, we can become clouded with noise. The bigger range is $100,000 - $110,000, this is the new long-term support zone that is being established and created before additional growth. Bitcoin can remain here for weeks or even months, if this happens, the altcoins will continue to grow.
We are in a bull market. Bitcoin is obviously in a bull market as it is trading near its all-time high after years of growth. The altcoins are just getting started after years of sideways action... Some altcoins hit new all-time lows but still part of a broad, long-term consolidation phase. Many produced higher lows, some produced lower lows, it makes no difference.
The bear market ended in mid/late 2022 and the ensuing two years we had mix growth. Bullish waves and bearish waves, with the usual variations of course.
The year is now 2025 and Bitcoin is up, most of the big projects have been growing for years now and we are getting close to the final advance, the major fifth wave and the bull market bull run. When this happens, close to its end, all the smaller projects will produce the biggest growth in their history and this will be the boom that will catapult Crypto to take over the financial world.
It won't be the first time this event happens nor the last, the market will continue to fluctuate.
I know there is a lot of information out there and we can become uncertain with every drop, but look at the price; what do you see? Bitcoin is going up.
The altcoins are set to follow, the altcoins do what Bitcoin does.
Namaste.
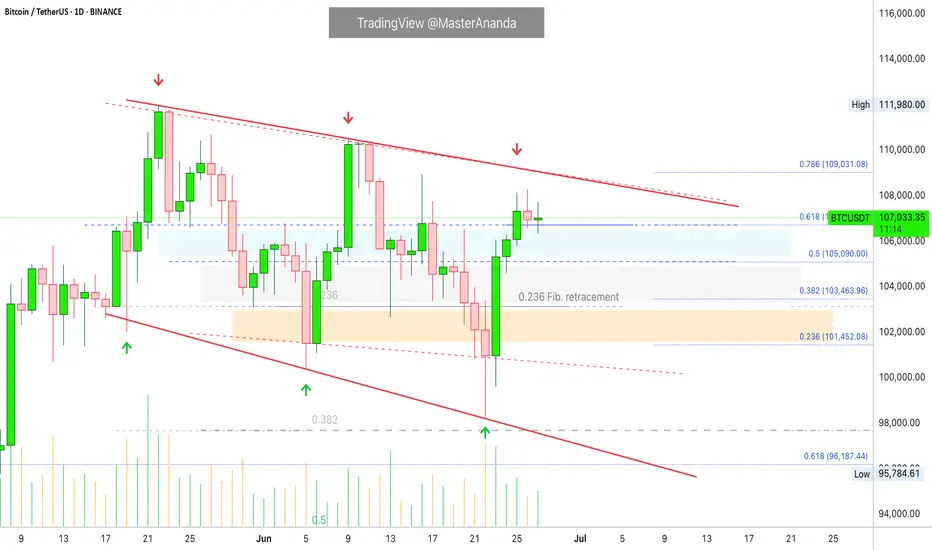
Bitcoin, The Next High Is The All-Time HighThe title might be a bit misleading but, the truth is that Bitcoin stays bullish short-term and this is bullish on all terms...
Good afternoon my fellow Cryptocurrency trader, how are you feeling today?
Any day, any week, any moment; every month, place or year, the market provides everything we need to know. This information is made available to us through the chart.
Bullish Bitcoin
The present signal is the fact that Bitcoin remains very high, challenging resistance, after a strong recovery and advance. This is happening with the altcoins also.
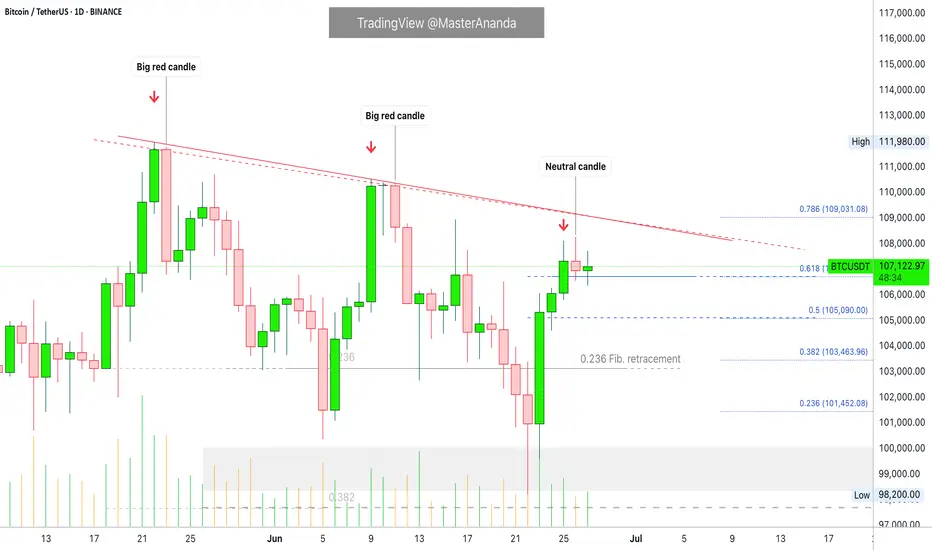
If you look at the last two peaks, as soon as resistance was hit there was an immediate crash. The next day was full red; very strong bearish action and momentum and this led to a new low. The situation is not the same today.
22-May peak. 23-May, strong bearish action.
9-June peak. 11-June, strong bearish action.
26-June lower high (not a peak). Today, neutral action. This neutral action is what I am taking as a bullish signal. Many other factors of course support this conclusion yet, this is still an early signal.
Fib support
A closer view of the daily timeframe:
4H. The grey line represents Fib. retracement. Dark blue—Fib. extension:
Conclusion
Each time there is a price peak a retrace follows, if there is no retrace then you are not witnessing a peak but rather a stop, a pause; resistance being met.
It seems that the current lower high is not the end but rather just a pause before additional growth. Market conditions can change.
It can happen that several days Bitcoin goes sideways with the bulls failing to garner enough strength. In this scenario, there would be a move lower before additional growth.
The present scenario shows a bullish chart even if prices drop, remember, the market is in no hurry.
Easy money
In September we will have lower interest rates and this is a bullish development for Bitcoin. Advanced money minds see easy money as inflationary for the currency, while Bitcoin is inflation-proof. So the dollar goes down and Bitcoin goes up.
I didn't quite develop this point, next time I'll do a better job.
Summary
The market is good even if it shakes. The market is good and isn't shaking, the recovery is already in place.
Bitcoin's price is very strong and there are many layers of support. The altcoins are in a similar situation, growing from the bottom up.
The Fed will reduce interest rates in September and then once more before the year ends, this is bullish for everything so, everything will be going up, at least everything that we are interested in, support and trade.
Thanks a lot for your continued support.
Never give up!
You are divine! You are blessed.
If you are reading this now, you will be blessed for your great timing. Hard work and dedication always pays.
Keep moving forward, keep pushing forward, never give up.
When life hits you hard, do take a break if you need it, only to comeback with new energy, a new mind and an infinite drive to achieve your goals.
You are the reason why Bitcoin exist... You are the lifeblood of the market.
Without you, nothing is possible. It is because of you that we all continue to grow.
Thanks again for taking the time to read.
I appreciate your support.
Namaste.
btcusd bitcoin entering bear market that will last 1 year to 20kBearish divergence on rsi and mcad indication of bear market that usually last year.
Bottom is approximately 20k were also unfilled CME gap still exists.

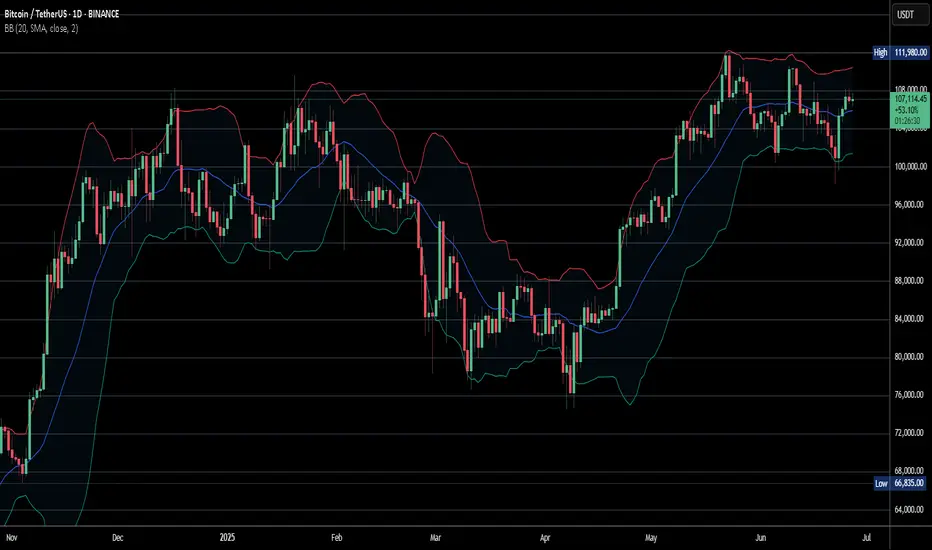
Sharing the advanced Bollinger Bands strategyHere are the Bollinger Band trading tips: *
📌 If you break above the upper band and then drop back down through it, confirm a short signal!
📌 If you drop below the lower band and then move back up through it, confirm a long signal!
📌 If you continue to drop below the middle band, add to your short position; if you break above the middle band, add to your long position!
Pretty straightforward, right? This means you won’t be waiting for the middle band to signal before acting; you’ll be ahead of the game, capturing market turning points!
Let’s break it down with some examples:
1. When Bitcoin breaks above the upper Bollinger Band, it looks strong, but quickly drops back below:
➡️ That’s a “bull trap”—time to go short!
2. If Bitcoin crashes below the lower band and then pops back up:
➡️ Bears are running out of steam—time to go long and grab that rebound!
3. If the price keeps moving above the middle band:
➡️ Add to your long or short positions to ride the trend without being greedy or hesitant.
Why is this method powerful?
It combines “edge recognition + trend confirmation” for double protection:
1. Edge Recognition—spot the turning point and act early.
2. Trend Confirmation—wait for the middle band breakout and then confidently add positions!
You won’t be reacting after the fact; you’ll be ahead of the curve, increasing your positions in the trend’s middle and locking in profits at the end. This is the rhythm of professional traders and the core logic of systematic profits!
Who is this method for?
- You want precise entry and exit points.
- You’re tired of “chasing highs and cutting losses.”
- You want a clear, executable trading system.
- You want to go from “I see the chart but don’t act” to “I see the signal and take action.”
Follow for more. Make sure to like this if you found it useful.
Unusual situation - Will you short BTCUSD?Going short is not the first thought when talking about BTCUSD, yet the 3 recent lower highs together with an "evening star" pattern are saying exactly that.
Will you take this offer?
What do you think?
Comment below, share your thoughts and analysis!!
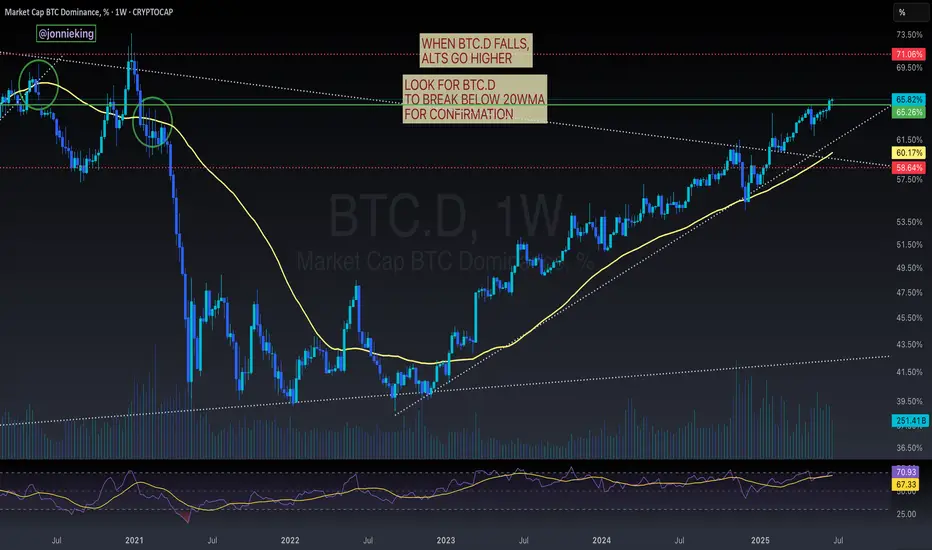
₿itcoin Dominance New Cycle High 66% ₿itcoin Dominance reaches new cycle high tapping 66%
If there's one thing I learned this cycle, it's never to sell your CRYPTOCAP:BTC for Alts.
If you want to play the casino, play with USD 💯
BITCOIN ROAD TO $44k - UPDATEI am updating the leading diagonal formation development, together with other insights that, if synergized properly, can give us the early warning of a potential crash towards $44k!!!!

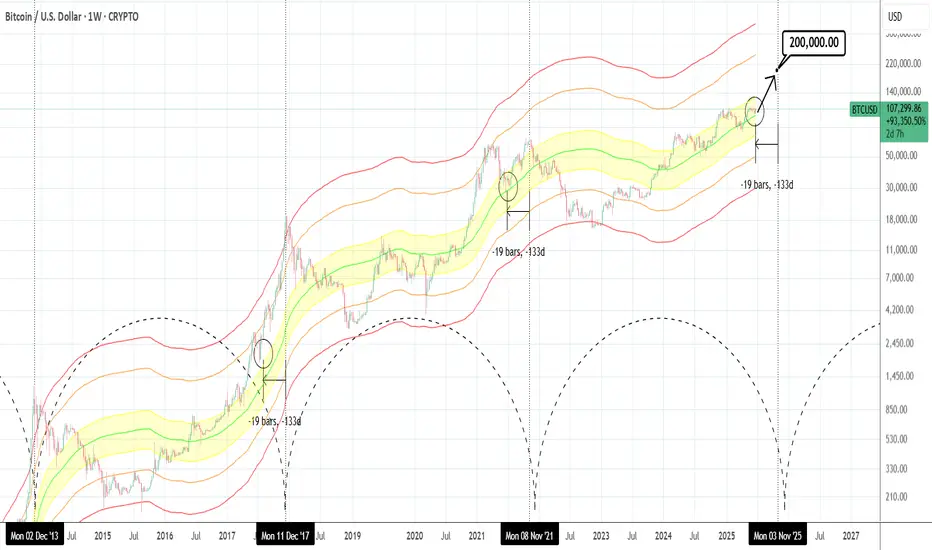
BTCUSD: Hasn't gone parabolic yet.Bitcoin is just now re-entering the bullish state on its 1D technical outlook (RSI = 55.820, MACD = 291.960, ADX = 15.180), being correcting/consolidating in the past 30 days. According to the Mayer Multiple Bands, it's stil inside the range (upper band) of the 1 Stdev Below-Mean-1 Stdev Above (yellow range). This suggest significant upside potential as being roughly 19 weeks before the Cycle tops, it matches the late June 2021 bottom inside that zone as well as the July 2017 bottom just over the top of that zone. The orange trendline has been the minimum target on every Cycle but looks unlikely to hit it by the end of the year. If however it goes parabolic as all Cycles had at this stage, $200,000 isn't at all far fetched before the Cycle tops.
## If you like our free content follow our profile to get more daily ideas. ##
## Comments and likes are greatly appreciated. ##
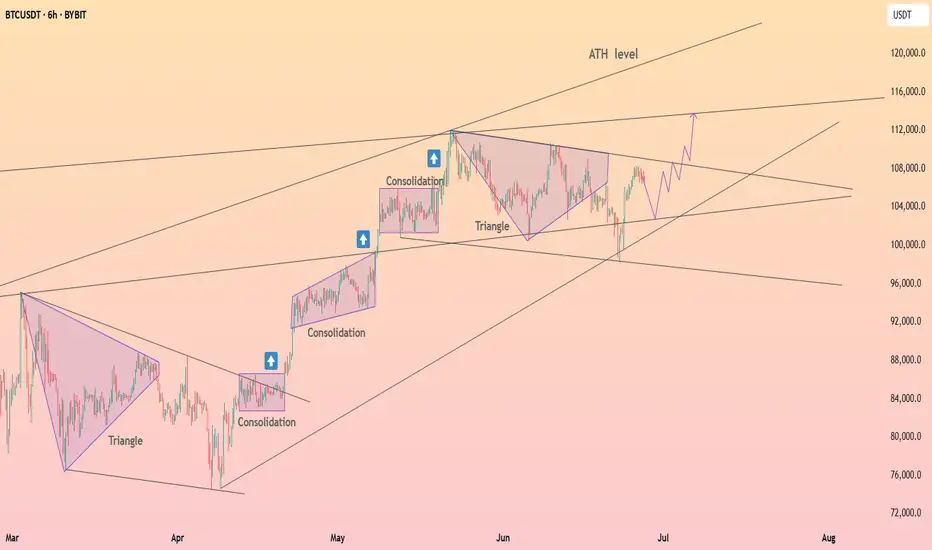
HolderStat┆BTCUSD aiming for 112kBINANCE:BTCUSDT is forming a bullish continuation structure after bouncing from the mid-range. With support holding and consolidation patterns completing, price action suggests a rally toward the 115,000 resistance line. Triangle and consolidation behavior confirms a strong uptrend continuation setup.
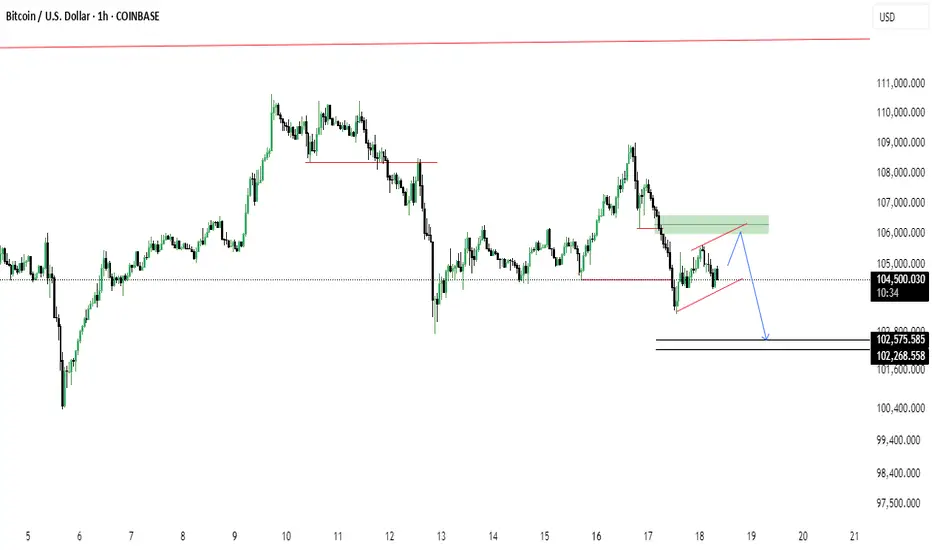
BTC/USD Rising Wedge Breakdown Ahead?Bitcoin shows signs of a potential bearish reversal as price forms a rising wedge beneath a key supply zone. After a recent drop, price is retesting the 106k area (green zone), possibly setting up for continuation to the downside.
🔹 Rising wedge pattern near resistance
🔹 Bearish retest at previous support turned resistance
🔹 Potential drop targets: 102,575 and 102,268
🔹 Break below wedge support could accelerate the fall
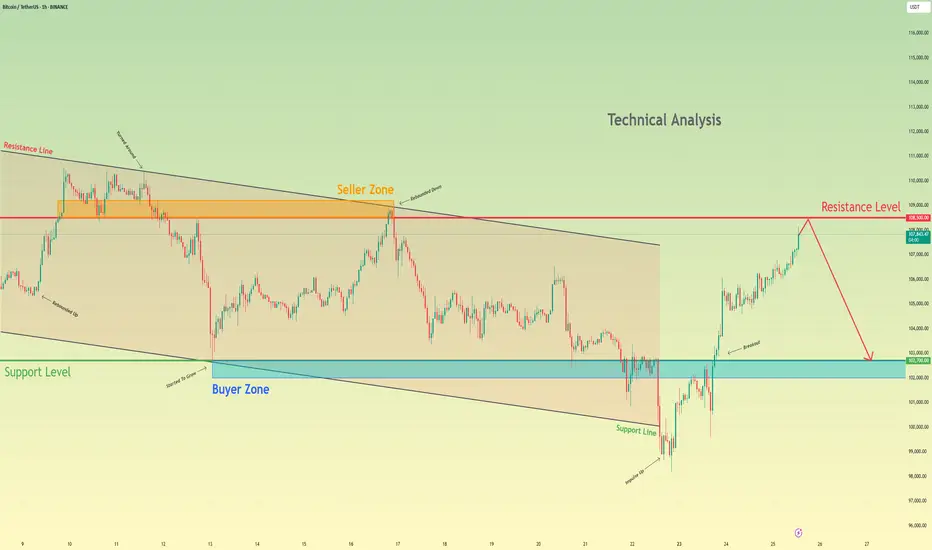
Bitcoin may reach resistance level and then start to declineHello traders, I want share with you my opinion about Bitcoin. Previously, the price was trading inside a well-defined downward channel, repeatedly rebounding from both the support and resistance lines. Each upward move got rejected within the seller zone, especially around the 108500 - 109200 range, which acted as a strong barrier multiple times. Later, BTC dropped to the buyer zone near 102700 - 102000, and from there, we saw a strong impulse up. This impulse broke through the channel resistance line and the support area, indicating a short-term bullish breakout. At the moment, the price is approaching the resistance level at 108500, which previously served as a turning point. Given that this area also aligns with the upper boundary of the seller zone, I believe we may see another reversal from this level. In my opinion, after reaching resistance, BTC may start a new downward wave, targeting the 102700 support level. This is where I’ve set my TP 1. Considering the recent breakout, the historical significance of the resistance, and the strong reaction from seller zones, I remain bearish in the short term and expect a potential decline toward support. Please share this idea with your friends and click Boost 🚀
Disclaimer: As part of ThinkMarkets’ Influencer Program, I am sponsored to share and publish their charts in my analysis.
BTCUSDTHi snipers. On the one-day timeframe, we are witnessing the formation of a harmonic pattern called a flag. This pattern usually forms in the middle of a trend and then the previous trend continues. The flag consists of two parts: a bar and a flag. In the flag, the price is moving in a channel between two parallel lines. If the price breaks through and crosses the upper ceiling of the channel, we will probably reach new prices. I am practicing and learning. This is not a buy or sell offer.
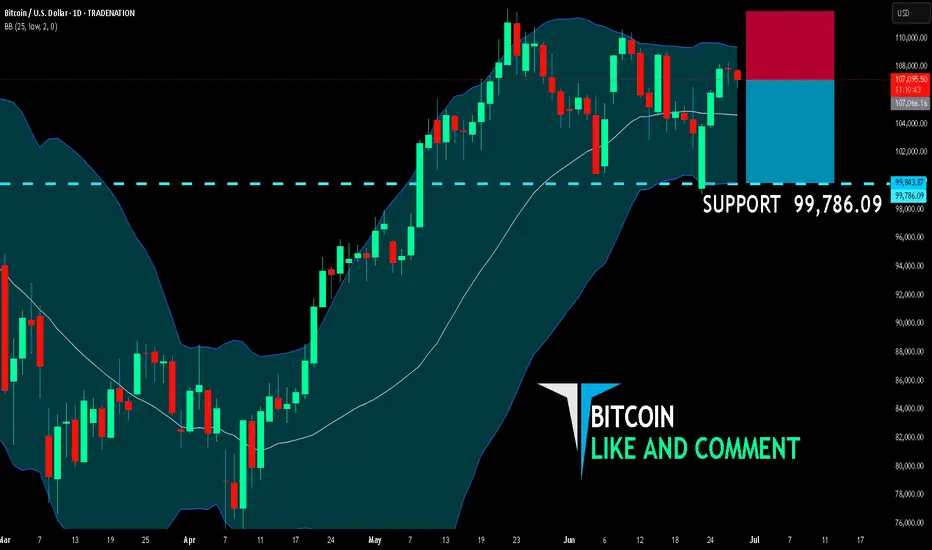
BITCOIN SHORT FROM RESISTANCE
BITCOIN SIGNAL
Trade Direction: short
Entry Level: 107,066.16
Target Level: 99,786.09
Stop Loss: 111,861.76
RISK PROFILE
Risk level: medium
Suggested risk: 1%
Timeframe: 1D
Disclosure: I am part of Trade Nation's Influencer program and receive a monthly fee for using their TradingView charts in my analysis.
LIKE AND COMMENT MY IDEAS
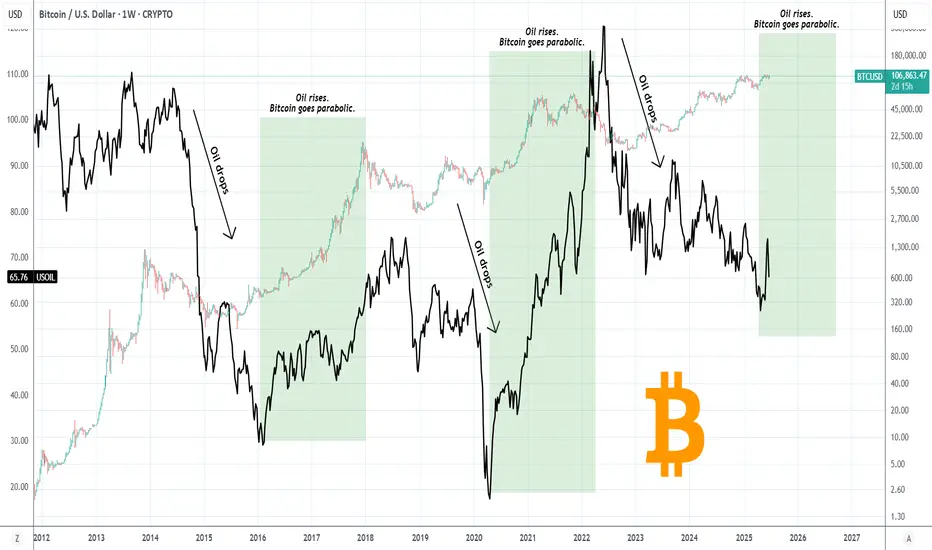
BITCOIN Just wait until OIL turns bullish!Bitcoin (BTCUSD) has a unique long-term relationship/ correlation with WTI Oil (USOIL) and this charts shows why.
In the past 11 years, when Oil started to decline sharply, Bitcoin formed a market bottom before Oil did. When Oil started to rise again, Bitcoin was out of its bottom and has initiated its Parabolic Rally stage (green Rectangle). Then Oil peaked after BTC has already priced its own Cycle Top.
Based on this correlation, we can assume that we haven't yet seen BTC's Parabolic stage as Oil hasn't yet started to rise. If we assume that the late April Low on Oil was its market bottom, then only now it has started its rise, so at best BTC has just started the Cycle's Parabolic Rally. If that turns out o be true, then the upside potential is huge for BTC. Needless to say other key macroeconomic factors have to assist e.g. higher adoption, ETF inflows, FED Rate Cut, but that's what the current chart says!
So do you think that Oil can be the driver behind a new Bitcoin parabolic rally? Feel free to let us know in the comments section below!
-------------------------------------------------------------------------------
** Please LIKE 👍, FOLLOW , SHARE and COMMENT if you enjoy this idea! Also share your ideas and charts in the comments section below! This is best way to keep it relevant, support us, keep the content here free and allow the idea to reach as many people as possible. **
-------------------------------------------------------------------------------
💸💸💸💸💸💸
👇 👇 👇 👇 👇 👇
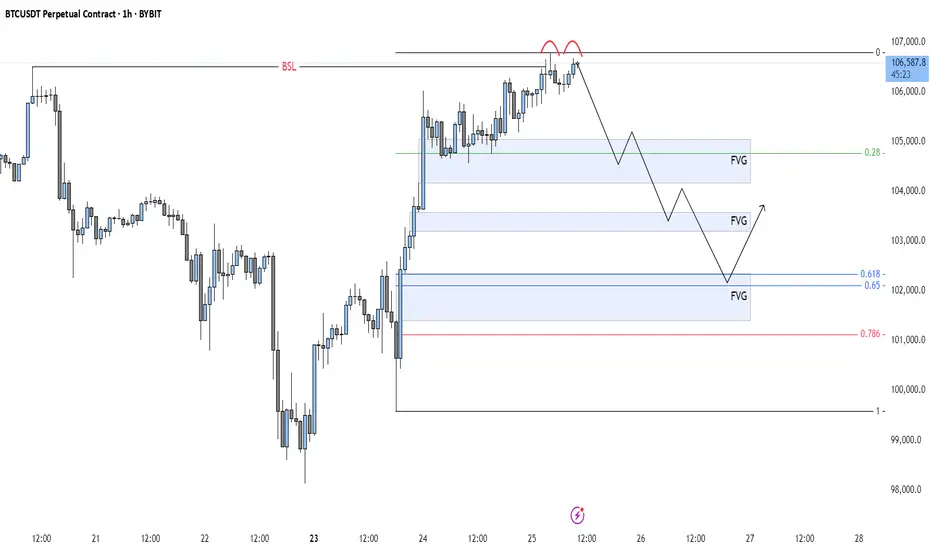
BTC - Double Top after Liquidity Sweep?Price has recently executed a Buy Side Liquidity Sweep just above the previous high. This type of move often signals a potential shift in market direction, especially when followed by signs of exhaustion or failure to push higher. In this case, price has formed a double top near the 106,600 level, a classic sign of weakening bullish momentum and hesitation at a key resistance area.
Following the Sweep, the projection suggests a possible rejection from this region, leading to a corrective move to rebalance the inefficiencies left behind by the sharp upward impulse. These inefficiencies are marked as Fair Value Gaps —areas where price moved too quickly, leaving imbalanced zones between buyers and sellers. The market tends to return to these areas over time as it seeks equilibrium.
The first Gap lies just below the 0.28 Fibonacci retracement and may serve as an initial area for a reaction. If price slices through this level without meaningful support, attention shifts to the second Gap, which aligns closely with the 0.50 to 0.618 retracement zone. This region is historically significant for pullbacks and could offer a temporary pause or bounce.
Should the move extend further, the third and deepest Gap, located between the 0.618 and 0.65 levels , becomes a key area of interest. It marks a critical rebalancing zone that could attract stronger buying interest. If this area fails to hold, the 0.786 retracement level sits just below and may act as a final point for support before any broader directional change.
For refined entries, traders can watch lower timeframes like the 5-minute chart. Look for signs of weakness, such as an inverted Gap or a lower-timeframe break in structure, to time positions with tighter risk. This allows participation in the broader move while maintaining tactical precision.
The confluence of a Buy Side Liquidity Sweep, a double top , and multiple Gaps below provides a clear framework for a potential downside play. As always, let the price action lead.
Patience, confirmation, and context are key to executing with confidence.
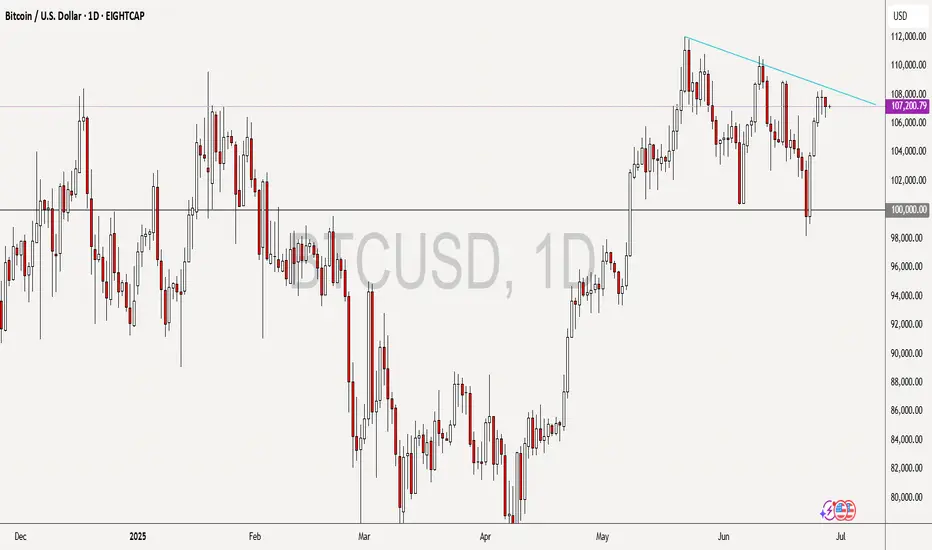
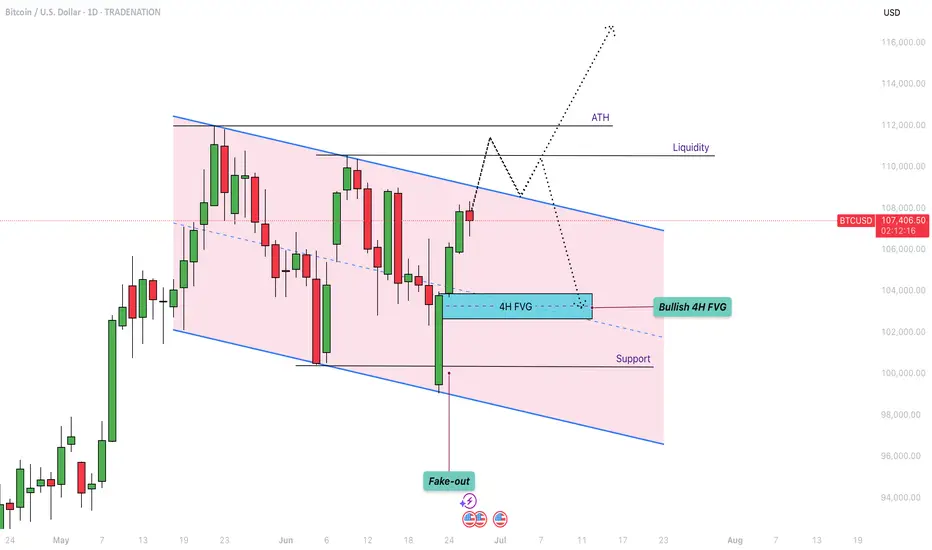
Bitcoin - Bullflag formation towards $111k?After the long and steep rally in Bitcoin that began on April 9th, the price is now entering a period of consolidation and forming a classic bullish continuation pattern known as a bull flag. This type of structure often appears after a strong impulsive move to the upside and signals that the market may be gearing up for another leg higher.
Bull Flag
On the daily timeframe, BTC is in the process of developing a bull flag by printing a series of lower highs and lower lows within a narrow descending channel. This pullback phase comes after a significant rally and is generally considered a healthy part of a trending market. It reflects a cooling-off period in which the market digests the prior gains while maintaining a bullish bias. This type of structure typically resolves to the upside, continuing the dominant trend. At present, BTC is approaching a key upper boundary of the flag formation, which also aligns with a prior zone of price rejection. This area could act as resistance in the short term and will likely play a crucial role in determining the next directional move.
4H Fair Value Gap
Zooming in on the 4-hour chart, we can observe a clearly defined fair value gap (FVG) between the $102,700 and $103,800 levels. This imbalance was created during the sharp move up and now represents a potential area of interest for buyers. If price retraces into this zone, it could act as strong support where demand steps in, filling the imbalance and potentially triggering the next upward leg. Fair value gaps often serve as magnet zones in trending markets, and in this case, could offer a key entry point for those looking to position long within the larger bullish structure.
Liquidity Levels
One of the more critical areas to watch lies around the $111,000 level, where we see a double top on the lower timeframes. This region holds a significant amount of resting liquidity just above it, as evidenced by the liquidation heatmap. These clustered stop-loss orders and leveraged positions create a liquidity pool that could attract market makers and large players looking to trigger a stop run. As price approaches this level, it becomes increasingly likely that the market may spike into this liquidity before deciding on a longer-term direction. This liquidity zone acts like a magnet and is a common target for short-term wicks and fake-out moves.
Expectations
The current expectation is for Bitcoin to push higher toward the $111,000 level before the market makes a more definitive move. While this upside continuation seems likely in the short term, caution is warranted, especially considering the structure on higher timeframes. The weekly chart is starting to show some signs of exhaustion, with momentum slowing and potential bearish divergence forming. As such, the move to $111,000 could simply be a liquidity grab—a final push to trap breakout traders—before a deeper correction or reversal unfolds. If price does manage to break the all-time high with convincing volume and sustained follow-through, the bullish case would strengthen significantly. Until then, however, it’s important to remain cautious and recognize the risk of a fake-out at these elevated levels.
Conclusion
Despite the strong rally in recent weeks, Bitcoin still faces substantial resistance overhead. The $111,000 level stands out as a critical zone that could act as a magnet, drawing in price action before reversing to the downside. This area is not only technically significant but also loaded with liquidity, increasing the risk of a bull trap. Traders should remain vigilant and avoid getting caught on the wrong side of the move. Watch closely for signs of exhaustion or divergence as price approaches this level, and be prepared for potential fake-outs designed to lure in overly aggressive participants. Staying patient and waiting for confirmation remains the most prudent strategy in this environment.
-------------------------------
Disclosure: I am part of Trade Nation's Influencer program and receive a monthly fee for using their TradingView charts in my analysis.
Thanks for your support.
- Make sure to follow me so you don't miss out on the next analysis!
- Drop a like and leave a comment!
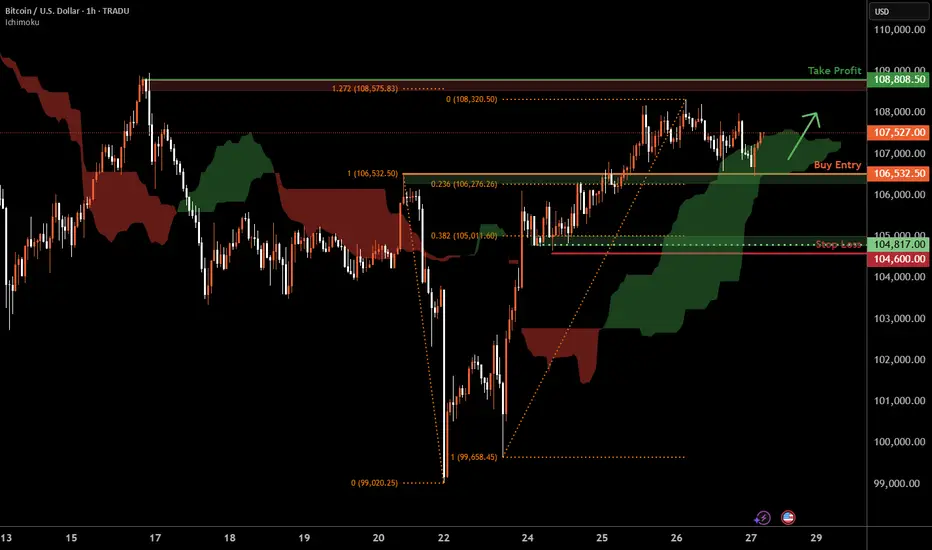
Bitcoin H1 | Potential bounce off an overlap supportBitcoin (BTC/USD) is falling towards an overlap support and could potentially bounce off this level to climb higher.
Buy entry is at 106,532.50 which is an overlap support that aligns closely with the 23.6% Fibonacci retracement.
Stop loss is at 104,600.00 which is a level that lies underneath a swing-low support and the 38.2% Fibonacci retracement.
Take profit is at 108,808.50 which is a swing-high resistance that aligns with the 127.2% Fibonacci extension.
High Risk Investment Warning
Trading Forex/CFDs on margin carries a high level of risk and may not be suitable for all investors. Leverage can work against you.
Stratos Markets Limited (tradu.com ):
CFDs are complex instruments and come with a high risk of losing money rapidly due to leverage. 63% of retail investor accounts lose money when trading CFDs with this provider. You should consider whether you understand how CFDs work and whether you can afford to take the high risk of losing your money.
Stratos Europe Ltd (tradu.com ):
CFDs are complex instruments and come with a high risk of losing money rapidly due to leverage. 63% of retail investor accounts lose money when trading CFDs with this provider. You should consider whether you understand how CFDs work and whether you can afford to take the high risk of losing your money.
Stratos Global LLC (tradu.com ):
Losses can exceed deposits.
Please be advised that the information presented on TradingView is provided to Tradu (‘Company’, ‘we’) by a third-party provider (‘TFA Global Pte Ltd’). Please be reminded that you are solely responsible for the trading decisions on your account. There is a very high degree of risk involved in trading. Any information and/or content is intended entirely for research, educational and informational purposes only and does not constitute investment or consultation advice or investment strategy. The information is not tailored to the investment needs of any specific person and therefore does not involve a consideration of any of the investment objectives, financial situation or needs of any viewer that may receive it. Kindly also note that past performance is not a reliable indicator of future results. Actual results may differ materially from those anticipated in forward-looking or past performance statements. We assume no liability as to the accuracy or completeness of any of the information and/or content provided herein and the Company cannot be held responsible for any omission, mistake nor for any loss or damage including without limitation to any loss of profit which may arise from reliance on any information supplied by TFA Global Pte Ltd.
The speaker(s) is neither an employee, agent nor representative of Tradu and is therefore acting independently. The opinions given are their own, constitute general market commentary, and do not constitute the opinion or advice of Tradu or any form of personal or investment advice. Tradu neither endorses nor guarantees offerings of third-party speakers, nor is Tradu responsible for the content, veracity or opinions of third-party speakers, presenters or participants.
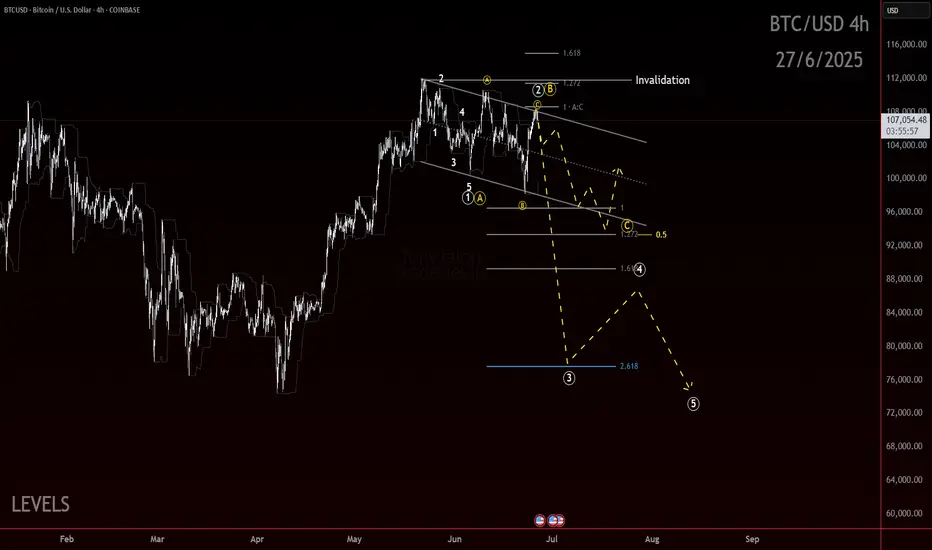
Bitcoin Top is In! Bear considerationsPrice has been carving out an unclear correction off the high. The recent structure has many squinting. Is it done or the calm before another wave of selling?
I am weighing two bearish scenarios here. One is more aggressive than the other. But both start with the same idea. No new high before another low.
Let’s start at the top.
The initial move down off the recent high could count as an impulse. Whether that is a wave 1 or a wave A is still up for judgment. Either way, that first leg sets a bearish tone at the larger degree.
Here’s where it gets interesting. The correction since then shows traits of a flat. A running one at the moment.
This opens the door to two active bearish projections:
A wave C collapse, implying a completed A B C correction and a downside resolution.
A wave 3 drop, for a possible top if this is an impulsive sequence.
That is the fork in the road. And it all hinges on the next move.
Right now, the smallest degree impulse off the low is doing some heavy lifting.
If that pivot holds and we only get an internal retracement like a micro wave 2, the door is still open for upside continuation.
But if that impulse gets invalidated, I would expect bears to press. First for a break below 100k, then toward the 95k area.
Here is how to think about it:
Hold the small impulse → Potential upside
Break the impulse base → Wave C or 3 likely underway
Context still leans bearish. Lower highs are still in play. But we are hunting a specific structure to confirm it.
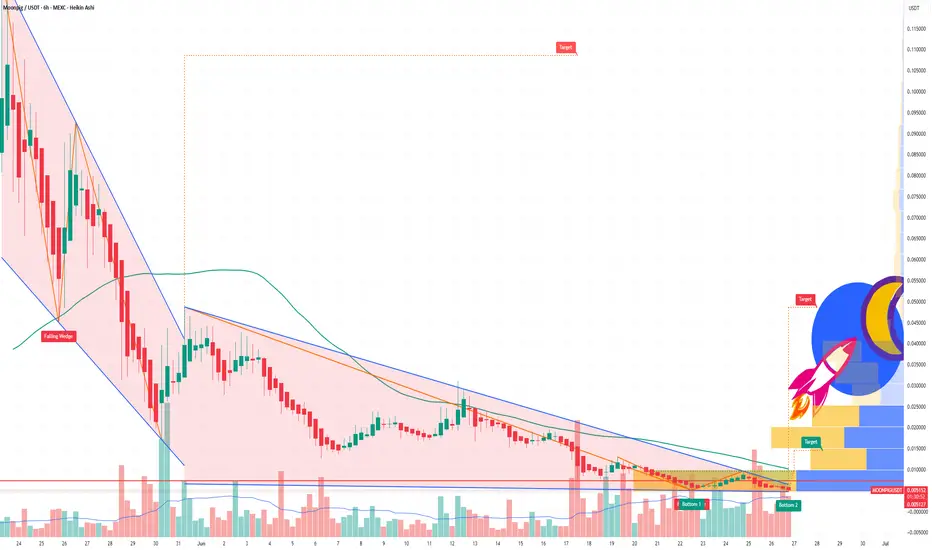
MOONPIG - Solana Meme Coin Ready to Rocket in the Next Bull RunTechnical Analysis: Bullish Signals Flashing Bright:
The MOONPIG/USDT chart is painting a bullish picture. After a sharp retracement from its all-time high near a $125M market cap, the token has found solid support around $0.0045 and is now trading at $0.0052, showing signs of a reversal. Here’s what the charts tell us:
Breakout Momentum: On the 6-hour chart, $MOONPIG recently broke above a key downtrend line, signaling a shift from bearish to bullish momentum. A potential double bottom pattern suggests a continuation toward $0.008 or higher.
Support and Resistance: The $0.0045 level has held as strong support, with resistance looming near $0.0075 (a recent high). A clean break above $0.0075 could open the door to $0.01 or beyond, aligning with the 1.618 Fibonacci extension from the recent swing low.
With Bitcoin rallying and altcoins showing signs of life, $MOONPIG’s technical setup screams opportunity for traders eyeing a breakout.
Fundamentals:
Community Power: With over 18,000 holders as of early June 2025, $MOONPIG boasts a fiercely loyal community. Unlike many meme coins reliant on paid shills, its growth is organic, driven by retail investors who love its “normie-friendly” branding. Posts on X highlight strong morale, with users like JamesWynnReal calling it a “raging bull flag” poised for a $50M–$100M market cap.
Exchange Listings: Recent listings on HTX Global, MEXC, and LBank have boosted liquidity and visibility, with more exchanges reportedly in talks. These listings are a catalyst for retail FOMO, as seen in the $7M+ on-chain trading volume.
Solana’s Hot Streak: Solana’s fast, low-cost blockchain is the perfect home for meme coins like $MOONPIG. With Solana’s ecosystem thriving and retail interest in tokens like $POPCAT and SEED_WANDERIN_JIMZIP900:WIF soaring, $MOONPIG is well-positioned to ride the wave of altseason capital inflows.
Market Timing: As Bitcoin nears new highs and market sentiment turns bullish, low-cap meme coins historically see explosive gains.