Bitcoin Update 25.06.2025 —Altcoins, Top Altcoins Choice & MoreGood morning my fellow Cryptocurrency trader, I hope you are having a nice week and a wonderful day.
We have good news to start today and it is all based on Bitcoin's price action. This is going a bit deep on the daily noise, price swings.
Price action analysis
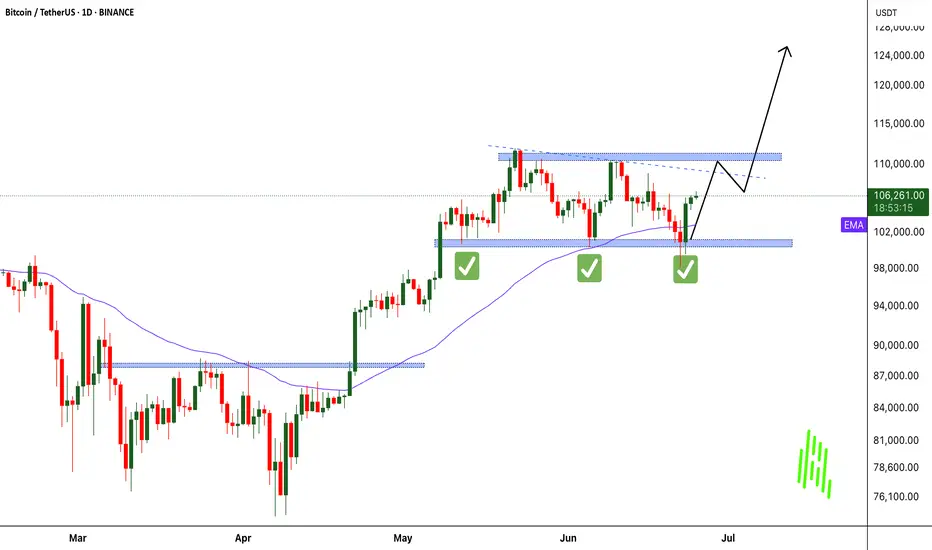
Bitcoin went deep on its sideways range and tested below 100K. This is normal for a sideways market. The positive news comes from the fact that Bitcoin is once more trading above $106,000 and already hit above $107,000. This type of action reveals a bullish bias.
If the market was mainly bearish with a major drop on the deck, say going below 90K or 80K even, then Bitcoin would not be allowed to go beyond $105,000. In fact, any bounce or small recovery would be quickly sold as bear would be active, waiting and selling each time prices move up.
The fact that Bitcoin can grow day after day and consume all selling pressure while doing so, reveals a strong presence from buyers. We know this to be true because Bitcoin is now in a new phase in its evolution and growth cycle. It is truly a young technology that only now is being fully accepted with plenty of room available for growth.
We have three instances where Bitcoin moved above 110K. The selling that happened afterward is not filled with pressure, instead you can see some standard candles as prices continue to consolidate.
On the other hand, notice the last session from 21-June (21-24 June —3D candles). You can see a long lower shadow, a bullish hammer; there was definitely strong buying pressure as soon as Bitcoin reached below support.
Altcoins market action
Some altcoins continue to produce multi-months high. The highest price since January 2025. These altcoins recovered, started to rise and continue rising in clear, standard bull market fashion. Literally straight up.
Some altcoins did even better and grew as high as December or November 2021. The highest price in almost four years. This is very important when we go deep into the chart and price action because it is the main revealing signal. The altcoins simply do not go on a major bull market before a market crash. If the altcoins are recovering or rallying, it is because the market is set to "buy." The Cryptocurrency market is in bullish mode.
If the market was set to drop long-term then we would be experiencing a rise that is running out of momentum. This rise would later peak and a surprise sudden flash crash would signal the start of a major downturn. This is not what we see.
Inversely, if prices are going to rise strongly we start by seeing some form of retrace or correction, this event losing momentum and volume and then finally a strong bullish jump as soon as support is confirmed. This bullish jump would signal the start of a major market move. This is what we are experiencing today.
Bitcoin & Altcoins
Bitcoin and the altcoins move together. Bitcoin leads the altcoins, the altcoins reveal what Bitcoin will do when the action is sideways.
We can always say that Bitcoin is leading the altcoins of course because Bitcoin has been growing non-stop since November 2022. The major trend being bullish the altcoins are set to follow at some point.
Now, when Bitcoin goes sideways, by definition, anything goes. The market can break-down just as it can break-up. This is where the altcoins become useful.
If smaller Cryptocurrency projects are moving ahead, strongly and even producing 3-4 multi-year highs, it reveals what Bitcoin will do once its consolidation period ends.
Buying Bitcoin
In short, Bitcoin is going up. The next major market move is a rise and we have proof coming from the signals, the altcoins and the charts.
Never again in its history Bitcoin will trade below 80K. 90K soon to be gone... Once the action starts, you will look like a genius for buying below $110,000.
What to choose: Bitcoin or altcoins?
Now, my personal suggestion is different. If you are not a whale, the way to go are the altcoins. Why? Because there is more room for these to grow. We can say that the altcoins are riskier, but risk is almost non-existent with spot. We can simply focus on the pairs that have been filtered by the major exchanges. Reputable pairs with a long track record and plenty of room available for growth. You can't go wrong with those.
If you are ready for the 2025 bull market, leave a comment below.
Altcoins analysis by request
I think it is time for a new Your Top Altcoins Choice, session. It is always wise to do these when the market hits bottom or before a major bullish wave, that's exactly where we are now. If you agree and would like to see a new session, leave a comment saying "Yes! Top Altcoins Choice." If there is enough interest we can work together and find many hidden gems. It can be done with your support.
Namaste.
Bitcoin (Cryptocurrency)
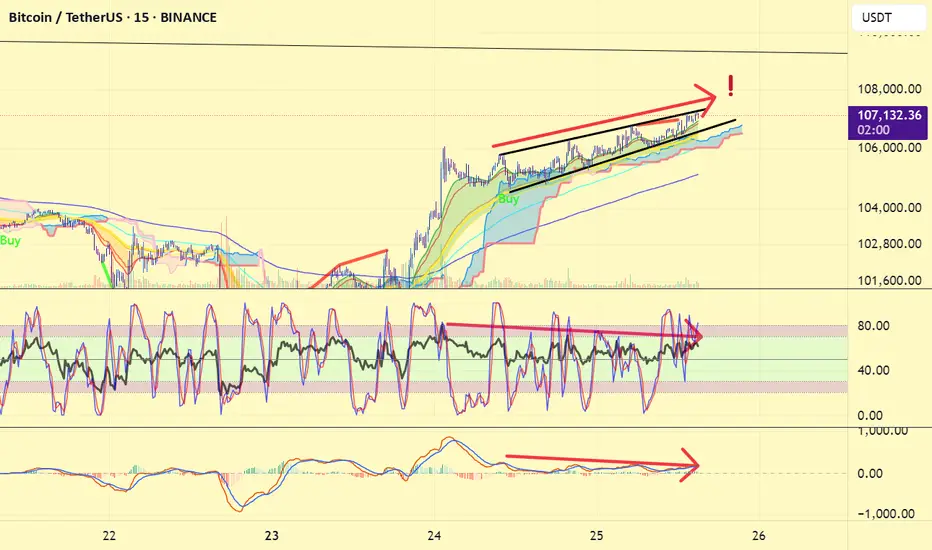
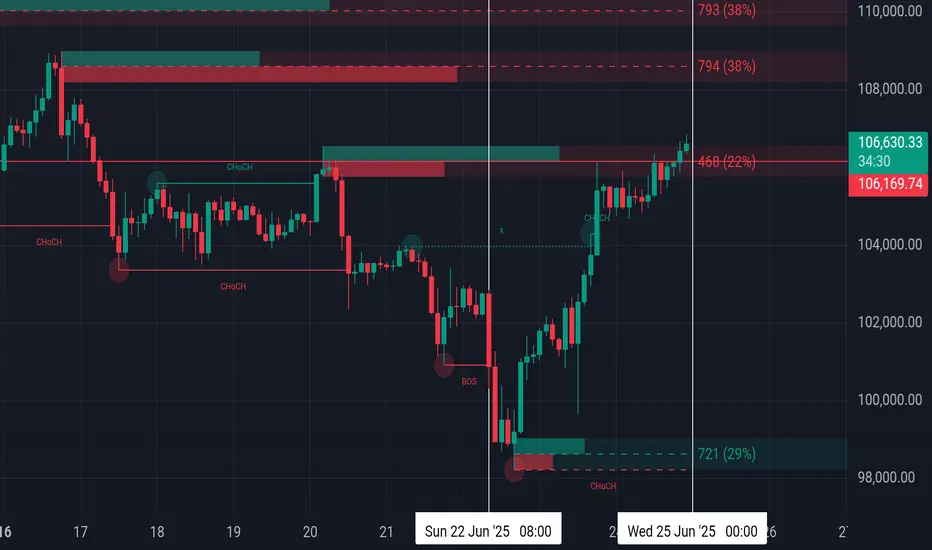
What now BTC?#bitcoin price has been moving in an ascending wedge for a few days. Although ascending wedges may end up bearish, there' s another chance for #btc price to break out this wedge and catch upper liquidities above 108K. But, also there' s a bearish divergence has been forming in this lower time frame chart of #btcusdt .
Maker may ignore this divergence and allow bots to print another HH but it' s now wise to be careful and watch out. The reverse is acceptable for #usdt dominance chart.
Breaking out 110K is the temporary invalidation of bull trap and above 120K is the complete invalidation.
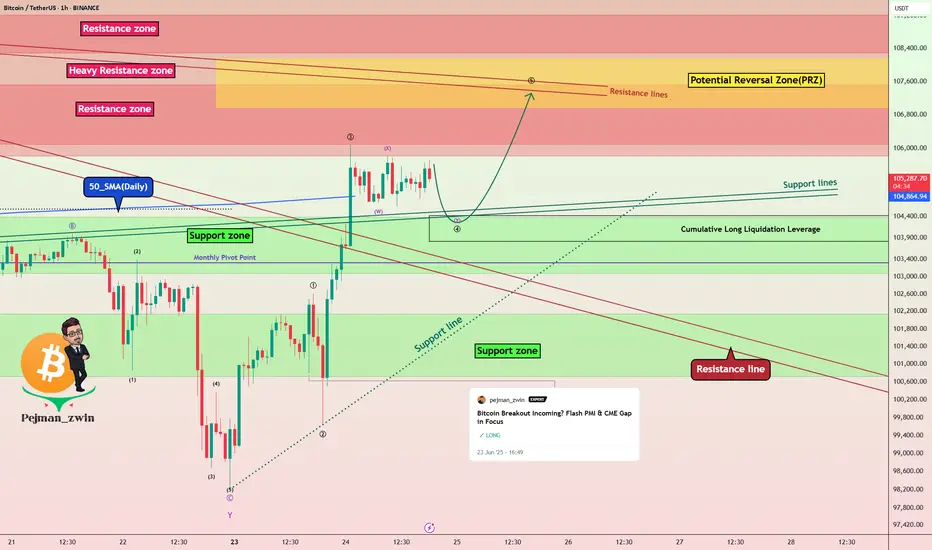
Bitcoin Roadmap: Key Levels to WatchBitcoin( BINANCE:BTCUSDT ) managed to pump as I expected yesterday , of course, the main catalyst could have been the ceasefire announcement between Iran and Israel , which had a major impact on high and medium risk assets in the financial markets .
Bitcoin is once again moving near the Heavy Resistance zone($110,720-$105,820) and the Resistance zone($107,520-$106,100) after breaking the Resistance lines .
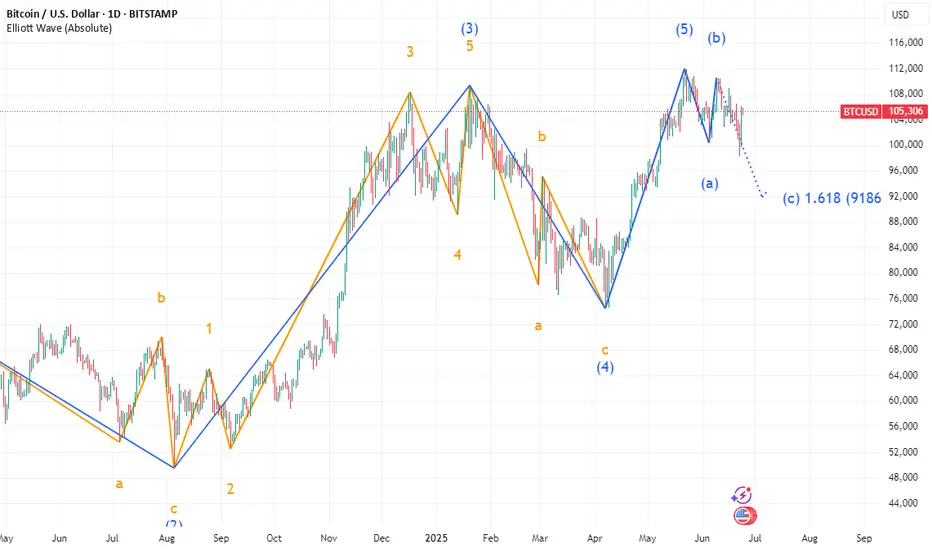
In terms of Elliott Wave theory , it seems that given Bitcoin’s bullish momentum , Bitcoin has completed the main wave 3 and is currently completing the main wave 4 on the 1-hour time frame . The corrective wave structure of wave 4 could be a Double Three Correction(WXY) .
I expect Bitcoin to start rising again near the Support zone($104,380-$103,060) , 50_SMA(Daily) , Support lines , and Cumulative Long Liquidation Leverage($104,412-$103,812) to rise at least to the Potential Reversal Zone(PRZ) and Resistance lines .
Note: Stop Loss(SL)= $102,600 = We can expect more dumps.
Please respect each other's ideas and express them politely if you agree or disagree.
Bitcoin Analyze (BTCUSDT), 1-hour time frame.
Be sure to follow the updated ideas.
Do not forget to put a Stop loss for your positions (For every position you want to open).
Please follow your strategy and updates; this is just my Idea, and I will gladly see your ideas in this post.
Please do not forget the ✅' like '✅ button 🙏😊 & Share it with your friends; thanks, and Trade safe.
Updated Chart and Levels. Peace firstVideo:
🕊️💛 Bitcoin Love and Peace! Let's go 🚀🧘♂️
Hello Traders,
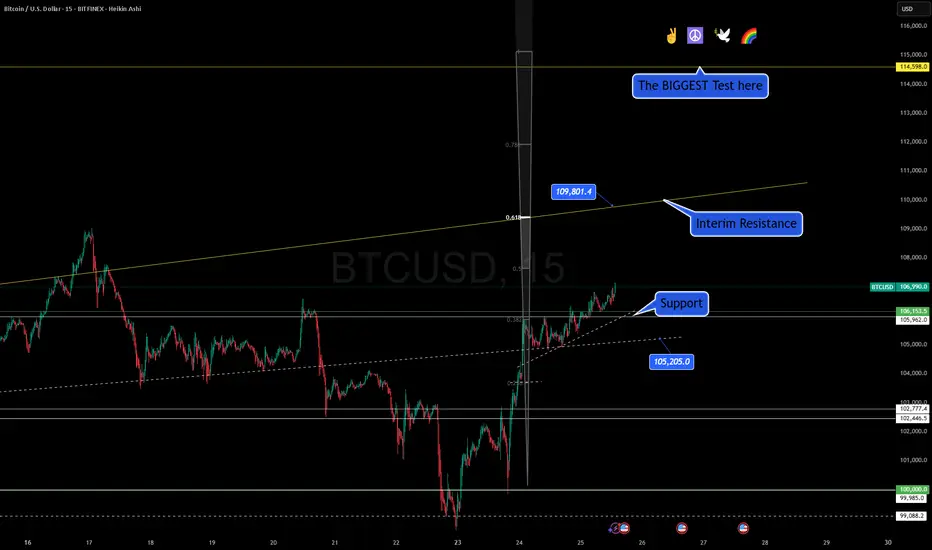
The world may be tense, but Bitcoin is offering a beacon of calm and opportunity. 🌍💡 We've established strong support at 106,153 and 105,962, and with peace settling in geopolitically and a softer tone from the Fed, the market is primed for movement.
📊 What I see:
Support is holding beautifully
Short-term breakout structure building up
Immediate resistance at 109,801
Bigger test zones at 113,800 and 114,598
Altcoins? They're sitting in the backseat. BTC dominance is around 65%, confirming that Bitcoin is the leader right now. If you're hunting momentum, this is where your focus should be.
As I always say—never long disaster, never short peace. And right now, with the War of 12 Days behind us, Bitcoin reflects hope and progress.
So let’s trade smart, stay grounded, and always remember—hate makes you part of the problem, love makes you part of the solution. Let’s build a world where even enemies become friends. 💞
One Love,
The FXPROFESSOR 💙
Disclosure: I am happy to be part of the Trade Nation's Influencer program and receive a monthly fee for using their TradingView charts in my analysis. Awesome broker, where the trader really comes first! 🌟🤝📈
Bitcoin Love and Peace! Let's go🚀📈 Bitcoin Rally Gains Steam with Strong Support in Place 💪🧠
Hello Traders,
After a period of geopolitical tension and heavy volatility, the charts are finally giving us a breath of calm. 🕊️ BTC/USD on the 15-minute chart has formed a solid base of support between 106,153 and 105,962. This area has now held up well and is acting as a launchpad for potential upside continuation.
🔍 Technically speaking, we’re observing:
Price holding above the 0.5 Fib retracement
A short-term breakout structure forming higher highs
Key interim resistance at 109,801
Long-term resistance to watch at 113,800 and the crucial macro test at 114,598
With Bitcoin dominance sitting at 65%, it's clear: this is Bitcoin’s moment. Altcoins are lagging, and BTC is leading the charge.
⚖️ The broader narrative is also shifting. The Fed's dovish tone adds to market stability, and in times of peace, Bitcoin thrives. But the key level to monitor remains 109K. A breakout above that sets us up for a major move.
Let's keep an eye on this structure. A failure to hold the 105K zone would shift the outlook, but for now, all systems are GO 🚦.
🕊️ Remember, in both trading and life—hate divides, love unites. Choose to be part of the solution.
One Love,
The FXPROFESSOR 💙
Disclosure: I am happy to be part of the Trade Nation's Influencer program and receive a monthly fee for using their TradingView charts in my analysis. Awesome broker, where the trader really comes first! 🌟🤝📈

A Disciplined Approach to BTC/USDT - Wait for the Right Set Up!Right now, I’m closely monitoring BTC/USDT — and what immediately jumps out is how aggressively this rally has pushed upward 🚀. We’ve seen price climb into a key external range high, taking out liquidity that was likely sitting just above those prior highs 💧.
This kind of move is often where institutional players step in to offload positions, as the liquidity makes it easier to find counterparts for previous accumulation phases 🏦. The way this price action is unfolding, I wouldn't be surprised to see a correction or retracement soon.
With the market this stretched, I’m not looking to get long here — especially not while BTC is trading at such a clear premium 🎯. No edge in chasing the highs.
Instead, I’ll be sitting back, waiting for a healthy pullback and a confirmed bullish structure shift before considering any entries 🔄📊. There’s no need to force trades in these conditions. Patience protects capital 🛡️.
⚠️ As always, this is not financial advice — just my current market perspective.

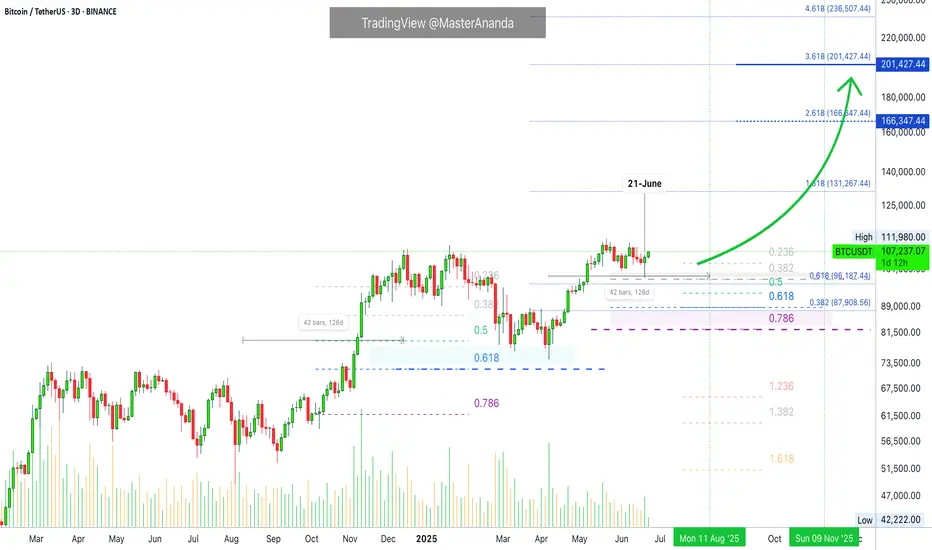
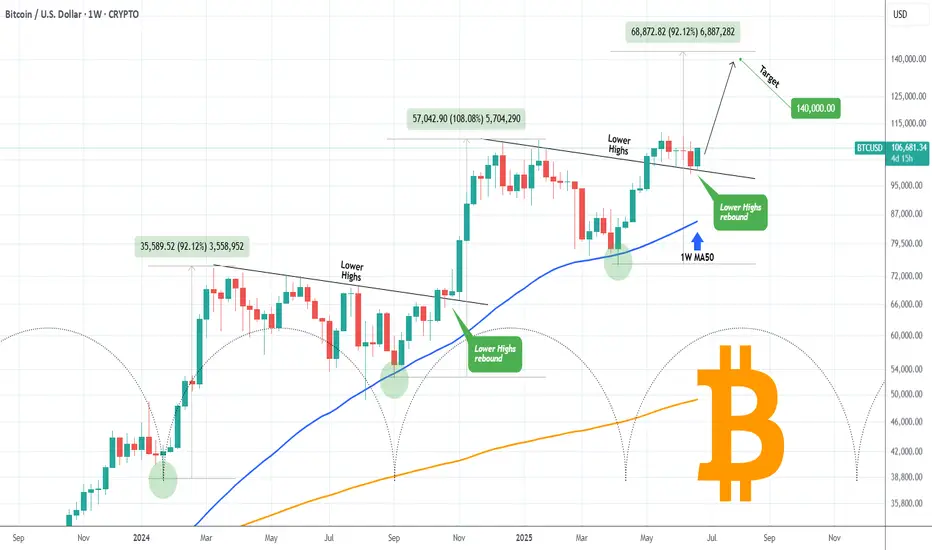
BITCOIN Major Pivot bounce eyes $140000!Bitcoin (BTCUSD) has started off the week with a huge 1W candle bounce on the former Lower Highs trend-line (that started on its All Time High), which has now turned into a Pivot. That trend-line held both last week and 3 weeks ago.
The very same Pivot test took place (October 2024) at the start of the previous Bullish Leg, resulting into a massive rebound that peaked upon a +108.08% rise. That was even higher than the Bullish Leg before it (+92.12%), which also started after a 1.5 month consolidation (Dec 2023 - Jan 2024).
Interestingly enough those Legs show an amazing frequency as the Time Cycles show on their bottoms. Assuming the current Bullish Leg will follow the 'bad case' scenario of +92.12%, we should be expecting to see at least $140000 before the next pull-back/ consolidation.
Do you think such Target is feasible by the end of August? Feel free to let us know in the comments section below!
-------------------------------------------------------------------------------
** Please LIKE 👍, FOLLOW ✅, SHARE 🙌 and COMMENT ✍ if you enjoy this idea! Also share your ideas and charts in the comments section below! This is best way to keep it relevant, support us, keep the content here free and allow the idea to reach as many people as possible. **
-------------------------------------------------------------------------------
💸💸💸💸💸💸
👇 👇 👇 👇 👇 👇
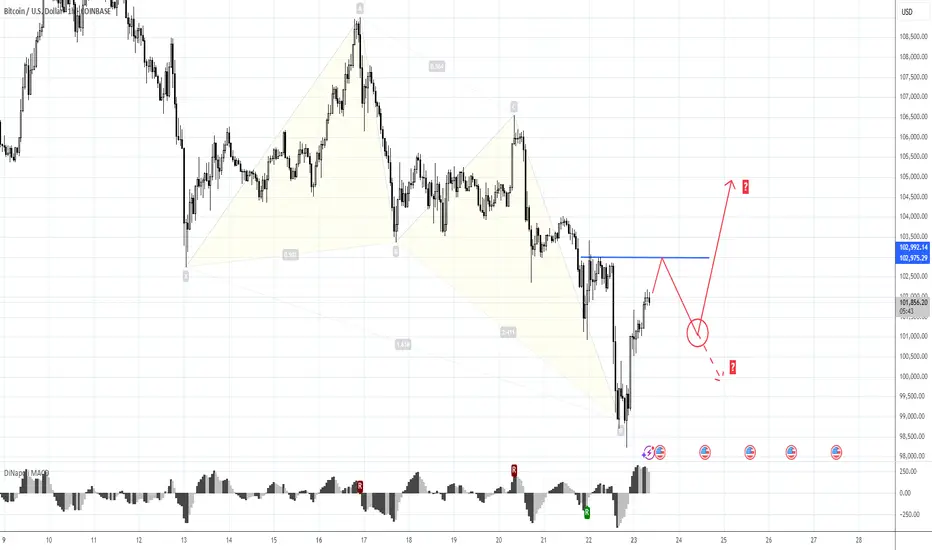
103 to 101K trade and reverse H&S patternMorning folks,
So, our Thu setup is done perfect, both targets are met and even more. Now we consider two different fast trades on BTC.
Now context remains bearish and 103K is rather strong 4H resistance area. So, first trade is scalp "Sell" from ~ 103K with "at least" target of 101K. In fact, choosing of 101K as a minimal target is based on the 2nd trade.
2nd trade is potential reverse H&S is sentiment on the market will start changing. But this is not the fact yet. That's why I place downside arrow here as well, if H&S will not be formed or start failing, BTC could drop lower so, downside trade might be even better.
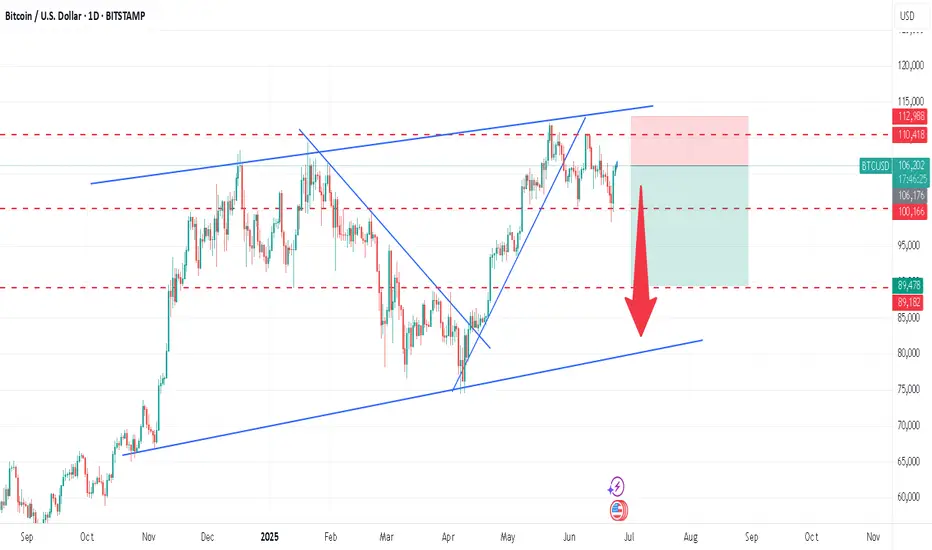
BTCUSD : HUGE FALL AHEAD ? Sell at 106200 or below
Stoplos : 113000
Target : 100000, 90000
BTCUSD struggling hard to make new highs. Retest of 90k level expected.
Bitcoin Reclaims Momentum: War Fears Fading, Bulls Eye $125K! MARKETSCOM:BITCOIN just delivered a powerful bounce right off the critical $100K level. A key psychological and technical support zone tested multiple times in recent sessions. This time, the bounce came with strong volume confirmation, signaling renewed buyer interest. As geopolitical tensions in the Middle East begin to ease, market confidence is returning, fueling bullish sentiment across the board.
CRYPTOCAP:BTC now looks poised to retest the $110K resistance zone, where some short-term rejection could occur. However, a decisive breakout above $110K opens the gates for a potential rally toward the next major target at $125K. Stay sharp, always manage your risk, and don’t forget to set a proper stop loss. The trend is strong, and momentum is building!
Follow Our Tradingview Account for More Technical Analysis Updates, | Like, Share and Comment Your thoughts
Bearish Money Flow looking for 101kPer 2hr chart I can see a bearish divergence as smart money is unloading. This is is a liquidity grab by the whales. I eventually see Bitcoin retracing back to 98k. I will layered my charts gradually for you to review... disclosure I do have a short position active.
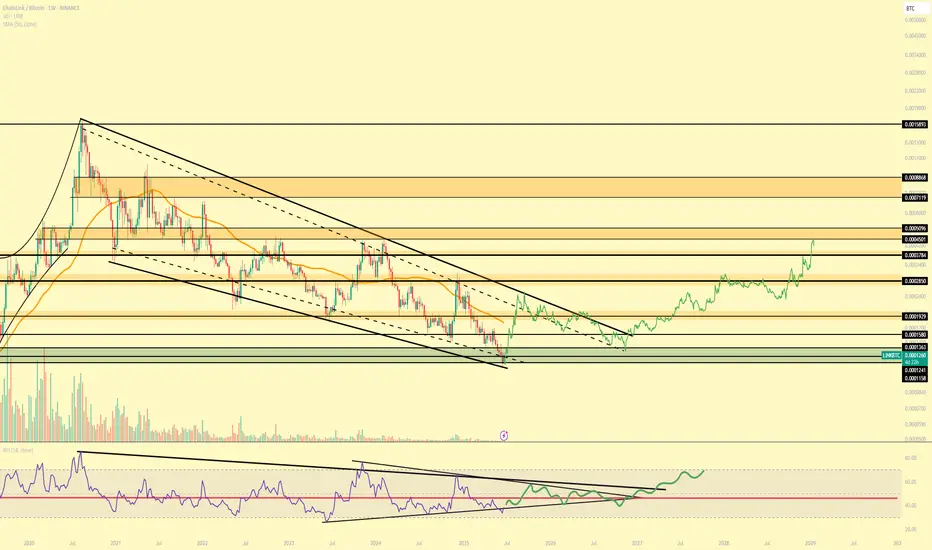
LINK / BTC Looking Juicer Than EverEven if you aren't aware of the fundamentals of LINK adoption & application , the chart speaks for itself.
Would be very surprised is LINK isn't bottoming out here and all it needs is a bit of sideways before we get some expansion and mark-up.
Circle Collapse - Will COIN follow? Circle stock has been on a wild ride lately
After a meteoric rise of over 700% since its IPO on June 5, it's now facing some turbulence:
- Today, the stock dropped nearly 16%, partly due to Cathie Wood’s ARK Invest selling $110 million worth of shares.
- Analysts are also sounding caution. Compass Point initiated coverage with a $205 price target—below its current trading price—citing rising competition in the stable coin space.
- Despite the dip, some still see long-term potential. A recent Forbes analysis explored whether Circle could hit $500 per share, driven by growth in USDC reserves and infrastructure revenue.

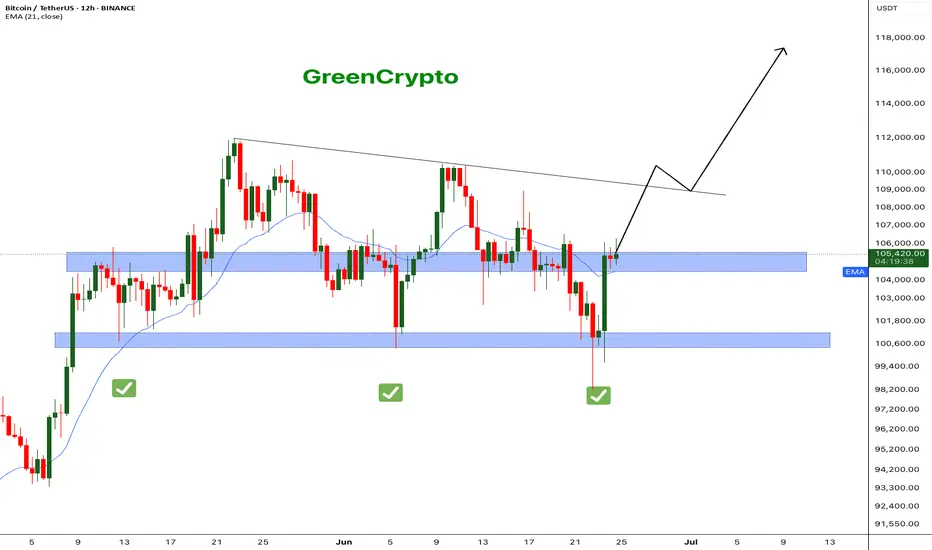
Bitcoin - What's next ? BINANCE:BTCUSDT (12H CHART) Technical Analysis Update
Now that ceasefire is announced, bitcoin price has successfully recovered to the resistance level and currently trading at the resistance zone. It's critical that bitcoin breaks this resistance for it to hit the next resistance around 110K .
I'm expecting price to reach 110k this week and we can see some consolidation in that range before moving further up.
Follow our TradingView account for more technical analysis updates. | Like, share, and comment your thoughts.
Cheers
GreenCrypto
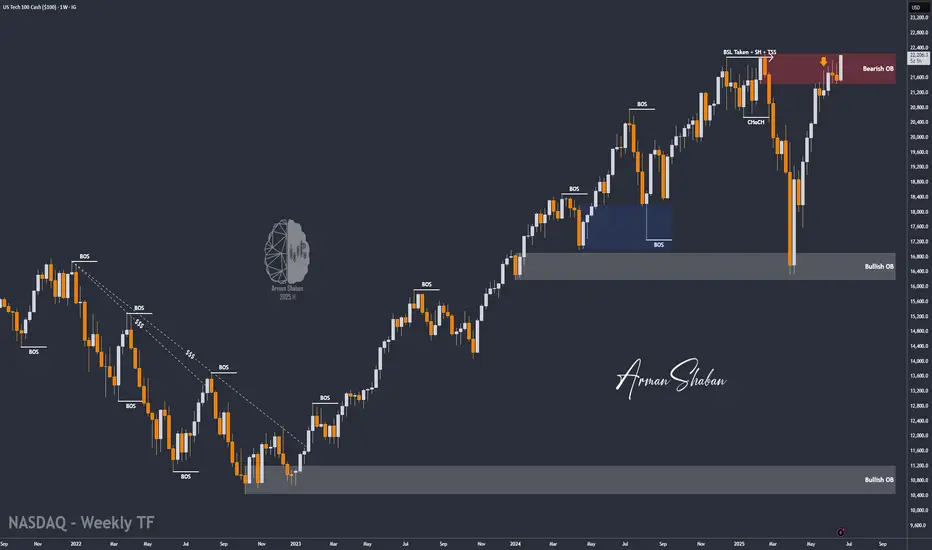
Nasdaq Surges on Ceasefire Hopes – New All-Time Highs Ahead?By analyzing the #Nasdaq chart on the weekly timeframe, we can see that the index experienced a strong rally following the ceasefire announcement between Iran and Israel, climbing as high as 22,200 so far. If the ceasefire holds and tensions continue to ease, we could see a new all-time high for the Nasdaq.
Potential bullish targets for this move are 22,400, 23,200, and 24,000.
Please support me with your likes and comments to motivate me to share more analysis with you and share your opinion about the possible trend of this chart with me !
Best Regards , Arman Shaban
Bitcoin - We have to see new highs now!Bitcoin - CRYPTO:BTCUSD - is now at the previous highs:
(click chart above to see the in depth analysis👆🏻)
It could really not be more exciting on Bitcoin at the moment. With the current "all or nothing" potential breakout or double top creation, we will either see a bullrun or a bear market. So far, bulls are still strong, so the chances of a breakout luckily remain higher.
Levels to watch: $100.000
Keep your long term vision!
Philip (BasicTrading)

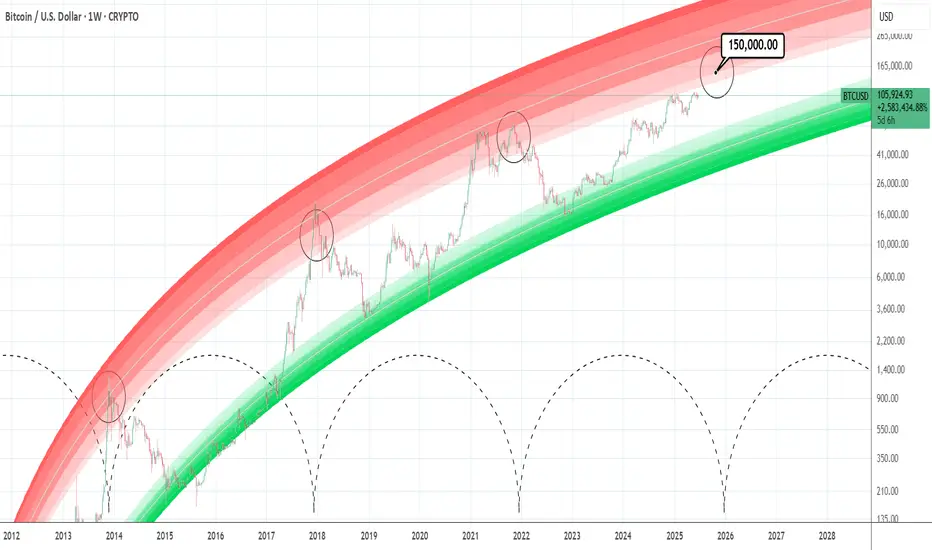
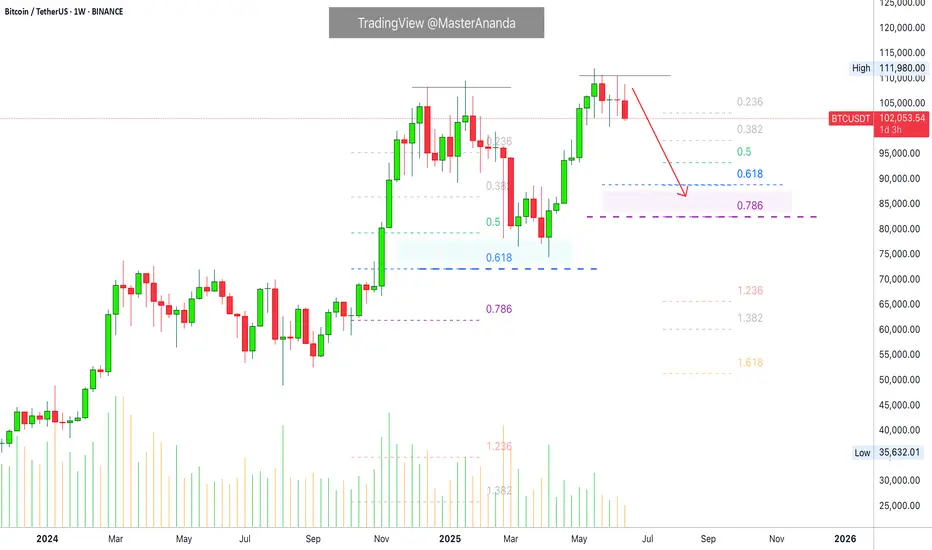
BTCUSD: Minimum target for this Cycle is 150,000Bitcoin turned neutral again on its 1D technical outlook (RSI = 52.882, MACD = -410.600, ADX = 22.509) as it recovered the losses of the last 2 days thanks to the Truce announcement between Israel and Iran. The long term picture couldn't be more bullish however as it hasn't even hit the bottom red zone of the Logarithmic Growth Curves model. According to the Time Cycles that mark each Cycle High, the Top for this Cycle is estimated to be between October and December. By October 2025, the top of the first profit taking zone (lightest pink) would be $150,000. That is technically the bare minimum of Top that should be expected based on the current LGC model. Technically it can even hit $200,000 but fundamentals have to help a lot in this scenario (adoption, ETFs, rate cuts).
## If you like our free content follow our profile to get more daily ideas. ##
## Comments and likes are greatly appreciated. ##
Bitcoin Recovers...What we've learned in the past few years is that Bitcoin's demand is just too strong. Retraces and corrections are no longer wild like before, these are limited and capped. Nobody wants to take the risk of selling too much and being left out or losing their Bitcoins for good, they are just too valuable. Many times more valuable than the USD Dollar or Gold. It is the most valuable asset in the whole digital world.
Other than food and toilet paper, nothing is more valuable than Bitcoin.
Technical analysis
Ok, let's focus on the chart.
The retrace has been ongoing for 31 days, since 22-May.
Total drop amounts to 12.33% (-12%).
The action moved below the 5-June low around $100,400. Bitcoin is now back above this level. Clearly showing that this is a stop-loss hunt event.
Stop-loss hunt and liquidity hunt because thousands, if not millions, of over-leveraged traders have been liquidated. They were betting on the wrong side short-term. Long-term yes, bullish is the trend, the direction and the win. Short-term, it was SHORT but not anymore.
Never trade with 20X that's crazy. Imagine going LONG 20X at the all-time high? Isn't that stupid?
I can bet you the same people didn't want to buy LONG when Bitcoin was trading at $75,000. In fact, I can bet that these people that just got liquidated were selling below $80,000 and buying LONG with 20X at $110,000. A recipe for disaster.
Anyway, I am calling it early. This is it, we are going up.
I got my signals, as you already know, from the altcoins.
If you agree boost and follow.
Thanks a lot for your continued support.
Namaste.
Bitcoin Targets $105K as Portfolio Share Soars But...
The year 2025 is proving to be a watershed moment for Bitcoin. The world's premier cryptocurrency has solidified its position as the bedrock of digital asset portfolios, now accounting for nearly one-third of all holdings, a testament to its growing acceptance as a legitimate macro-asset. Yet, this rising dominance belies a fractured and complex market landscape. While institutional giants and sovereign wealth funds systematically increase their Bitcoin allocations, a counter-current is flowing through the retail sector, where investors are rotating into high-potential altcoins, spurred on by the promise of new investment vehicles. This bifurcation is unfolding against a backdrop of dramatic price swings, conflicting technical forecasts, and a potent mix of macroeconomic and geopolitical catalysts, painting a picture of a market at a pivotal crossroads.
The headline statistic is striking: as of mid-2025, Bitcoin's share in investor crypto portfolios has climbed to nearly 31%, a significant increase from the previous year. This growth has persisted through months of volatility, including harrowing dips below the psychological $100,000 mark and powerful rallies reclaiming levels above $105,000. The market is being pulled in opposing directions. On one hand, bullish tailwinds are gathering force. A ceasefire in the Middle East has calmed geopolitical jitters, restoring appetite for risk assets. Simultaneously, hints from the U.S. Federal Reserve of a potential July interest rate cut have investors anticipating a surge of liquidity into the market.
However, a sense of unease permeates the technical charts. Some analysts warn of a "final crash" still to come, drawing parallels to the market structure of 2021. On-chain analysis has identified the $97,000 to $98,000 range as a critical market pivot, a line in the sand that could determine the next major trend. Meanwhile, other models, like the Elliott Wave count, predict a corrective crash to as low as $94,000 before any new highs can be sustainably achieved.
This is the story of Bitcoin in 2025: a maturing asset cementing its institutional role while navigating the turbulent waters of retail speculation, macroeconomic shifts, and its own volatile price cycles. The journey toward becoming a third of all crypto holdings has not been a straight line, but a dramatic tug-of-war that will define the future of the digital asset class.
Part 1: The 31% Benchmark - Bitcoin's Ascendant Portfolio Dominance
The steady climb of Bitcoin to nearly 31% of investor portfolios is the defining trend of 2025. This figure, a cornerstone of market analysis this year, underscores a profound shift in investor conviction. Through a period marked by six-figure price tags and gut-wrenching volatility, the average investor has not been scared away but has instead deepened their commitment to the original cryptocurrency. This suggests a maturing "buy the dip" mentality, where price corrections are increasingly viewed not as a crisis, but as an opportunity to accumulate a long-term store of value.
The primary engine behind this trend is unmistakable: institutional adoption. The floodgates, first opened by the launch of spot Bitcoin ETFs, have become a torrent of institutional capital in 2025. Sovereign wealth funds, major financial institutions, and public companies are now systematically accumulating Bitcoin, treating it as a core component of their treasury and investment strategies. Observations of institutional trading desks indicate this buying pressure from large-scale investors intensified in the first half of the year, even as retail activity showed signs of slowing. This institutional stamp of approval is reflected in the growing number of Bitcoins held in various corporate treasuries and exchange-traded funds.
This institutional embrace of Bitcoin has been fueled by several factors. First, an increasingly innovation-friendly regulatory environment in the United States has provided the clarity that large, compliance-focused firms require. Second, Bitcoin’s performance has been undeniable. Following recent shifts in the political landscape, Bitcoin has outperformed many major global assets, including stocks, treasuries, and precious metals, solidifying its reputation as a powerful portfolio diversifier.
This "flight to quality" within the crypto space has also created a distinct rotation story. As institutions fortify their Bitcoin positions, they appear to be de-risking by moving away from more speculative assets that were darlings of the previous cycle. The most notable casualty of this shift has been Solana. Once a high-flyer, Solana's narrative has "cooled" in 2025. Its portfolio weight among investors has seen a sharp decline since late 2024, as institutional capital pivots toward assets with perceived staying power and clearer narratives. While some analysts see this cooling phase as a potential accumulation opportunity before a new leg up, the dominant trend has been a rotation out of Solana and into the perceived safety of Bitcoin.
Part 2: The Great Divide - A Tale of Two Investors
The crypto market of 2025 is characterized by a stark divergence in strategy between its two main cohorts: institutional players and retail investors. While their actions collectively push Bitcoin's portfolio share higher, their underlying motivations and asset choices paint a picture of two different worlds.
The Institutional Playbook: Slow, Steady, and Strategic
For institutions, Bitcoin has become the undisputed king. Their approach is methodical and long-term, driven by a desire for a non-sovereign, inflation-resistant asset that acts as a hedge against macroeconomic instability. The attributes of scarcity, immutability, and portability are paramount in their decision-making. The advent of regulated products like spot ETFs has been a game-changer, providing a familiar and secure access ramp for deploying significant capital.
These large players are not chasing the explosive 100x gains that define crypto lore. Instead, they seek sustained, risk-adjusted returns from an asset that is increasingly uncorrelated with traditional markets during times of stress. Their strategy is one of accumulation, and their exit from more volatile altcoins like Solana is a clear signal of a de-risking mandate. They are building foundational positions in the asset they view as "digital gold," positioning themselves for a future where Bitcoin is a standard component of diversified global portfolios.
The Retail Rebellion: Chasing the Next Big Narrative
In stark contrast, retail investors appear to be reducing their direct Bitcoin holdings. This is not necessarily a rejection of Bitcoin's value, but rather a strategic reallocation of capital toward what they perceive as the next frontier of high growth. Having witnessed Bitcoin's journey to a multi-trillion-dollar asset, many retail participants are now hunting for "the next Bitcoin"—assets with a lower market capitalization but a powerful, near-term catalyst that could trigger exponential gains.
Part 3: The Analyst's Crystal Ball - Price Targets and Technical Tremors
Navigating the Bitcoin market in 2025 requires a steady hand and a tolerance for conflicting signals. While macro-environmental factors are painting a bullish picture, technical and on-chain analyses are flashing cautionary signs, creating a tense equilibrium between hope and fear.
The Bullish Case: A Confluence of Catalysts
The bulls have strong reasons for optimism. A key level on every trader's chart is $105,000. This price is seen as a critical "trend switch"; a decisive break and hold above this zone would signal the end of the recent consolidation and the beginning of a new, powerful phase of the bull market. This optimism is underpinned by powerful external forces.
First, the U.S. Federal Reserve has been signaling a potential interest rate cut as early as July. Historically, lower interest rates reduce the appeal of traditional yielding assets like bonds, pushing investors toward riskier, high-growth assets. This injection of liquidity into the financial system has often preceded significant rallies in Bitcoin, and the market is pricing in this possibility.
Second, a significant de-escalation of geopolitical tensions has bolstered market confidence. The announcement of a ceasefire between Israel and Iran caused an immediate and positive reaction in risk assets. Bitcoin surged past $105,000 on the news, demonstrating its sensitivity to global stability. During times of acute conflict, markets often experience a flight to safety, but when tensions ease, that capital flows back into assets like Bitcoin, which thrive on renewed risk appetite.
The Bearish Counterpoint: Echoes of the Past and On-Chain Warnings
Despite the bullish macro-outlook, clouds remain on the horizon. Some market commentators are warning that the current market is mirroring the patterns of 2021, suggesting that one "final crash" may be necessary to flush out leverage and establish a firm bottom before a sustainable move to new all-time highs.
This thesis is supported by specific technical models. Proponents of Elliott Wave Theory, a method of analysis that posits markets move in predictable, repetitive wave patterns, suggest a significant correction is due. Some Elliott Wave counts predict a corrective move down to the $94,000 level, which would represent a substantial pullback from current prices. Such a move would be seen as a healthy, albeit painful, corrective wave before a final, explosive impulse higher.
Adding weight to this cautious outlook is deep on-chain analysis. A close look at blockchain data pinpoints the $97,000 to $98,000 zone as the market's next true "pivot." This range represents a massive concentration of supply where a large volume of Bitcoin was previously acquired. This means a large cohort of investors has a cost basis in this zone. As the price approaches this level from below, it will likely meet significant selling pressure from investors looking to break even. A failure to decisively break through this wall of supply could trigger a sharp rejection and validate the bearish corrective scenarios.
The Derivatives Dilemma: A Market in Flux
Further complicating the picture is the state of the Bitcoin derivatives market. Reports indicate that futures buying activity has declined sharply, suggesting that the speculative fervor that often fuels rallies may be waning. This can be interpreted in two ways. The bearish view is that speculators are losing confidence, and the market lacks the momentum for a continued push higher. However, a more bullish interpretation is that the market is purging excessive leverage, creating a more stable foundation for a rally built on spot buying—the very kind of buying being done by institutions. This faltering derivatives activity, contrasted with strong institutional spot accumulation, could mean the current rally is in "stronger hands" than previous, more speculative-driven cycles.
Part 4: The Broader Ecosystem - A Story of Diverging Fates
The cross-currents shaping Bitcoin's trajectory are creating ripple effects across the entire crypto ecosystem, with the diverging fortunes of XRP and Solana serving as perfect case studies for the market's 2025 themes.
Beyond the Majors: The Speculative Fringe
As always, the crypto market maintains a speculative fringe. The emergence of assets like "BTC Bull Tokens" represents the high-leverage, high-risk plays that appear during bull markets. These instruments are designed to offer amplified returns on Bitcoin's price movements and attract the most risk-tolerant traders. Their existence underscores the full spectrum of the market—from sovereign wealth funds methodically buying Bitcoin for their treasuries to degens betting on leveraged tokens, the digital asset ecosystem remains a place of immense diversity and opportunity.
Conclusion: Bitcoin's Maturation in a Fractured Market
The year 2025 will be remembered as the year Bitcoin truly came of age as an institutional asset, firmly planting its flag and claiming one-third of the crypto investment landscape. This growing dominance, driven by the steady, strategic accumulation of the world's largest financial players, has provided a powerful anchor in a volatile market.
Yet, this newfound maturity has not tamed the market's wild spirit. It has instead created a great divide. While institutions build their Bitcoin fortress, retail investors are on the hunt for the next narrative-driven explosion, pouring capital into assets like XRP with the hope of front-running a transformative ETF approval.
The market is consequently balanced on a knife's edge. Bullish macroeconomic and geopolitical tailwinds are pushing for a breakout to new all-time highs beyond the pivotal $105,000 level. At the same time, technical and on-chain analyses warn of a potential final washout, a corrective crash to the mid-$90,000s that may be necessary to reset the market for a sustainable ascent.
Bitcoin's path forward will be carved by the resolution of these opposing forces. Can the quiet, persistent demand from institutions absorb the selling pressure from short-term traders and navigate the technical resistance zones? Or will the speculative fervor and corrective patterns that have defined its past cycles pull it down once more before it can climb higher? Whatever the outcome, 2025 has made one thing clear: Bitcoin is no longer just a speculative digital curiosity. It is a global macro asset at the heart of a complex and evolving financial ecosystem, and its journey is far from over.
Bitcoin Weekly Ultra-BearishThe 100K support is still valid but the weekly timeframe chart isn't looking good.
Good afternoon my fellow Cryptocurrency trader, how are you feeling today?
Bitcoin peaked the week 19-May. Then we have bearish action only.
The week after 19-May was red, then two neutral weeks and a continuation this week. It looks pretty bad right now, terrible to be honest.
» The main support range sits between $82,500 and $88,888.
Thank you for reading.
This support zone will only become active is 100K breaks on the weekly timeframe.
Namaste.
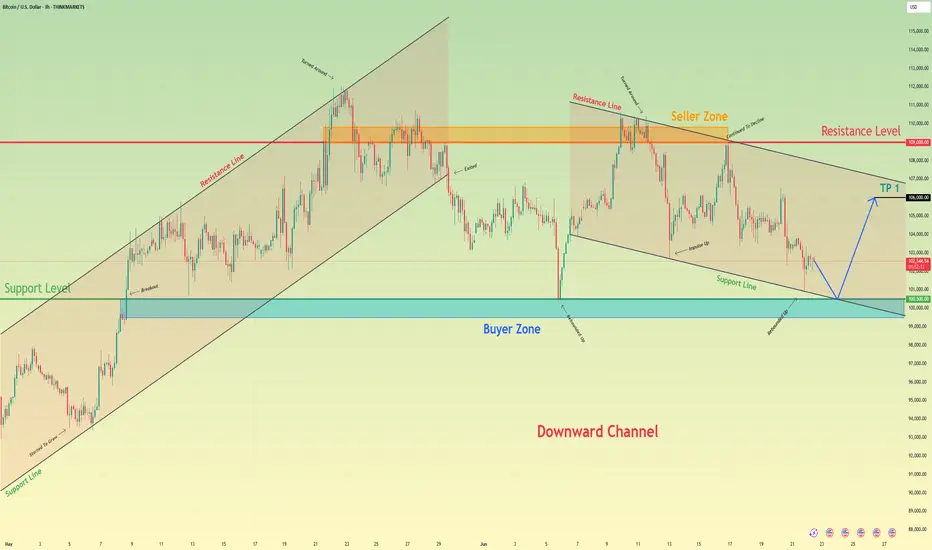
Bitcoin can correct to support line of channel and start to growHello traders, I want share with you my opinion about Bitcoin. The price was moving inside a strong upward channel, where it managed to break through the support level and then the resistance level, eventually reaching the seller zone. After that, BTC started to turn around and declined, once again breaking through the 109000 resistance level, this time from above. That movement also marked an exit from the upward channel. Following that, the price made a correction move down to the support level — the same zone that previously acted as a breakout area. From there, BTC showed strength again with a bullish impulse upward, returning to the Seller Zone. However, that rally was short-lived. The market started to decline again, this time forming a downward channel. Now the price is approaching the support line of this channel, which coincides with the support level around 100500 and the buyer zone between 99500 and 100500. I think BTC can decline a bit further to test this support line, and then rebound from this area, starting a new upward move toward the channel resistance line. That’s why I’ve set my TP at 106000 points, just below the resistance line. Given the structure and past reactions from these zones, I remain bullish and expect further growth after this local pullback. Please share this idea with your friends and click Boost 🚀
Disclaimer: As part of ThinkMarkets’ Influencer Program, I am sponsored to share and publish their charts in my analysis.
How to Tell BITCOIN is BULLISH using MOVING AVERAGES OnlyBTC is trading sideways and it sparks a lot of debate whether or not we are at the beginning of a new bearish cycle, or if there is still a push upwards waiting to happen.
Here's how you can use the Moving Averages to determine whether or not BTC is bullish.
Don't miss this update on my stance on the market and why I think ALT Season is waiting:
______________________
BINANCE:BTCUSDT

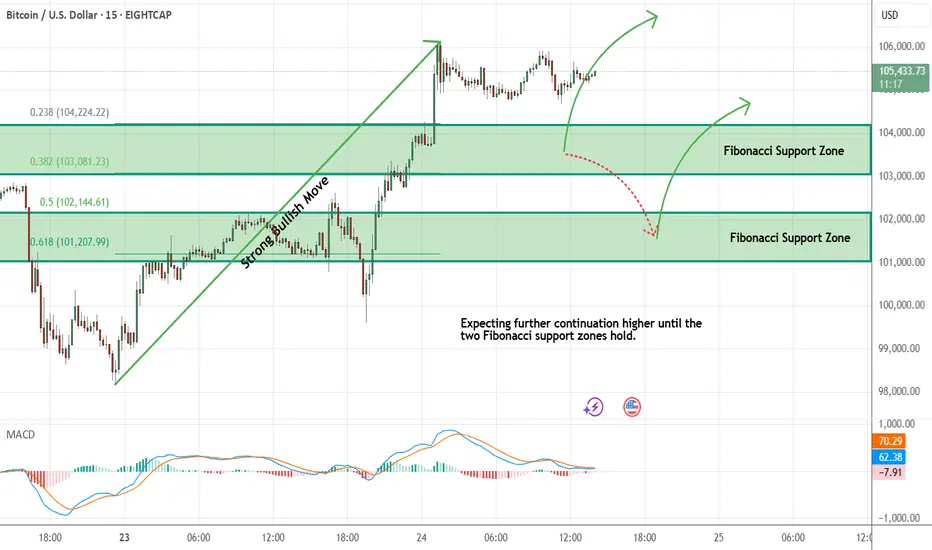
Bitcoin - Looking To Buy Pullbacks In The Short TermM15 - Strong bullish move.
No opposite signs.
Currently it looks like a pullback is happening.
Expecting further continuation higher until the two Fibonacci support zones hold.
If you enjoy this idea, don’t forget to LIKE 👍, FOLLOW ✅, SHARE 🙌, and COMMENT ✍! Drop your thoughts and charts below to keep the discussion going. Your support helps keep this content free and reach more people! 🚀
--------------------------------------------------------------------------------------------------------------------