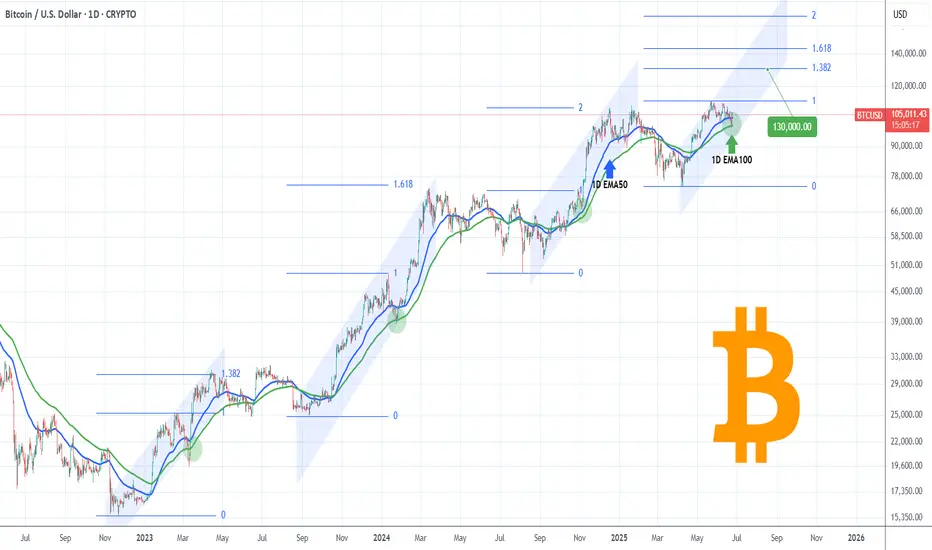
BITCOIN Trump and the 1D EMA100 saved the day!Bitcoin (BTCUSD) rebounded yesterday on its 1D EMA100 (green trend-line) and along with Trump's truce announcement between Israel and Iran, it sent the market into a buying frenzy and back above the $105k mark.
Technically, the 1D EMA100 isn't something to be ignored as since the November 2022 market bottom, each Bullish Leg (Channel Up) that started had a contact (or near) with it that resulted into a considerable bullish extension.
The 1st Channel Up even breached below it, but after rebounding, it reached the 1.382 Fibonacci extension before the next correction. The 2nd Channel Up rebounded exactly on the 1D EMA100, and reached the 1.618 Fibonacci extension. The 3rd Channel Up almost hit the 1D EMA100 and then rebounded to the 2.0 Fibonacci extension.
It is obvious that the pattern follows a progression and each Fib extension peak is higher than on the previous Channel Up. As a result, it is not unlikely to see a High even above the 2.0 Fib ext ($168k) on the current (4th) Channel Up, however on the short-term we would still welcome the 1.382 Fib 'minimum' expectation, targeting $130000.
Do you think we should at least be expecting that? Feel free to let us know in the comments section below!
-------------------------------------------------------------------------------
** Please LIKE 👍, FOLLOW ✅, SHARE 🙌 and COMMENT ✍ if you enjoy this idea! Also share your ideas and charts in the comments section below! This is best way to keep it relevant, support us, keep the content here free and allow the idea to reach as many people as possible. **
-------------------------------------------------------------------------------
💸💸💸💸💸💸
👇 👇 👇 👇 👇 👇
Bitcoin (Cryptocurrency)
Something Like ThisI believe the charts are pointing towards the market gearing up for a play somewhat like this.
The timing may well be off, but the levels and sequence seem broadly predictable.
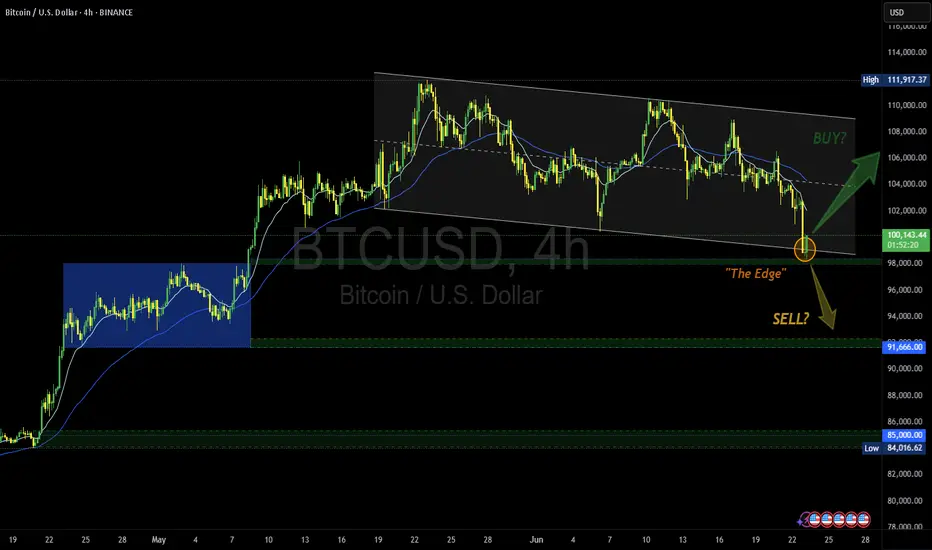
Another Edge - Decision time | Buy? or Sell? share your opinionTitle: BTCUSD: At The Edge – Decision Time Looms
Idea: Bitcoin is currently flirting with "The Edge"—a key decision zone near $98,000 where trend dynamics could shift sharply. After touching the lower boundary of a descending channel, BTC is testing support that could mark either a springboard for a bullish reversal or a trapdoor for further downside.
If bulls reclaim territory above the descending resistance line and push toward $104,000, we may see a trend breakout and renewed upside momentum. Confirmation with volume would strengthen the case for a long position, targeting the $111,917 level.
However, failure to hold "The Edge" could open the door to a swift move lower toward the $91,666 then $85,000 support zone, especially if accompanied by broader risk-off sentiment.
Trade Plan:
• Long above $100K with confirmation and strong volume;
target $111,917.
Stop below $97K.
• Short on breakdown below $97K with bearish momentum;
target $91,666.
Stop above $100K.
Watching: Volume spikes, macro news, and behavior around the channel boundaries.
🚀 Will Bitcoin bounce off the edge—or fall into the abyss?
#MJTrading #BTC #Bitcoin #Buy #long #chart #signal #forex
Bitcoin Order Book - How To Trade ItBitcoin Order Book Analysis | Massive BTC Liquidity Zones You Need to Watch
In this video, we break down the Bitcoin (BTCUSD) order book and highlight the biggest buy and sell levels currently driving market sentiment. These are the exact price zones where whales and institutions are placing large orders—often creating powerful support and resistance that can trigger breakout or reversal setups.
In This Breakdown:
• Where major buy/sell walls are forming in the BTC order book
• How order book depth can predict short-term price direction
• Real-time liquidity pockets traders are watching now
• Key price levels to watch for possible long/short entries
This is a must-watch if you’re actively trading BTC and want to track where the smart money is stacking their positions.
⸻
Tools Featured:
• BTCUSD real-time chart
• Order book heatmap / depth
• Liquidity zone visualizations
• Volume profile overlays
• Sentiment Tool
⸻
Use this insight to position your trades around high-probability reversal or breakout zones. Comment your BTC target below, and follow for daily pro-level crypto insights.
⸻
#Bitcoin #BTCUSD #OrderBookAnalysis #BTCOrderFlow #WhaleActivity #LiquidityZones #CryptoTrading #PriceAction #CryptoTA #BitcoinStrategy

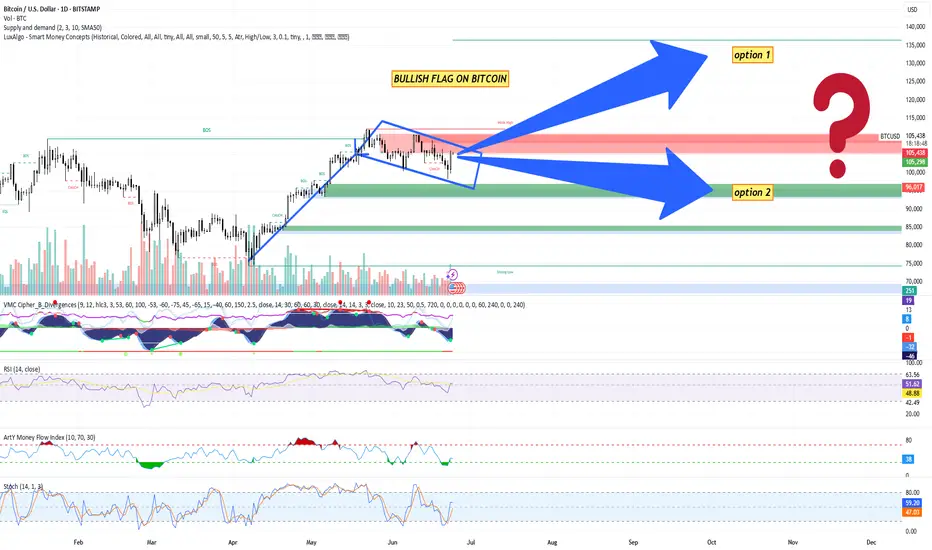
Bitcoin (BTC/USD) Technical Analysis + trade planBitcoin (BTC/USD) Technical Analysis – June 24, 2025
Pattern Identified: Bullish Flag Formation
A clear upward impulse leg followed by a downward-sloping consolidation (flag) indicates a continuation pattern.
The flag is bounded within a descending parallel channel, suggesting a potential breakout to the upside.
Break of Structure (BOS): Multiple BOS signals indicate strong market structure shifts favoring bullish continuation.
Change of Character (CHOCH): Minor CHOCH noted inside the flag, indicating local liquidity grabs but no trend reversal yet.
Key Levels
Current Price: ~$105,126
Flag Resistance: ~$105,291 (watch for breakout)
Major Supply Zone (Resistance): ~$115,000 (red zone)
Demand Zones (Supports):
$96,000 (minor)
$85,000 (medium strength)
$75,000 - $70,000 (strong low / high-confluence area)
Volume Analysis
Declining volume during flag formation supports the bullish flag hypothesis (low-volume pullback).
Anticipate increased volume on breakout for confirmation.
Indicators Summary
1. VMC Cipher B
Green dots signal potential local bottoms.
Wave trends support bullish reversal setup, though momentum still neutral.
2. RSI (14)
Current RSI: ~50.76
Neutral zone; not overbought/oversold – provides room for upside movement.
3. Money Flow Index (Art’y)
Positive inflow recovering, signaling accumulation phase.
4. Stochastic RSI
Blue line crossing above orange around 46. Indicates bullish crossover from the oversold region – early entry signal.
Bitcoin Trading Plan
Trading Bias: Bullish (Contingent on Flag Breakout)
Entry Plan
Breakout Entry: Enter long above $105,300 with confirmation (4H or daily candle close).
Aggressive Entry: Pre-breakout entry inside the flag at ~$104,000–$105,000, anticipating breakout.
Stop Loss
Conservative: Below $96,000 (below key support + 50 SMA).
Aggressive: Below $102,500 (inside flag, tighter stop).
Take Profit Levels
TP1: $110,000 (local high)
TP2: $115,000 (strong resistance zone)
TP3: $123,000–$125,000 (measured move from flag breakout target)
Measured Move Target: Height of the pole ($25K) added to the breakout zone ($105K) = Target zone: $130,000 (theoretical).
Alternative Scenario – Bearish Breakdown
If BTC breaks below $96,000, the bullish structure is invalidated.
In that case:
Look for short entries below $95,500.
Target zone: $85,000 – $75,000.
SL above $98,000.
Risk Management Guidelines
Risk per trade: 1–2% of capital
Use position sizing tools to determine trade size.
Monitor macroeconomic news (Fed, inflation, ETF flows) and crypto market sentiment.
To sum up things:
BTC is consolidating within a textbook bullish flag.
Momentum indicators align with a potential breakout.
Caution warranted until clear breakout occurs – volume confirmation is key.
Keep alert for fakeouts due to low summer volatility.
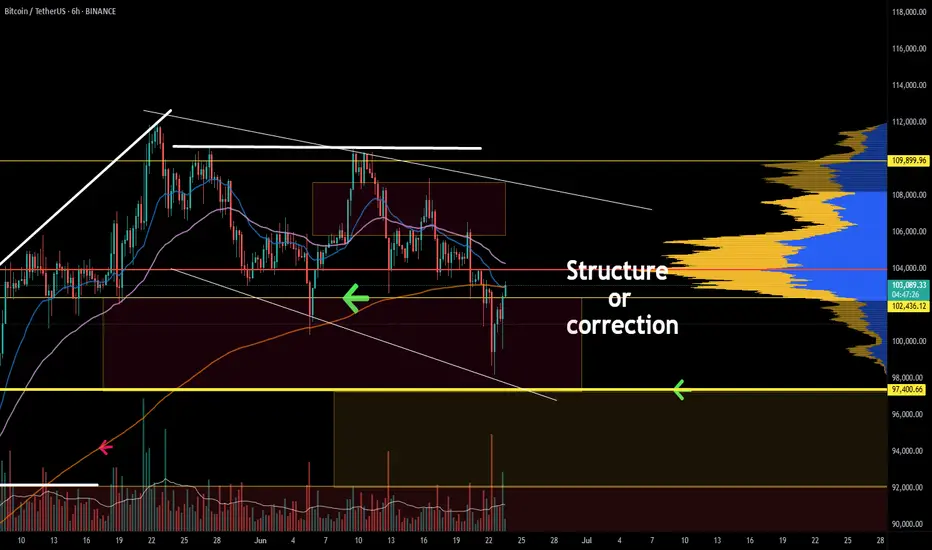
Is Bitcoin Signaling Risk-Off? Structure Breakdown Explained💥 BTC/USD Outlook – Is Bitcoin Losing Steam? 🧠📉
I'm keeping a close watch on Bitcoin (BTC/USD) this week, and the current price action is flashing some key signals.
🔍 Over the past several sessions, BTC has struggled to hold momentum, and we’re now seeing a shift in tone. On the 4-hour timeframe, the market structure is tilting bearish, with a pattern of lower highs and lower lows developing — a classic sign of weakness ⚠️📉.
📐 The most recent downside leg has caused a clear break in structure, and BTC is now retracing back into a potential supply zone, hovering around equilibrium of the recent move. This zone will be critical to watch for signs of seller re-entry.
⏳ On the 30-minute chart, I’m waiting for a decisive shift in structure — a break of local support or a failed rally that confirms bearish continuation. Should that play out, it could signal a high-probability short setup.
🪙 A breakdown in BTC often has broader implications — especially in the risk asset space. If we see weakness here, JPY pairs may strengthen as capital rotates into safer assets 💴🌐.
⚠️ Disclaimer:
This is not financial advice. The information provided is for educational purposes only. Please conduct your own analysis and consult a licensed professional before making any investment decisions. 📚💼

Bitcoin Crash Will Continue to Levels that will REKT majority!??MARKETSCOM:BITCOIN crashed towards $98k so far! Almost 10% drop so far! Crypto noobs and mass media manipulators will blame this CRYPTOCAP:BTC crash on the Iran and Israel conflict! Professional traders will, however, tell you that this was orchestrated and the crash was already planned beforehand, and the best traders caught the crash from the top at $109k and made a profit on this Bitcoin correction! Professional insider trading against news manipulation, artificial conflicts, and emotional trading !

BTC is the champion our portfolio needs. BTC has some work to do. Either it will correct for a nice confrimatio low or strucure out for a bull fag. Either way, the price remains within a downward-sloping channel. That keeps me neutral bullish. But until I see a pivot point structure with signs of divergence in oversold conditions, it's difficult to get a proper RR.
Full TA: Link in the BIO
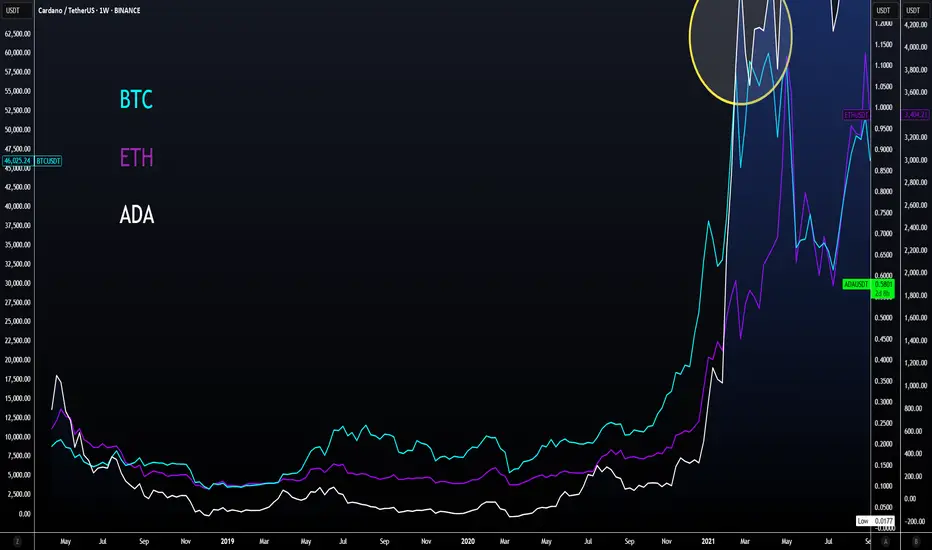
ADA | BTC | ET | Why ALTSEASON is COMING SOONAfter a -34% retracement, ADA is ready to go higher alongside with the rest of the alt market.
We see a very interesting phenomena here, were ADA also represents a large part of the larger alts: BTC pulls back, ETH is starting to increase or trades sideways (before the increase) whilst the alts dip.
This is actually BULLISH for alts, showing the very clear rotation between BTC, ETH and top 15 alts.
If we look at the macro of ANY of the alts I've been working through recently, a similar pattern appears - a clear bottom, followed by a sideways trade. This is usually the point just before the big ALTS season.
We actually see this pattern at the end of the 2018 rally, as well as after the 202- Covid dip:
The bottom line -
ADA and other alts are gearing up for their ALTSEASON. With patience, we will soon see some great gains across the markets.
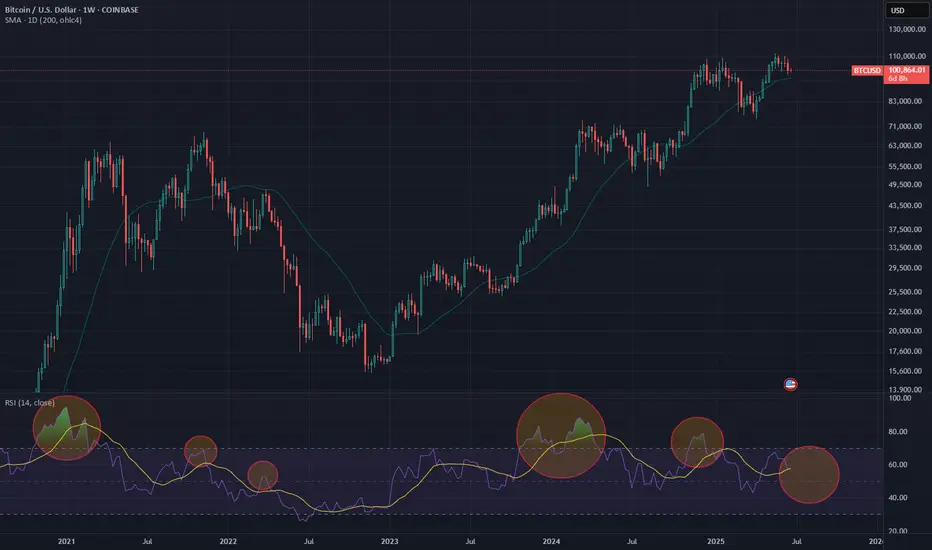
Bitcoin Crash To $93k Incoming?!!!!I am discussing the bearish signs i am seeing right now on Bitcoin, and talking about the confirmations I want to see, that will confirm that Bitcoin is about to crash down to 93k!!!

Bitcoin: The price. I don't like it. I remember so clearly in November 2021 when Bitcoin showed bearish divergence on the weekly charts.
We might all be suffering from PTSD and fear the same outcome, especially with the potential for a double top.
If BTC is able to stay above the 1D 200MA, as well as the RSI remaining above 50, there may be hope... If not, i.e. a weekly close below and retest of the 1D 200MA; RSI <50, there might be a real cause for concern.
This, supported by a declining RSI would most certainly be a bearish signal and a shift in market trend.
Nobody knows the future and I think we're all running on hopium due to all the positive news about BTC this year.
Until BTC makes a new ATH, we may want to manage our expectations.
What are your thoughts?
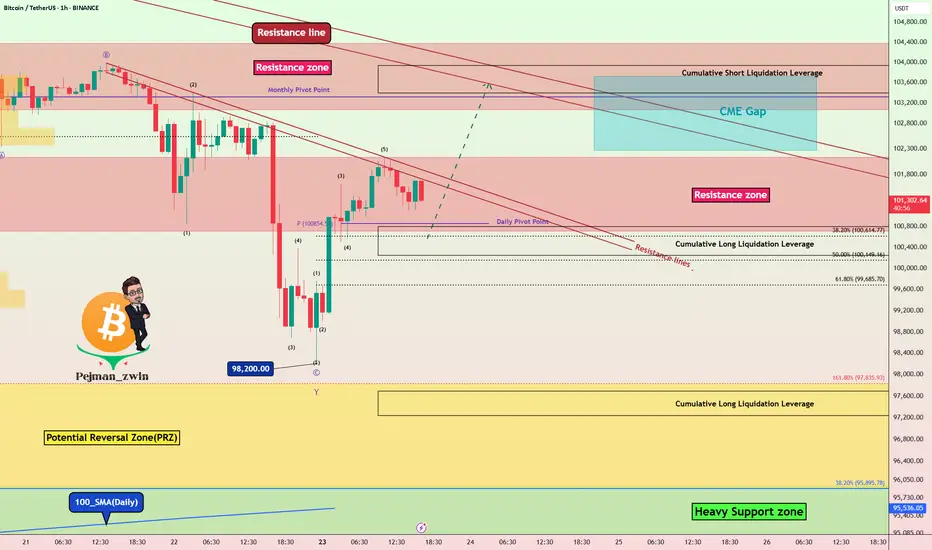
Bitcoin Breakout Incoming? Flash PMI & CME Gap in FocusBitcoin ( BINANCE:BTCUSDT ) started to fall ( about -4%) after the news that the US was involved in the Middle East tension , but it has risen again with good momentum .
Do you think Bitcoin will go below the previous bottom($98,200) again on the 1-hour time frame?
Bitcoin is trading in the Resistance zonezone($102,130-$100,700) and near the Resistance lines .
In terms of Elliott Wave theory , it appears that a Double Three Correction(WXY) has been completed near the Potential Reversal Zone(PRZ) . Also, the first 5 microwaves of the Impulsive have now been completed .
---------------------------------
Bitcoin traders should monitor today’s Flash Manufacturing (expected 51.1) and Services PMI (expected 52.9) . Both forecasts are already lower than last month’s figures (51.3 and 54.8) , but I see a chance they come in even weaker.
Why weaker PMI is likely?
Slowing retail sales and softer labor data point to reduced consumer demand.
High interest rates are starting to pressure both the production and services sectors.
Regional Fed surveys already showed a cooling in business activity.
If the PMI prints below expectations, the market may anticipate a more dovish Fed, pushing the dollar( TVC:DXY ) down and giving Bitcoin a potential bullish boost.
---------------------------------
I expect Bitcoin to move towards filling the CME Gap($103,730-$102,275) after breaking the Resistance lines , and if the Resistance zone($104,380-$103,060) is broken, we should expect further increases.
Cumulative Short Liquidation Leverage: $103,391-$103,934
Cumulative Long Liquidation Leverage: $100,800-$100,250
Cumulative Long Liquidation Leverage: $97,691-$97,241
Note: Increased tensions in the Middle East or new and important news surrounding this news can make the analysis invalid, so be more careful with capital management.
Note: If Bitcoin can touch $98,170 , we can expect more dumps.
Please respect each other's ideas and express them politely if you agree or disagree.
Bitcoin Analyze (BTCUSDT), 1-hour time frame.
Be sure to follow the updated ideas.
Do not forget to put a Stop loss for your positions (For every position you want to open).
Please follow your strategy and updates; this is just my Idea, and I will gladly see your ideas in this post.
Please do not forget the ✅' like '✅ button 🙏😊 & Share it with your friends; thanks, and Trade safe.
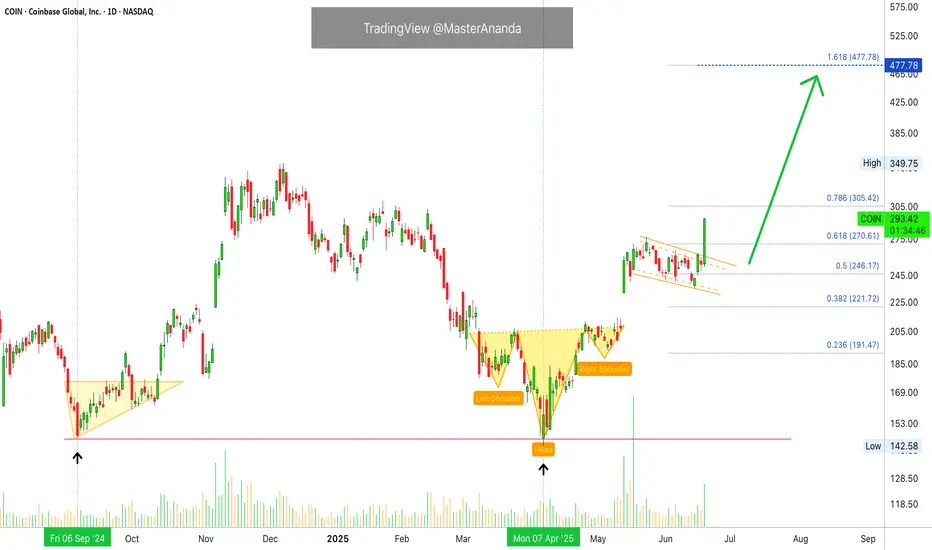
Coinbase Global Inc. Bullish Confirmed Confirms Bullish BitcoinCOIN's chart looks very similar to Ethereum. Today's action reveals something great; bullish confirmed.
Always, since this stock started trading, it has been moving as a unit together with Bitcoin and the entire Cryptocurrency market.
When Bitcoin is bullish, Coinbase is bullish.
When Bitcoin is bearish, Coinbase is bearish and vice versa.
Here we have a very strong, high volume bullish breakout on COIN. This means that Bitcoin, Cardano, Ethereum, XRP, Dogecoin, Avalanche and the rest of the Cryptocurrency market is about to break bullish really strong.
There was a low point 7-April 2025. The same with the projects I just mentioned above.
Here this 7-April low marks a double-bottom compared to September 2024. After this low, the recovery starts and we have a strong rise.
In late May, there is a price peak and we enter a consolidation phase, in this case a small retrace. The chart is identical to ETHUSDT.
After a strong higher low, some minor bearish action with no bearish pressure, Coinbase is going up. You can expect the exact same dynamic happening to Bitcoin and all the Altcoins. Bullish confirmed. The market will resolve green.
Today Coinbase hits the highest price since February 2025.
Namaste.
Bitcoin Tests Key Support-Healthy Correction Within Bull MarketHealthy Pullback, Strong Structure:
Bitcoin’s recent dip is a constructive correction within a broader bull trend, as it tests the critical $100,000–$105,000 support zone—a former resistance area from early 2025.
Institutional Demand Holds the Line:
Maintaining levels above the psychologically important $100,000 mark highlights continued institutional accumulation and reinforces the underlying strength of the trend.
Momentum Reset, Base Building:
This pullback has helped reset overbought conditions from the prior rally, laying the foundation for the next potential leg higher.
Key Levels to Watch:
Support: $100,000–$105,000
Breakout Trigger: A close above $108,000 would confirm uptrend continuation
Outlook: Bullish bias remains valid as long as support holds
Investor Opportunity:
With structure intact and downside contained, this consolidation presents a favorable risk-reward setup for long-term investors looking to position ahead of a potential breakout.
#Bitcoin #BTC #CryptoMarket #TechnicalAnalysis #SupportAndResistance #BullMarket #RiskReward #InstitutionalBuying #MarketOutlook #PriceAction
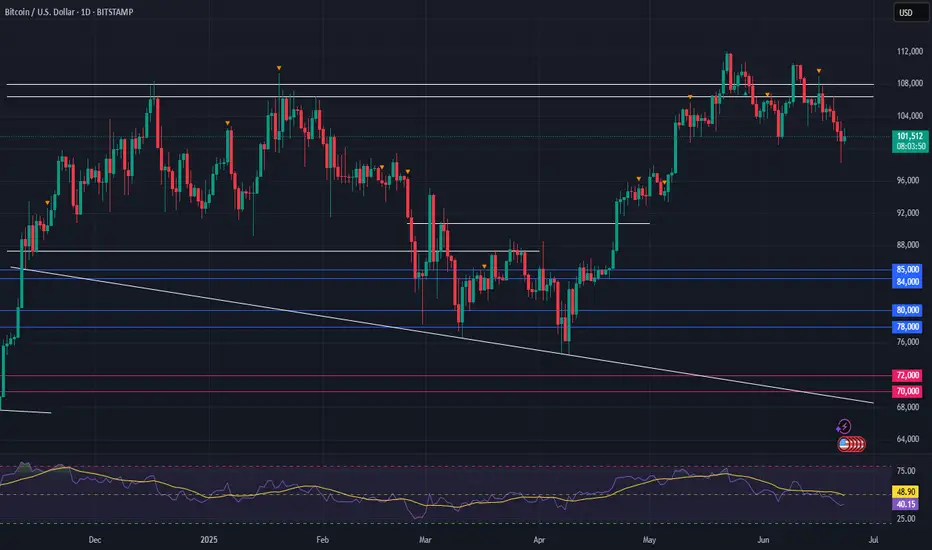
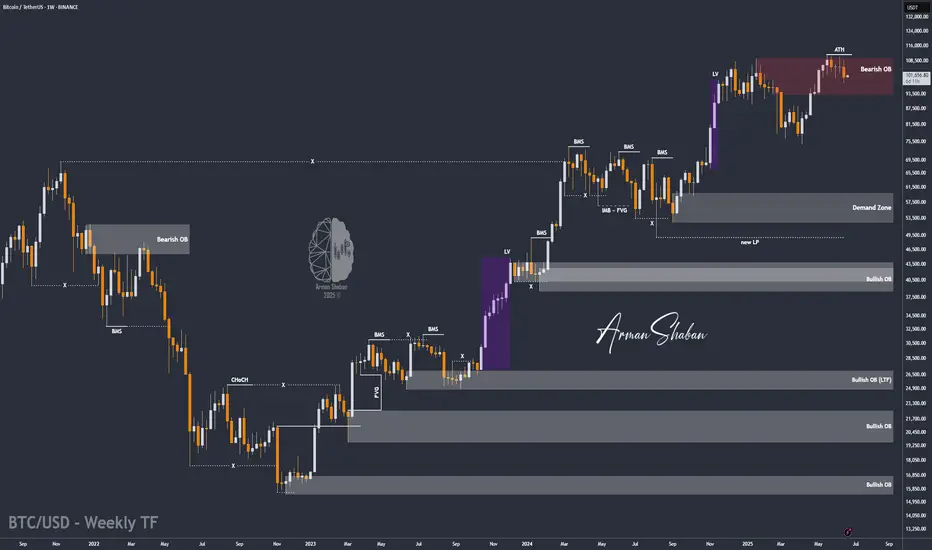
Bitcoin at Risk: Will Geopolitical Tensions Push BTC Below $90K?By analyzing the #Bitcoin chart on the weekly timeframe, we can see that the price continued its correction amid rising tensions and conflict between Iran and Israel, dropping to as low as $98,000. Currently, Bitcoin is trading around $101,000, and if these tensions escalate further — especially if Iran decides to close the Strait of Hormuz — it could significantly impact global markets, and Bitcoin would not be an exception.
If BTC fails to hold above $100,000 by the end of the week, a continuation of the drop toward $90,000 is possible.
Please support me with your likes and comments to motivate me to share more analysis with you and share your opinion about the possible trend of this chart with me !
Best Regards , Arman Shaban
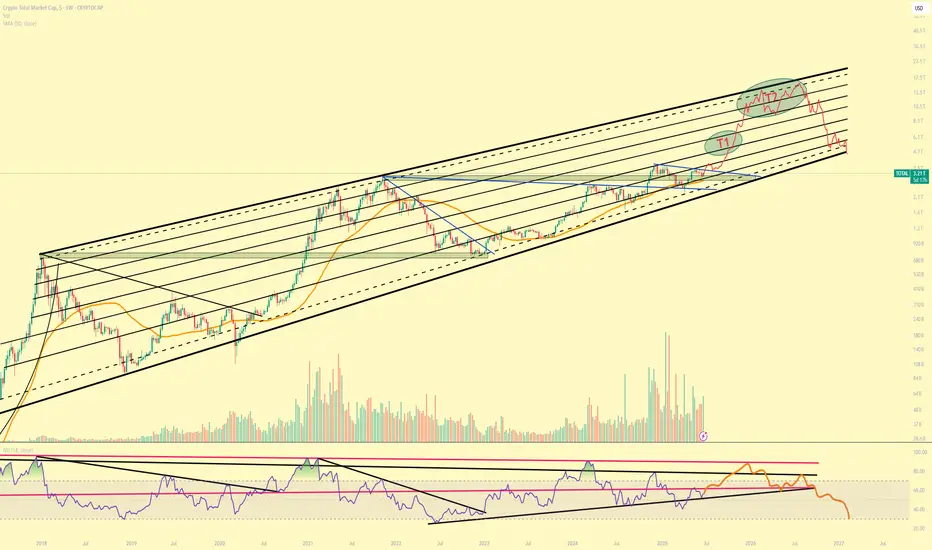
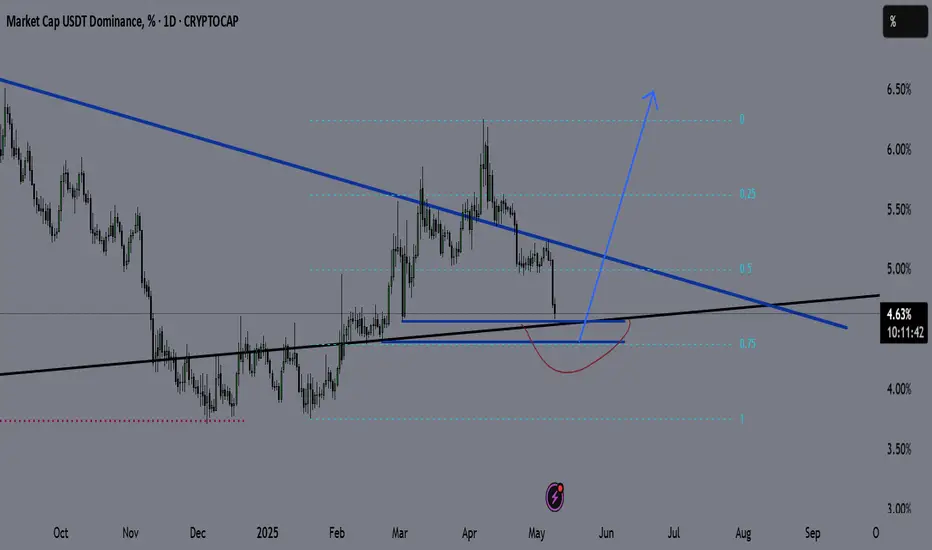
USDT.D LONG - MID TERM PLANUSDT.D is one of the best tools to understand what's happening in the crypto market.
It shows the dominance of USDT across the entire space — and has a strong inverse correlation with BTC and crypto assets.
Technicals:
USDT.D is approaching its long-term support trendline.
I expect a deviation below that line — possibly toward the 0.75 Fibonacci level — before a strong move up.
That move could last 1–3 months, which means more downside for alts during this time.
Plan:
Shorting altcoins — especially ETH-related tokens and memecoins.
Looking to buy back around early August.
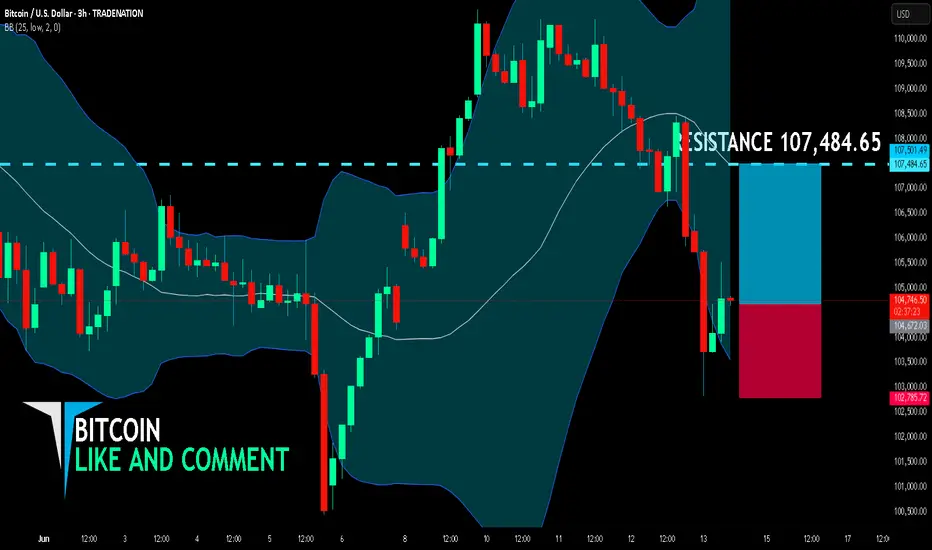
BITCOIN SENDS CLEAR BULLISH SIGNALS|LONG
BITCOIN SIGNAL
Trade Direction: long
Entry Level: 104,672.03
Target Level: 107,484.65
Stop Loss: 102,785.72
RISK PROFILE
Risk level: medium
Suggested risk: 1%
Timeframe: 3h
Disclosure: I am part of Trade Nation's Influencer program and receive a monthly fee for using their TradingView charts in my analysis.
✅LIKE AND COMMENT MY IDEAS✅
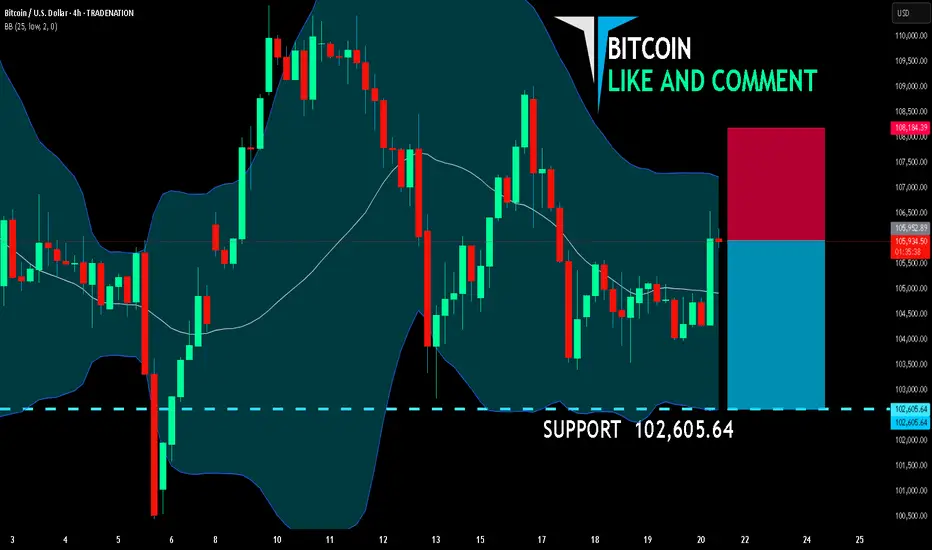
BITCOIN BEARS WILL DOMINATE THE MARKET|SHORT
BITCOIN SIGNAL
Trade Direction: short
Entry Level: 105,952.89
Target Level: 102,605.64
Stop Loss: 108,184.39
RISK PROFILE
Risk level: medium
Suggested risk: 1%
Timeframe: 4h
Disclosure: I am part of Trade Nation's Influencer program and receive a monthly fee for using their TradingView charts in my analysis.
✅LIKE AND COMMENT MY IDEAS✅
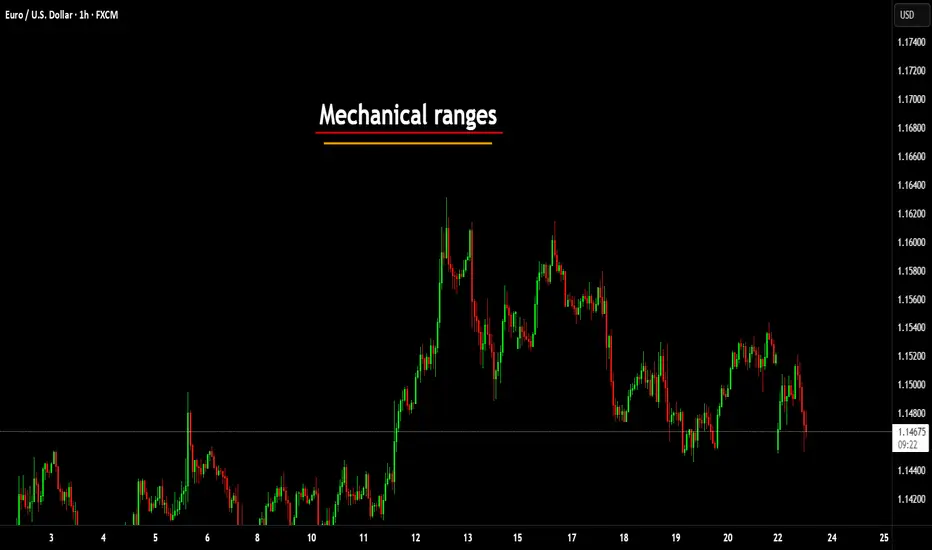
Mechanical rangesMany traders will talk about things like "Smart Money Concepts" (SMC) and think they have found something new.
The truth is, everything in trading stems back to Liquidity.
There is no "Algo" nobody is out to get you specifically. The market is always right, where you position yourself is your own choice.
I have written several posts on mechanical trading, recorded a number of streams. The more mechanical you can make the process, the less the emotions have a chance to kick your ass.
Let me give you a very simple method of being able to identify the ranges. Ignore the timeframes as this will work on any of them, on most instruments. (I say most, as some behave differently due to how it attracts liquidity). Lets assume high end crypto such as Bitcoin (BTC) and of course Forex in the general sense, stocks, commodities etc.
This is simple - only 2 rules.
You start by zooming out and giving yourself a general feel for the trend.
Let's say this looks to be an uptrend - we now need to understand the rules.
An opposing candle can simply be defined by a different colour. If the trend is up (Green) and we see a red candle - then it's an opposing candle.
The inverse is true, if we are down and the trend is Red. Then a Green candle would be opposing.
This is only half of the story. The second rule is a pullback candle or even a sequence of candles. This simply means either the very same opposing candle that doesn't make a new high or low (depending on the trend up not making fresh highs or down not taking new lows).
In this image, you can see we have in one candle both an opposing and pullback in one candle. This means we can now mark the high of the range. Working backwards to identify the swing range low.
This easy method means I can draw a range exactly the same and mechanically every single time.
Giving me a mechanical range.
We could then get a lot more technical by looking for liquidity, 50% of the range or places such as supply or demand areas.
But these are all for other posts.
For now, getting a range on the higher timeframes means you can work down and down into a timeframe you are likely to want to trade on.
These ranges will give clues to draws and runs of liquidity.
This will also help identify changes in the character and fresh breaks of structure.
Here's another post I posted on the mechanical structures and techniques.
More in the next post.
Have a great week!
Disclaimer
This idea does not constitute as financial advice. It is for educational purposes only, our principal trader has over 25 years' experience in stocks, ETF's, and Forex. Hence each trade setup might have different hold times, entry or exit conditions, and will vary from the post/idea shared here. You can use the information from this post to make your own trading plan for the instrument discussed. Trading carries a risk; a high percentage of retail traders lose money. Please keep this in mind when entering any trade. Stay safe.
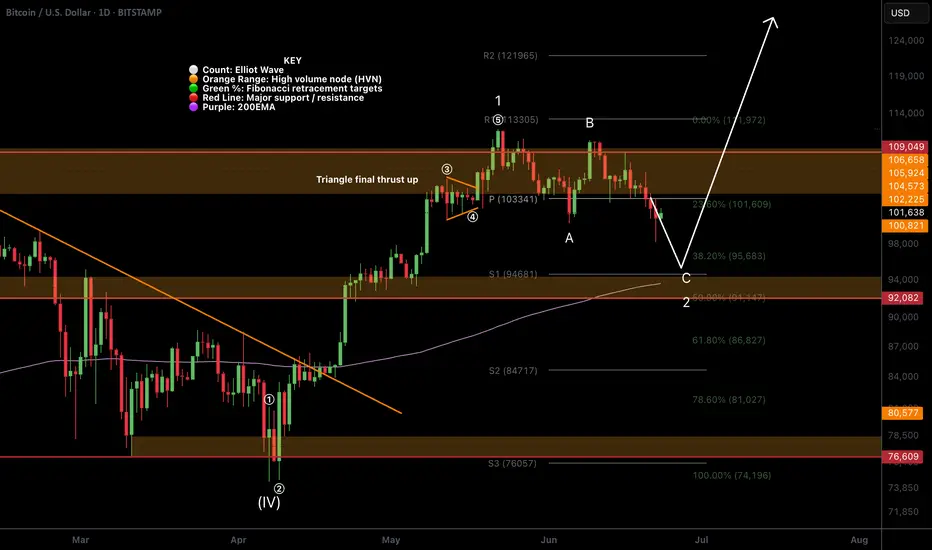
BTC Textbook Elliot Waves!CRYPTOCAP:BTC local analysis hasn't changed in a few weeks.
Price printed another text book Elliot motif wave, with the wave 4 triangle terminal pattern ending in the usual thrust up with a poke above all time high.
Price is also printing a textbook ABC for wave 2 with 5 waves down for A, 3 waves up for B and a strong wave C down to finish. Wave C's are always the strongest.
Pattern suggests price has one more push lower to complete this corrective wave tapping the quadruple support: S1 daily pivot, ascending daily 200EMA, major support High Volume Node (HVN) and 0.5 Fibonacci retracement at 92-94k range.
Most investors are publicly calling for buys in this area so price may be front run by the whales! The consensus often do not get what they want.
Safe trading
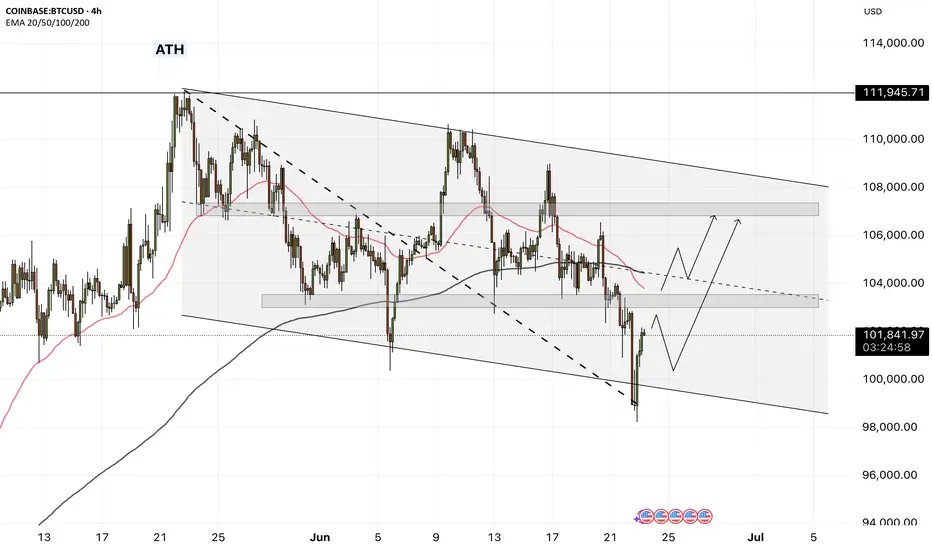
BITCOIN Is this just a giant Bull Flag??Bitcoin (BTCUSD) saw a strong sell-off yesterday in the aftermath of the U.S. strike in Iran and fears of retaliation, but in later hours recovered some of the lost ground. The recovery is being extended into the Asian and early E.U. hours today and the emerging Channel Down pattern already draws strong similarities with the one in December 17 2024 - January 13 2025.
Both broke below their respective 1D MA50 (blue trend-lines) to form a Lower Low, which in the case of Jan 2025, it initiated a rebound that tested the All Time High (ATH) Resistance. See also how similar their 1D RSI patterns are, testing the same Support level too (41.20).
Given that this time the uptrend has been much shorter since the April 07 2025 Low, this Channel Down may be nothing but a giant Bull Flag in the middle of a standard Bull Cycle Leg. Until confirmed with a 1W candle closing above the ATH Resistance though, the medium-term Target is $111900.
Notice also the formation today of a 1D MA100/200 Bullish Cross, the first since November 13 2024.
So what do you think? Is $111900 your short-term Target? Feel free to let us know in the comments section below!
-------------------------------------------------------------------------------
** Please LIKE 👍, FOLLOW ✅, SHARE 🙌 and COMMENT ✍ if you enjoy this idea! Also share your ideas and charts in the comments section below! This is best way to keep it relevant, support us, keep the content here free and allow the idea to reach as many people as possible. **
-------------------------------------------------------------------------------
💸💸💸💸💸💸
👇 👇 👇 👇 👇 👇

Bitcoin - Will Bitcoin Lose $100K Support?!On the four-hour timeframe, Bitcoin is below the EMA50 and EMA200 and is in its short-term descending channel. One can look for buying opportunities for Bitcoin from the channel bottom. If the resistance level is broken, the path to the rise and its reach to the level of $107,000 will be prepared for Bitcoin.
It should be noted that there is a possibility of heavy fluctuations and shadows due to the movement of whales in the market, and capital management will be more important in the cryptocurrency market. If the downward trend continues, we can buy within the demand range.
Bitcoin has been in the spotlight again in recent days, especially as its price fluctuates within the psychologically important range of $101,000-$102,000 and its fundamental indicators are sending mixed signals.
The first and perhaps most important element in Bitcoin’s fundamental analysis is the accumulation trend by large financial institutions and corporations. According to data published by websites such as CoinShares and the Financial Times, more than $87 billion worth of Bitcoin is currently held by companies such as MicroStrategy, Tesla, Block, and ETFs, which is approximately 3.2% of the total BTC supply in circulation. This clearly shows that Bitcoin has established itself as a store of value in the portfolios of professional investors, although there is still no consensus on its function as a “digital gold”.
In this regard, analysts such as Román González of A&G have predicted that Bitcoin could reach the $200,000 range by the end of the year; on the other hand, some more conservative analysts such as Jacqui Clarke believe that Bitcoin still lacks measurable intrinsic value and should not be viewed solely as an alternative asset. This conflict of views shows the depth of complexity in analyzing Bitcoin.
From the perspective of onchain, or intra-network data, the picture looks a little more cautious. The volume of active addresses last week was in the 1.0-1.1 million range, which is lower than in previous bullish periods (such as late 2021). Also, the MVRV (Market Value to Realized Value) index, which measures the potential profit potential of investors, fell slightly from 2.29 to 2.20, indicating that the market is somewhat cooling off from the short-term heat. Also, on June 22, more than 5,200 Bitcoins were removed from exchanges, which is usually a sign of long-term accumulation and a decrease in short-term selling pressure. On the other hand, Bitcoin’s behavior in the face of geopolitical crises shows signs of a change in the dominant market narrative. During the recent tension between Iran and Israel, Bitcoin fell by nearly 4%, unlike gold, which experienced significant growth. This challenges the assumption that Bitcoin is a “hedging” or “safe haven” asset and shows that BTC is still registered more as a risk-on asset in the minds of market participants. This is considered very important as investors look for tools to hedge inflation or protect against economic shocks. In terms of correlation with traditional markets, Bitcoin is also on a path to further integration with classic assets. The 30-day correlation index between Bitcoin and the S&P500 is now around 0.78, and academic studies predict that the correlation will grow to 0.87 at some point in 2024. This means that Bitcoin’s movements are more aligned than ever with the Federal Reserve’s monetary policy, interest rates, stock market conditions, and global liquidity flows. Therefore, in the current situation, the impact of US macro data or central bank decisions plays a decisive role in Bitcoin’s volatility.
Finally, Bitcoin price prediction models in recent days also reflect this complexity. Websites such as Bitfinex, Changelly, and analysts from institutions such as Brave New Coin have estimated that Bitcoin could reach the $125,000-$135,000 range this summer if macroeconomic conditions remain stable, and even if institutional capital continues to flow and there are no macro crises, reaching $150,000 by the end of the year is not out of the question. However, such scenarios require maintaining the current level of liquidity in the market, the absence of drastic tightening measures by the Federal Reserve, and the control of geopolitical risks.
In short, Bitcoin is in a situation where, on the one hand, its supporting fundamentals are stronger than ever; With institutional inflows, accumulation of long-term addresses, and reduction of inventory on exchanges. On the other hand, the market remains highly vulnerable to macroeconomic and political risks and continues to show volatile reactions.
This situation has led to Bitcoin becoming not only a speculative tool or growth investment, but also gradually becoming a part of professional portfolios with a carefully composed risk management mix. Its medium-term outlook is positive, but with one important condition: stability in global inflation and continued institutional capital flows.
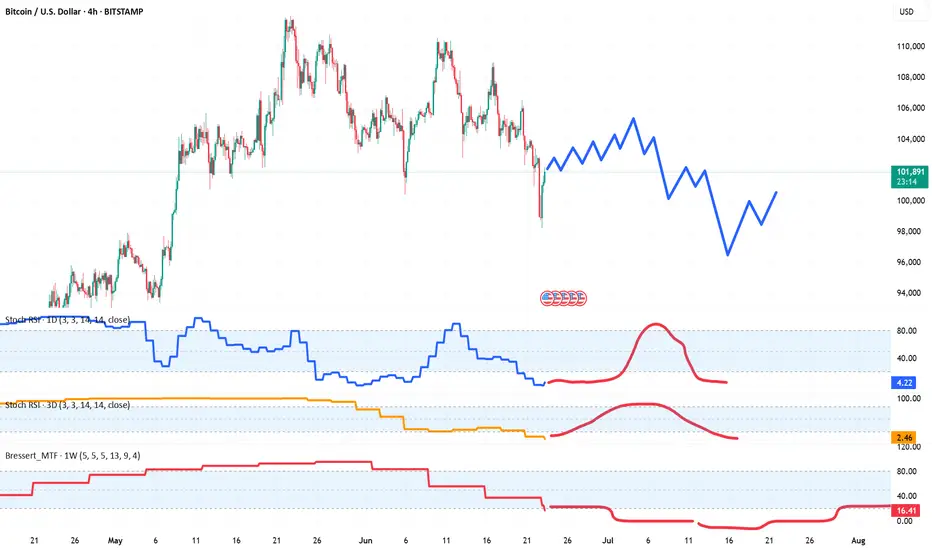
Bitcoin's Failed 60-Day Cycle: Relief Rally Before More DownsideBitcoin has officially failed its current 60-day cycle by breaking below the previous cycle low on June 5th, touching $100,000. This marks a key structural shift that traders should not ignore.
📉 What’s Next? Likely Scenario:
The highest probability setup now is a relief rally toward the Stoch RSI highs on the 1-Day and 3-Day timeframes, followed by a move downward into the 60-day cycle low, projected to form between late July and early August. This aligns with a potential retest of the Value Area Low from April, a key support zone to watch.
📈 Upside Target:
If we do see bullish continuation in the short term, the main upside target is $105,000. This level is significant as it clusters three Weekly Point of Control (POC) levels from May and June, making it a high-liquidity magnet for price. Historically, Bitcoin tends to gravitate toward these levels when several align closely.
💼 Current Positioning:
I’m currently long BTC and ETH, and I’m watching closely for Stoch RSI to top out on the 1-Day and 3-Day timeframes. I’ll look to reduce or exit those positions as we approach those cycle peaks.
🔔 Pro Tip: Price often seeks out stacked POC levels. If you’re a volume profile trader, keep $105K on your radar.
📌 P.S. For access to my custom indicators and deeper cycle analysis, check the description in my profile.