TradeCityPro | Bitcoin Daily Analysis #112👋 Welcome to TradeCity Pro
Let’s dive into the analysis of Bitcoin and key crypto indexes. As usual, in this analysis I’ll review the futures triggers for the New York session.
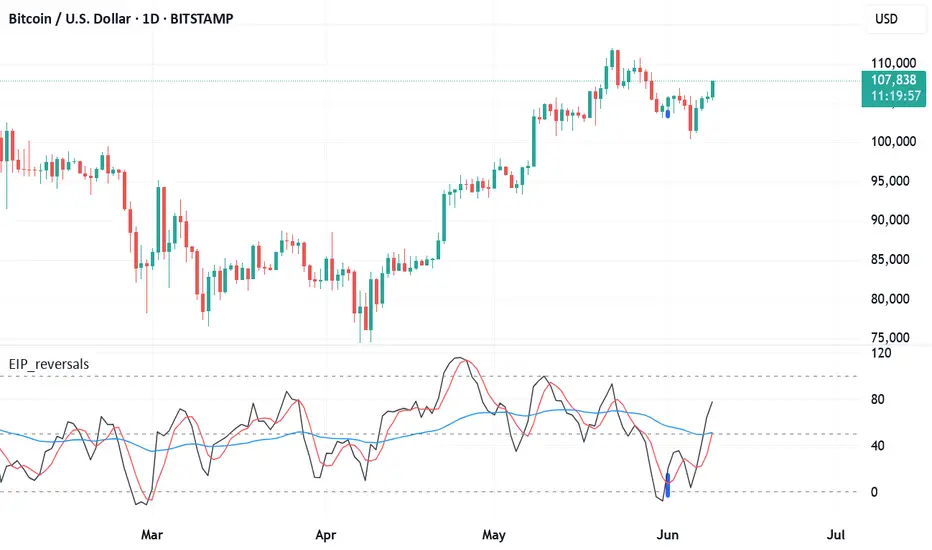
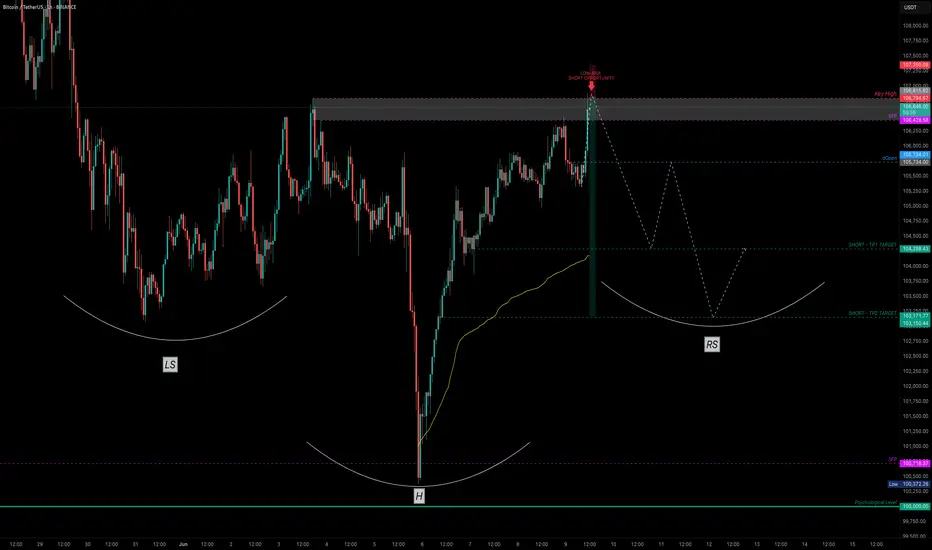
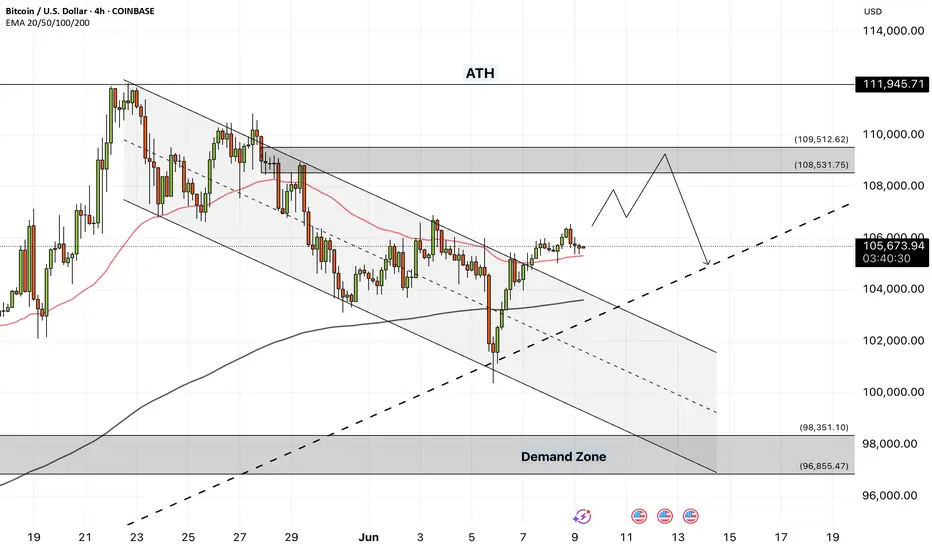
⏳ 1-Hour Timeframe
Yesterday, Bitcoin finally broke through the resistance zone it had formed. As you can see, it pushed through this level with strong buying volume and is now moving toward 108777.
🔍 If you entered a position using yesterday’s triggers, I’d be glad to hear about it in the comments. Your feedback gives me great energy.
⭐ Today, I cannot provide a specific trigger because the market has already made its move. If you do not have an open position, it is better to wait for a new market structure and then identify a fresh trigger.
💥 At the moment, I expect Bitcoin’s upward movement to continue toward 108777. Market volume is strongly supporting the trend and is aligned with price action. RSI is also in the overbought zone, indicating strong buyer presence. If RSI stays above 70, the sharp upward movement is likely to continue.
📊 If a market correction occurs, the price could pull back to the zone I marked. In future analyses, I will review triggers for both trend continuation and possible reversals.
👑 BTC.D Analysis
Bitcoin dominance formed a higher low above 6449 and has now broken the 6467 resistance, signaling the beginning of a new bullish leg.
⚡️ If this upward move continues, Bitcoin dominance may climb further. However, if a pullback to 6467 happens, altcoins could see a strong upward move as well.
📅 Total2 Analysis
Looking at Total2, this index was supported at 114 yesterday and is now moving toward 117.
📈 If Bitcoin dominance starts to drop, Total2 will likely break above 117 and begin a main bullish trend.
📅 USDT.D Analysis
Now for Tether dominance. After forming a lower high below 479, it broke below the 472 support and is now heading toward 464.
✅ In my view, this movement toward 464 is likely to continue, and as that happens, the overall crypto market is expected to keep moving upward.
❌ Disclaimer ❌
Trading futures is highly risky and dangerous. If you're not an expert, these triggers may not be suitable for you. You should first learn risk and capital management. You can also use the educational content from this channel.
Finally, these triggers reflect my personal opinions on price action, and the market may move completely against this analysis. So, do your own research before opening any position.
Bitcoin (Cryptocurrency)
BTC Testing Major Resistance >>> Rejection Likely?Hi guys!
Did you see my last analysis about Btc? Let's break it down more!
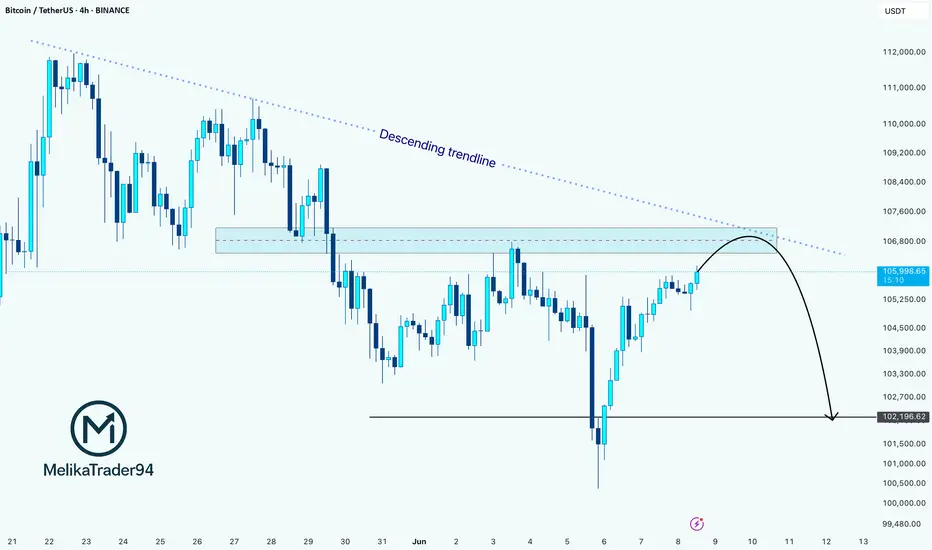
Bitcoin is now testing a major resistance zone around $106.8K, where a descending trendline has already pushed the price down several times.
This area could act as a reversal point again. If BTC fails to break above, we might see a move down toward $102.2K — a strong support level from earlier this month.
Right now, the market is showing signs of weakness near resistance, so this could be a good spot to watch for a short setup — unless bulls step in with strong volume and break out cleanly.
attention to these levels:
Resistance: $106.8K (trendline + supply zone)
Support target: $102.2K
Outlook: Bearish unless breakout confirmed
Bitcoin B-Wave Trap? Major C-Wave Down Correction Incoming!Bitcoin’s recent bounce has all the signs of a classic B-wave in an ABC corrective structure. After the impulsive A-wave down from the highs, this current rally appears more like a corrective relief move rather than the start of a new bullish impulse. Volume remains weak and the structure looks choppy — not the kind of strength you’d expect from a sustainable uptrend.
I believe we are now completing the B-wave, luring in late bulls before the real drop — the C-wave — begins. This next leg down could be sharp and painful, targeting key support zones and possibly wiping out the complacency that’s built up in the market.
🧠 Watch for signs of exhaustion in this rally.
📉 Potential C-wave targets: 98k 97k
⏳ Timing and structure suggest we’re close to the turning point.
Stay cautious. This could be the calm before the real storm.
---
HolderStat┆BTCUSD springs from 100k railAfter a week-long pullback, CRYPTOCAP:BTC ricochets off 100 k support, keeping the rising-channel narrative alive. Bitcoin price now squeezes beneath a descending trendline; a daily close over 109 k could unleash a breakout toward the 112-114 k resistance shelf.
H100 Group AB - Une bitcoin Treasury : 7.7 BTH100 Group AB is a company listed on Nasdaq First North (NGM Sweden), positioned as a Bitcoin Treasury Company. Formerly known as eBlitz Group, it recently underwent a major strategic pivot through a reverse merger with Healthy to 100 AS, a company focused on health, longevity, and sustainable technologies.
Since April 2025, H100 has started shifting to a hybrid model combining:
Bitcoin holdings as its primary treasury asset,
Investments in healthtech and wellness innovation,
An aggressive fundraising strategy through convertible loans to expand BTC acquisition and fund growth.
The company has recently accumulated 7.7 BTC in a “MicroStrategy-like” approach.
Trading volume has surged since May 2025.
The stock shows high volatility, often correlated with Bitcoin movements.
Active financing through convertibles (dilution risk to monitor).
Conclusion: H100 is a speculative play on Bitcoin performance, supported by a growth-oriented vision in the health and digital assets sectors.

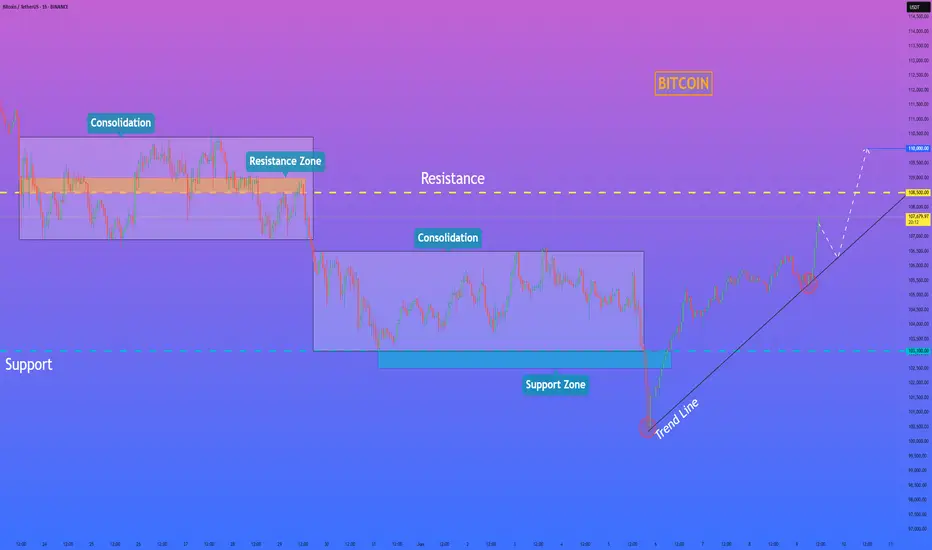
HelenP. I Bitcoin can break resistance level and continue growHi folks today I'm prepared for you Bitcoin analytics. After looking at this chart, we can see how the price traded inside a consolidation, where it reached a resistance level, which coincided with a resistance zone. Then it some time traded between the 108500 level and then dropped to the support level, thereby exiting from consolidation and breaking the 108500 level one more time. After this, BTC started to trade inside another consolidation, where it rebounded from the support level and rose to the top part of this range. Then it some time traded near this area and then dropped to the trend line, breaking the support level and exiting from the consolidation. But then BTC started to grow and rose to the 103100 level, broke it, and continued to grow. A not long time ago, it made a correction to the trend line and then bounced and continued to move up. So, I expect that BTCUSDDT will correct to the trend line and then rise to the resistance level and break it. Then, I thought that Bitcoin might continue to move up next; therefore, I set my goal at 110000 points. If you like my analytics you may support me with your like/comment ❤️
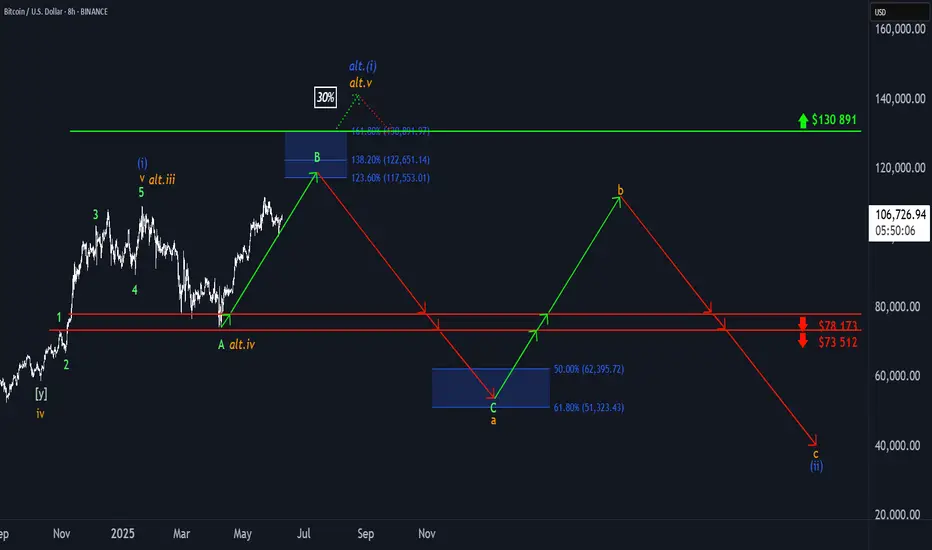
₿ BTC: Upside Potential Remains IntactBTC posted modest gains over the weekend, but more upside is expected in our primary scenario. We continue to track a corrective advance in green wave B, with the potential to extend into the upper blue Target Zone between $117,553 and $130,891. From that top, wave C should initiate a downward move into the lower blue zone between $62,395 and $51,323—completing orange wave a. Subsequently, we anticipate a bounce in wave b, followed by another decline in wave c, which should conclude the larger correction of blue wave (ii). There is still a 30% chance that blue wave alt.(i) could make a new high, extending beyond the Target Zone and delaying the broader corrective sequence.
📈 Over 190 precise analyses, clear entry points, and defined Target Zones - that's what we do.
Bitcoin — Breakout or Bull Trap? SFP Setup ExplainedAfter a clean drop that nearly tagged the psychological $100K level, Bitcoin printed a Swing Failure Pattern (SFP) — sweeping the lows and snapping back with strength. That bounce wasn’t just a reaction — it was a liquidity reclaim.
Now, price structure is shaping into a potential Inverted Head & Shoulders — a classic reversal pattern often forming before a bullish continuation.
🔍 Key Level to Watch:
$106,694.63 — This recent key high was just taken out. If we see rejection here (SFP), it could set up a high-probability low-risk short opportunity.
🎯 Short Trade Idea (Only on SFP confirmation):
Entry: After price sweeps $106,694.63 and shows rejection
Stop-Loss: Above wick high (e.g., ~$107.4K)
TP Zones: $103.5K and $101.7K
R:R: ~1:7
✅ Cleaner setup with confluence from structure and liquidity — high probability if confirmed.
📚 Educational Insight: Why SFPs Work So Well
SFPs (Swing Failure Patterns) are some of the most powerful setups in trading because they:
Trap breakout traders
Sweep liquidity and reverse quickly
Offer clear invalidation (wick high/low)
Allow for tight stop-loss and high R:R setups
Using SFPs in conjunction with key highs/lows, volume, and structure dramatically increases your edge.
📈 Why Order Flow Is Crucial for SFPs
1. See the Trap Form in Real Time
SFPs are essentially traps — price sweeps a key level, sucks in breakout traders, and then reverses. Order flow tools let you see this happen:
A spike in market buys above resistance
Followed by a lack of follow-through (no new buyers)
And then an aggressive absorption or reversal (selling pressure hits)
Without order flow, this is all hidden in the candles.
2. Confirm Liquidity Sweeps with Delta & CVD
Watch for a delta spike or Cumulative Volume Delta (CVD) divergence — a clear sign that aggressive buyers are getting absorbed.
This gives you confirmation that the sweep failed, not just a random wick.
3. Tight Entries with Confidence
When you see actual trapped volume or liquidation clusters at the SFP level, you can enter tighter with conviction — because you're not guessing, you’re reacting to actual intent and failure in the market.
4. Early Warning System for Reversal or Continuation
If the SFP fails to trigger a reversal (e.g. buyers step back in with strength), you’ll see it early in the flow — and can quickly reassess.
🧠 Bottom Line:
Order flow lets you stop guessing and start seeing the actual fight between buyers and sellers. Combine it with SFPs, and you're not just trading price — you're trading intent. That edge is huge.
_________________________________
💬 If you found this helpful, drop a like and comment!
Want breakdowns of other charts? Leave your requests below.
Bitcoin Weekly Outlook – June 9, 2025Bitcoin ( BINANCE:BTCUSDT ) continues to maintain its bullish structure, now trading around $106.6K. While price action looks strong, the market is approaching a key resistance zone between $110K–$120K, with technical signals hinting at a possible short-term rejection before further upside.
🔍 Technical Overview
Current Price: $106,654
Resistance Zone: $110K – $120K
Support Zone for Pullback: $98K – $100K
200 EMA & 100 EMA: Still trending up and providing strong base support
The chart suggests a potential "rejection-retest-rally" structure forming, where BTC may temporarily pull back before making a fresh push toward new highs.
📊 Momentum & Indicators
Stochastic RSI on the daily timeframe recently bottomed and is starting to curl back up — a potential bullish shift in momentum
Volume remains stable — no signs of aggressive distribution or FOMO activity yet
💬 Sentiment & Structure
The current structure remains healthy, with HH-HL (higher high - higher low) formation intact. Market sentiment is optimistic but not yet euphoric, which is ideal for continued accumulation.
Short-term traders may look for a pullback opportunity near the $98K–$100K zone before re-entering.
🎯 Mid-Term Outlook
If BTC holds the $98K–$100K range during a pullback, it could act as a springboard toward the $120K target in the coming weeks.
✅ Summary
🔵 Bullish trend intact
📉 Possible short-term pullback before breakout
📈 Mid-term target remains: $120K
🚫 Avoid chasing breakouts — position wisely at key supports
Let the price come to you. Patience pays more than FOMO.
Market Overview
WHAT HAPPENED?
Last week, after fluctuating in a sideways range, bitcoin began to decline. Only $300 wasn’t enough to reach the level of $100,000 — there was a strong absorption of market sales, and a rebound occurred.
WHAT WILL HAPPEN: OR NOT?
We tested the $104,500–$105,800 zone (accumulated volumes). There is no abnormal activity or strong sales within it, which increases the likelihood of continued upward movement to the next sell zone. After that, the current volumes may go long, forming a new support zone in the range of $105,800–$104,500.
This week, we can consider a long retest of the support of $104,500–$105,800 with confirmation of the buyers' reaction. However, low volumes in the upward wave keep the risk of a sharp resumption of sales. In this case, the key entry level will shift to the psychological mark of $ 100,000.
Supply Zone:
$107,000–$109,800 (accumulated volumes)
Demand Zones:
$101,600–$100,000 (previous push-volume zone + current buyer defense)
$98,000–$97,200 (local support)
$93,000 level
$91,500–$90,000 (strong buy-side imbalance)
IMPORTANT DATES
Macroeconomic developments this week:
• Wednesday, June 11, 12:30 (UTC) — publication of the basic US consumer price index for May, as well as in comparison with May 2024;
• Thursday, June 12, 06:00 (UTC) — UK GDP for April is published;
• Thursday, June 12, 12:30 (UTC) — publication of the number of initial applications for unemployment benefits and the US producer price index for May;
• Friday, June 13, 06:00 (UTC) — German consumer price index for May is published.
*This post is not a financial recommendation. Make decisions based on your own experience.
#analytics

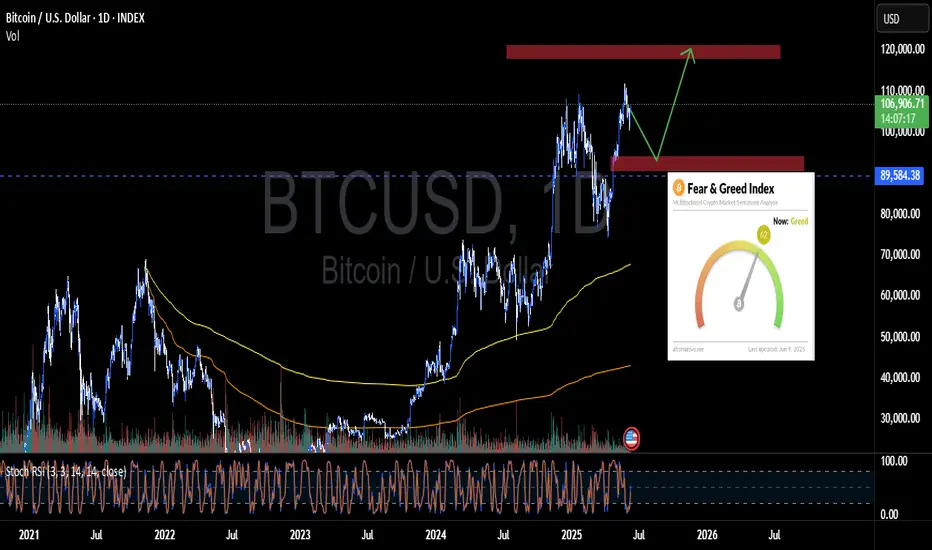
Is Bitcoin hearing for a ATHs, again?After reaching new highs around $112k, BTC has since retraced to support around $100k.
Currently reclaiming support around $105k, continued strength could see price reach ATHs in the coming days or weeks.
Losing support around $105k could signal a retest of $100k.
Referring to a previous post, my theory that we may not see sub $100k for the rest of the year is still in play, perhaps a signal of market strength despite the fear of the bull market ending.
Evidently, BTC is still holding up to all bullish expectations... Until proven otherwise.

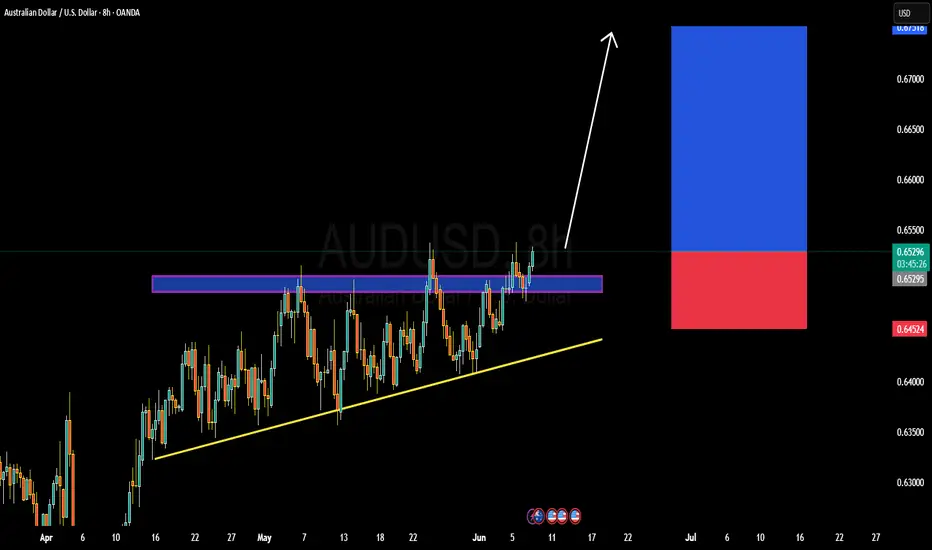
AUDUSD BULLISH OR BEARISH DETAILED ANALYSISAUDUSD is currently forming a strong ascending triangle on the 8H chart, with a series of higher lows pressuring a key horizontal resistance zone around 0.65250–0.65300. This is a classic bullish continuation pattern, indicating buyer strength and a potential breakout toward 0.67000 if the structure confirms. The current price action at 0.65285 shows that bulls are testing the upper boundary again, signaling possible breakout acceleration as we move into mid-June volatility.
From a macro standpoint, the Australian dollar is supported by rising commodity demand, particularly in iron ore and copper — both of which are showing strength in global markets. At the same time, the Federal Reserve remains cautious with its rate path, with recent U.S. labor data pointing to a cooling job market. Traders are now pricing in possible rate cuts sooner than expected, weakening the dollar’s bullish grip. This divergence in central bank tone and economic performance favors risk-on currencies like the AUD.
Technically, the ascending triangle is providing solid structure and confluence. Breakout traders may look for a clean candle close above 0.65350, which could open the path to the 0.67000 zone with minimal resistance ahead. A well-placed stop below the 0.64500 zone keeps risk controlled, and the favorable risk-to-reward ratio makes this setup ideal for swing continuation strategies in trending environments.
This pattern has been building over several weeks, showing market accumulation and strong bullish compression. With today's fundamentals aligning with the technical structure, AUDUSD looks ready to launch into a higher bullish leg. Keep eyes on the breakout candle and volume confirmation as we may be entering a powerful momentum phase toward the 0.67 handle.
Bitcoin above the supportBitcoin back tested the important yellow resistance on weekly and closed a hammer candle above the pivot.
I wont be surprise to see $130k in couple of weeks.
Bitcoin - Bitcoin holds $100,000 support?!Bitcoin is above the EMA50 and EMA200 on the four-hour timeframe and has broken out of its short-term descending channel. We can look for Bitcoin short positions from the supply zone. If this corrective move occurs, we can also look for Bitcoin long positions in the demand zone.
It should be noted that there is a possibility of heavy fluctuations and shadows due to the movement of whales in the market and capital management in the cryptocurrency market will be more important. If the downward trend continues, we can buy in the demand range.
Bitcoin network transaction activity has dropped to its lowest level since October 2023. According to data from The Block, the seven-day moving average of Bitcoin transactions has recently declined to 317,000—marking the lowest point in the past 19 months. This decline comes at a time when Bitcoin’s price still hovers near its all-time highs.
Meanwhile, Bitcoin Core developers have recently stated that network nodes should not block the relay of low-fee or non-standard transactions if miners are willing to process them. This highlights a shift in Bitcoin’s policy direction and indicates a growing acceptance among some miners of lower-cost transactions.
In certain instances, miners’ appetite for transaction fees appears to have diminished. Mononaut, founder of the Mempool project, pointed out that a transaction with an almost-zero fee was recently included in a block. This could signal reduced network activity or a declining need among miners to prioritize high-fee transactions.
Currently, only 0.3% of American investors’ total assets are allocated to Bitcoin. Real estate dominates their portfolios, followed by bonds and stocks.This means that Bitcoin accounts for a very small portion of U.S. investor wealth. However, if even a small fraction of capital currently tied up in real estate, stocks, or bonds shifts into Bitcoin in the future, it could have a substantial market impact—an encouraging sign over the long term.
The United States has emerged as the dominant force in the Bitcoin ecosystem. A report by River outlines how this dominance has reached its peak. The U.S. holds nearly 40% of the total Bitcoin supply, and American companies account for a staggering 94.8% of public Bitcoin ownership. Additionally, 82% of development funding and approximately 79.2% of Bitcoin ETF ownership originate from the U.S. The country also commands about 36% of the global hash rate.
Since 2021, the total value of Bitcoin mined by American companies has reached $42.6 billion, accompanied by over $30 billion in investment into Bitcoin mining infrastructure. The U.S. now hosts more than 150 Bitcoin-related companies and 40 mining sites with capacities exceeding 10 megawatts.
Today, nearly two-thirds of all Bitcoin in circulation is held by individuals who rarely—or never—sell their coins. In just the last 30 days, roughly 180,000 Bitcoins have been moved to wallets with historically low selling activity. Meanwhile, whales continue to accumulate Bitcoin at price levels above $100,000.
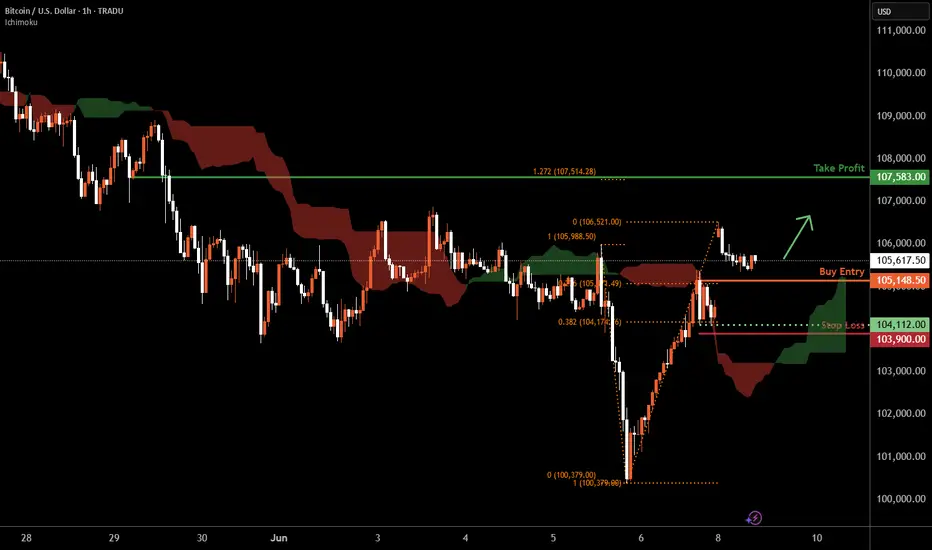
Bitcoin H1 | Bullish rebound to extend higher?Bitcoin (BTC/USD) is falling towards a pullback support and could potentially bounce off this level to climb higher.
Buy entry is at 105,148.50 which is a pullback support that aligns with the 23.6% Fibonacci retracement.
Stop loss is at 103,900.00 which is a level that lies underneath a swing-low support and the 38.2% Fibonacci retracement.
Take profit is at 107,583.00 which is a pullback resistance that aligns with the 127.2% Fibonacci extension.
High Risk Investment Warning
Trading Forex/CFDs on margin carries a high level of risk and may not be suitable for all investors. Leverage can work against you.
Stratos Markets Limited (tradu.com ):
CFDs are complex instruments and come with a high risk of losing money rapidly due to leverage. 63% of retail investor accounts lose money when trading CFDs with this provider. You should consider whether you understand how CFDs work and whether you can afford to take the high risk of losing your money.
Stratos Europe Ltd (tradu.com ):
CFDs are complex instruments and come with a high risk of losing money rapidly due to leverage. 63% of retail investor accounts lose money when trading CFDs with this provider. You should consider whether you understand how CFDs work and whether you can afford to take the high risk of losing your money.
Stratos Global LLC (tradu.com ):
Losses can exceed deposits.
Please be advised that the information presented on TradingView is provided to Tradu (‘Company’, ‘we’) by a third-party provider (‘TFA Global Pte Ltd’). Please be reminded that you are solely responsible for the trading decisions on your account. There is a very high degree of risk involved in trading. Any information and/or content is intended entirely for research, educational and informational purposes only and does not constitute investment or consultation advice or investment strategy. The information is not tailored to the investment needs of any specific person and therefore does not involve a consideration of any of the investment objectives, financial situation or needs of any viewer that may receive it. Kindly also note that past performance is not a reliable indicator of future results. Actual results may differ materially from those anticipated in forward-looking or past performance statements. We assume no liability as to the accuracy or completeness of any of the information and/or content provided herein and the Company cannot be held responsible for any omission, mistake nor for any loss or damage including without limitation to any loss of profit which may arise from reliance on any information supplied by TFA Global Pte Ltd.
The speaker(s) is neither an employee, agent nor representative of Tradu and is therefore acting independently. The opinions given are their own, constitute general market commentary, and do not constitute the opinion or advice of Tradu or any form of personal or investment advice. Tradu neither endorses nor guarantees offerings of third-party speakers, nor is Tradu responsible for the content, veracity or opinions of third-party speakers, presenters or participants.