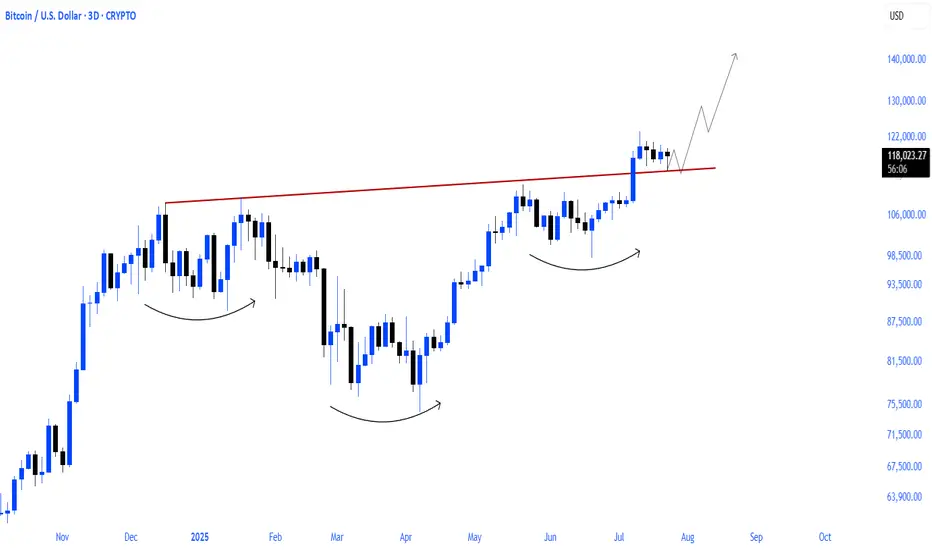
BTC | ALT Season, then BEARISH CYCLE BeginsBitcoin is likely moving in to the beginning of a bearish cycle.
I'm not saying this is immediate, we first need to see altseason - however, if BTC increases it may not go any higher than the last high of $123k. We could easily see the price hover around this zone with a few small increases and decreases for the next few weeks as alts make their respective moves.
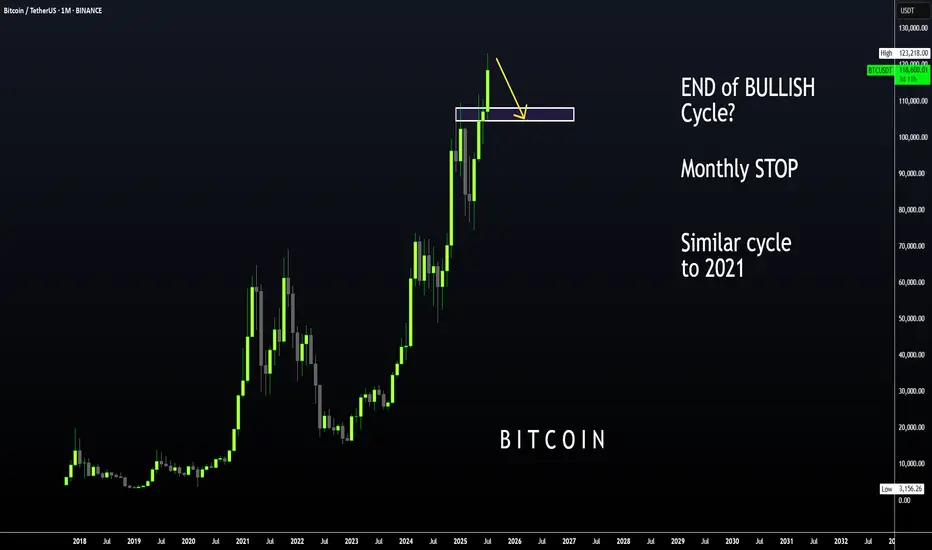
I have been talking about the 2021 fractal for a couple of months, where BTC took its time to correct and then made another ATH which was only slightly higher.
We already see a similar pattern playing out in the monthly timeframe if we overlay bars pattern from 2021:
Although Bonce zone 3 may only be in several months, these are the major support zones where BTC could bounce from. Ideal for a swing:
____________________
BINANCE:BTCUSDT
Bitcoin (Cryptocurrency)
BITCOIN PREDICTION: HUGE BREAKOUT SOON!! (watch this level) Yello Paradisers! I'm sharing with you multi-timeframe analysis on Bitcoin, levels to watch out for, confirmations we are waiting for, and everything needed for successful professional trading that is being profitable in the long run.
I'm sharing with you zig-zag from the Elliot Wave pattern formation. I'm also sharing a possible impulse we are going through, a head and shoulders pattern and its target, and the next major resistance and support levels.
I'm sharing with you a contracting triangle setup and how to trade it, along with an ending diagonal setup and how to trade it. Watch out for confirmations and how the price is developing based on what I have been talking about in this video, then trade it as a professional trader should.
Make sure that you have a great risk management, trading strategy, and tactic for entering the trades. I have explained some tactics that I'm watching for in this video, but make sure that all these tactics are well within your larger trading strategy and that you're approaching the market professionally. Don't try to get rich quick.
Make sure that you are focusing on long-term profitability and survival. This is the only way you can make it in crypto trading!

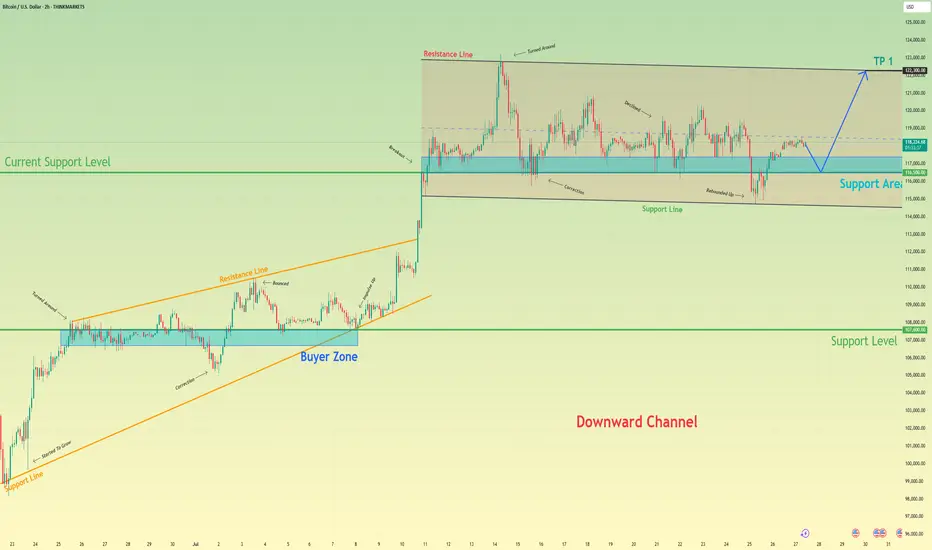
Bitcoin will rebound up from support area to resistance lineHello traders, I want share with you my opinion about Bitcoin. After a strong upward trend that originated from the buyer zone and evolved through an upward wedge, bitcoin executed a decisive breakout, shifting the market into a new, higher-value market phase. This powerful move has since led to an extended period of wide consolidation within a well-defined horizontal channel, a classic sign of the market pausing to absorb the prior impulse and build cause for its next major leg. Currently, the asset's price action is rotating within this structure, defined by a key support area around 116500 and an upper resistance line. Having been rejected from the top, the price is now completing another downward correction and is approaching the channel's foundational support for a crucial test. The primary working hypothesis is a long scenario, predicated on the proven resilience of this support level. A confirmed upward rebound from this 116500 zone would signal that the accumulation within the channel is continuing and likely to resolve upwards. Therefore, the tp is logically and strategically placed at 122300, as this level not only coincides perfectly with the channel's upper resistance line but also represents the completion of the internal rotation, setting the stage for a potential continuation of the larger uptrend. Please share this idea with your friends and click Boost 🚀
Disclaimer: As part of ThinkMarkets’ Influencer Program, I am sponsored to share and publish their charts in my analysis.
Bitcoin Correction Maturing – Long Setup Brewing!Bitcoin ( BINANCE:BTCUSDT ) has fallen by more than -4% over the past day.
Let's take a look at the reasons for the decline.
One of the key reasons behind Bitcoin’s decline in the past 24 hours ( July 25 ) could be the reduced likelihood of Jerome Powell being replaced as Chair of the Federal Reserve.
In recent days, market participants were speculating that Donald Trump might replace Powell — a scenario that was considered bullish for risk assets like Bitcoin. However, recent reports of a meeting between Trump and Powell, and signs that Powell might not be dismissed, have weakened this fundamental narrative.
This meeting may signal a truce or reduced tension between Trump’s team and Powell , which could imply a continuation of current Fed policies. That’s bad news for Bitcoin, as it removes a potential psychological tailwind from the market and dampens speculative sentiment.
As a result:
Over $500 million in liquidations(Long Positions) occurred
Weak inflows into Bitcoin ETFs
A stronger U.S. Dollar Index ( TVC:DXY )
And declining Gold( OANDA:XAUUSD ) prices over the past two days
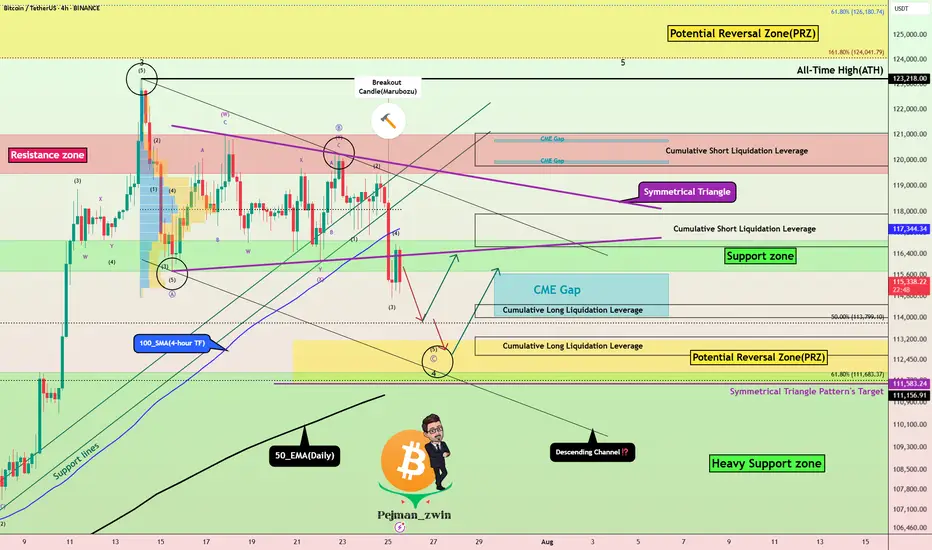
all added additional selling pressure on BTC. Now let's take a look at Bitcoin's conditions on the 4-hour time frame .
Bitcoin currently appears to have broken the Support zone($116,900-$115,730) , Support lines , 100_SMA(4-hour TF) , and the lower line of the Symmetrical Triangle Pattern with a bearish Marubozu candle .
Note : In general, trading was difficult when Bitcoin was inside a symmetrical triangle (about 10 days).
It also seems that the pullback to these zones has ended and Bitcoin is waiting for the next decline .
In terms of Elliott Wave theory , Bitcoin appears to be completing microwave 5 of microwave C of major wave 4 . There is a possibility that main wave 4 will create a descending channel and complete at the bottom of the descending channel (at Potential Reversal Zone(PRZ) ).
I expect Bitcoin to start rising again after completing the CME Gap($115,060-$114,947) from Cumulative Long Liquidation Leverage($114,480-$114,000) or Cumulative Long Liquidation Leverage($113,284-$112,603) near the PRZ and Heavy Support zone($111,980-$105,820) .
Cumulative Short Liquidation Leverage: $117,904-$116,665
Cumulative Short Liquidation Leverage: $121,046-$119,761
Do you think Bitcoin has entered a major correction, or does it still have a chance to create a new ATH?
Please respect each other's ideas and express them politely if you agree or disagree.
Bitcoin Analyze (BTCUSDT), 4-hour time frame.
Be sure to follow the updated ideas.
Do not forget to put a Stop loss for your positions (For every position you want to open).
Please follow your strategy and updates; this is just my Idea, and I will gladly see your ideas in this post.
Please do not forget the ✅' like '✅ button 🙏😊 & Share it with your friends; thanks, and Trade safe.
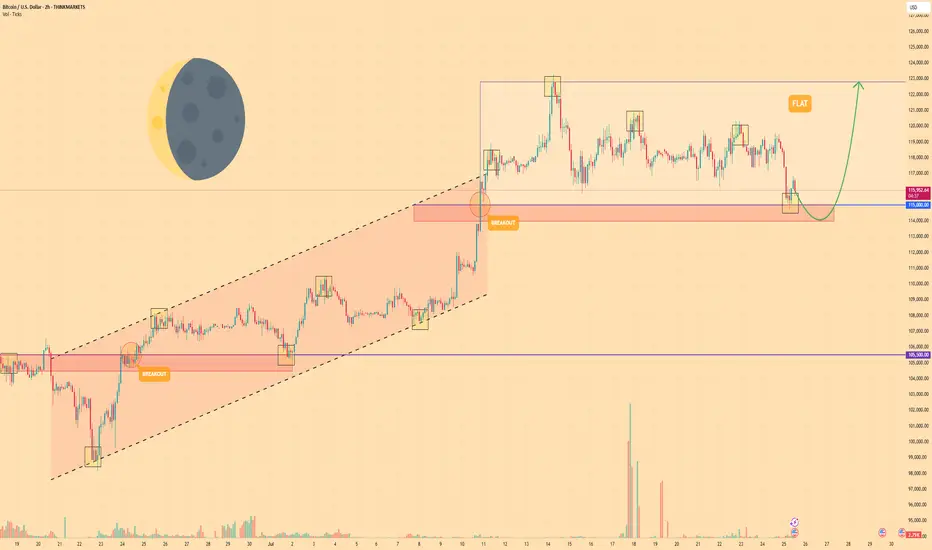
BITCOIN - Price can correct to support area and then start riseHi guys, this is my overview for BTCUSD, feel free to check it and write your feedback in comments👊
For a significant period, the price of Bitcoin was trading upwards within the confines of a rising channel.
Strong buying pressure led to a breakout above the channel's upper boundary, signaling an acceleration of the uptrend.
After this breakout, the upward momentum stalled, and the price entered a new phase of horizontal consolidation, forming a wide flat range.
The price recently tested the upper resistance of this range near $122800 and was rejected.
As a result, the asset is currently in a corrective move downwards, approaching the key support area located between $114000 and $115000
I expect that the price will find support at the bottom of this flat range, reverse its course, and begin a new rally back towards the top of the range at $122800
If this post is useful to you, you can support me with like/boost and advice in comments❤️
Disclaimer: As part of ThinkMarkets’ Influencer Program, I am sponsored to share and publish their charts in my analysis.
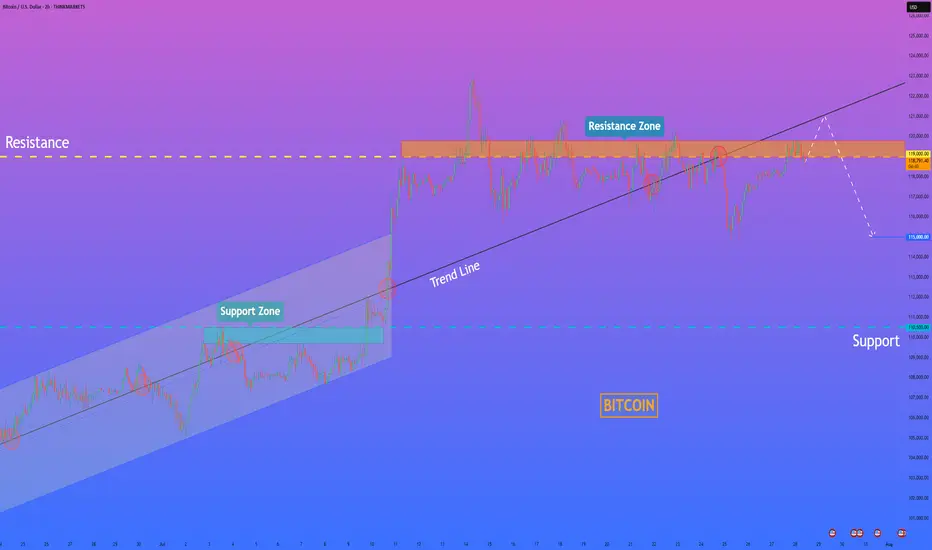
HelenP. I Bitcoin will rise to trend line and then dropHi folks today I'm prepared for you Bitcoin analytics. If we look at the Bitcoin chart, a significant structural change has recently taken place, with the price decisively breaking below the major ascending trend line that had defined the long-term uptrend. This breakdown is a strong signal that the market character has shifted from bullish to bearish, with sellers now in control. The price is currently consolidating below this broken structure, and I believe the former support levels, including the trend line and the horizontal resistance zone at 119000 - 119800, will now act as a formidable confluence of resistance. My analysis for a short position is based on the classic break-and-retest principle. I expect the price can rise to the trend line and then drop. A strong and clear rejection from this area would serve as the primary confirmation that the breakdown is valid and that the path of least resistance is now to the downside. Therefore, I have set the goal for this developing downward move at the 115000 level. If you like my analytics you may support me with your like/comment ❤️
Disclaimer: As part of ThinkMarkets’ Influencer Program, I am sponsored to share and publish their charts in my analysis.
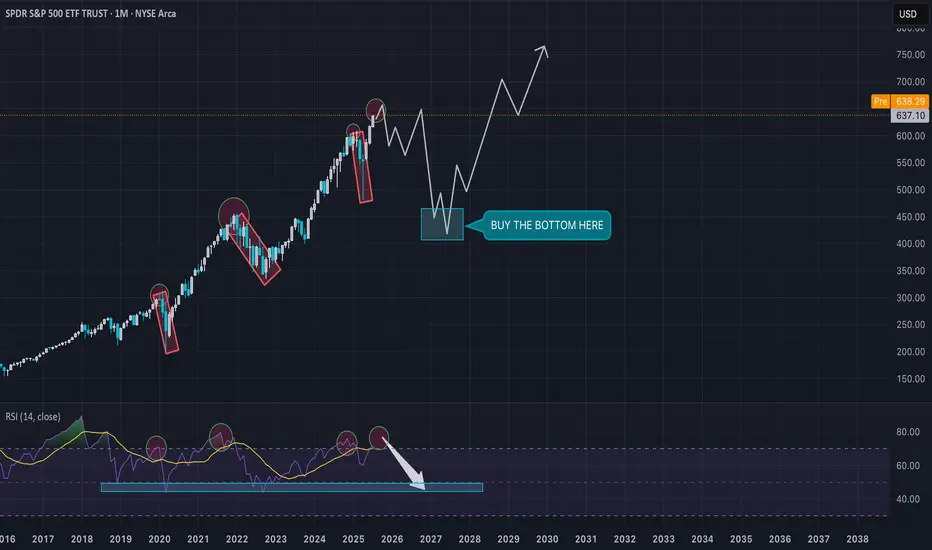
Are you ready for this scenario?? BUY THE NEXT BOTTOM!!!Spx is gonna drop hard, are you ready to buy the next bottom?
I expect SPX to reach 4,440 atleast... NASDAQ, BITCOIN are gonna drop hard too...
BUY EVERYTHING IN 2026/2027 AND ENJOY THE NEXT CYCLE.
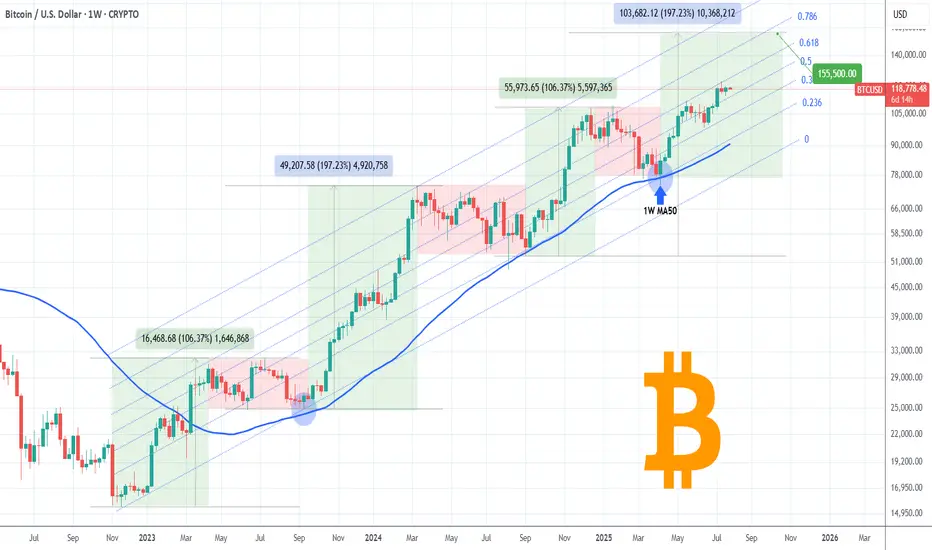
BITCOIN One last rally left in the tank?Bitcoin (BTCUSD) has been on a non-stop rally following the April 07 2025 rebound on its 1W MA50 (blue trend-line). Being inside a 3-year Channel Up since the November 2022 market bottom, that was the second time it rebounded on the 0.236 Channel Fibonacci level.
The previous one was during the last Bullish Leg, which was a +106.37% rise, absolutely symmetrical with the Channel's first such Leg in late 2022 - most of 2023.
If the September 2024 (Higher Low) on the 1W MA50 was the start however of a greater expansion Leg similar to late 2023 - early 2024, which delivered a +197.23% rise, we can claim that by October we may see it peaking at around $155500.
That seems to agree with the majority of Cycle Top models we have come up after many analyses. Do you think that will be the case? Feel free to let us know in the comments section below!
-------------------------------------------------------------------------------
** Please LIKE 👍, FOLLOW ✅, SHARE 🙌 and COMMENT ✍ if you enjoy this idea! Also share your ideas and charts in the comments section below! This is best way to keep it relevant, support us, keep the content here free and allow the idea to reach as many people as possible. **
-------------------------------------------------------------------------------
💸💸💸💸💸💸
👇 👇 👇 👇 👇 👇
Understanding Wedge Patterns - A Real Bitcoin Case Study🎓📊 Understanding Wedge Patterns - A Real Bitcoin Case Study 🧠📈
Hi everyone, FXPROFESSOR here 👨🏫
From this moment forward, I will no longer be posting targets or trade setups here on TradingView. Instead, I’ll be focusing 100% on education only for here in Tradinfview.
Why? Because over time I’ve learned that even when traders receive the right charts, most still struggle to trade them effectively. So, from now on, FX Professor Crypto content here will be strictly educational — designed to teach you how to read and react to the markets like a professional. Unfortunately I cannot be posting on Tradingview frequent updates like I do all day. Education is always better for you guys. And i am very happy to share here with you what matters the most.
🧩 In today’s post, we dive into one of the most misunderstood formations: the wedge pattern.
Most resources show wedges breaking cleanly up or down — but real price action is messier.
🎥 I recorded a video a few days ago showing exactly how BTC respected a wedge formation.
⚠️ Note: Unfortunately, TradingView doesn’t play the audio of that clip — apologies that you can’t hear the live commentary — but the visuals are clear enough to follow the logic. (there is no advertising of any kind on the video so i hope i don't get banned again - i did make a mistake the last time and will avoid it-the community here is awesome and needs to stay clean and within the rules of TV).
Here’s what happened:
🔸 A clean wedge formed over several days
🔸 We anticipated a fake move to the downside, grabbing liquidity
🔸 BTC rebounded off support around a level marked in advance
🔸 Then price re-entered the wedge, flipping support into resistance
The lesson?
📉 Often price will exit the wedge in the wrong direction first — trapping retail traders — before making the real move. This is a classic liquidity trap strategy, exercised by the 'market'.
💡 Remember:
Wedges often compress price until it "runs out of space"
The initial breakout is often a trap
The true move tends to come after liquidity is taken
The timing of the 'exit' has a lot to do with the direction. In the future we will cover more examples so pay attention.
I stayed long throughout this move because the overall market context remained bullish — and patience paid off.
Let this be a reminder: it’s not about guessing the direction — it’s about understanding the mechanics.
More educational breakdowns to come — keep learning, keep growing.
One Love,
The FX PROFESSOR 💙
Disclosure: I am happy to be part of the Trade Nation's Influencer program and receive a monthly fee for using their TradingView charts in my analysis. Awesome broker, where the trader really comes first! 🌟🤝📈

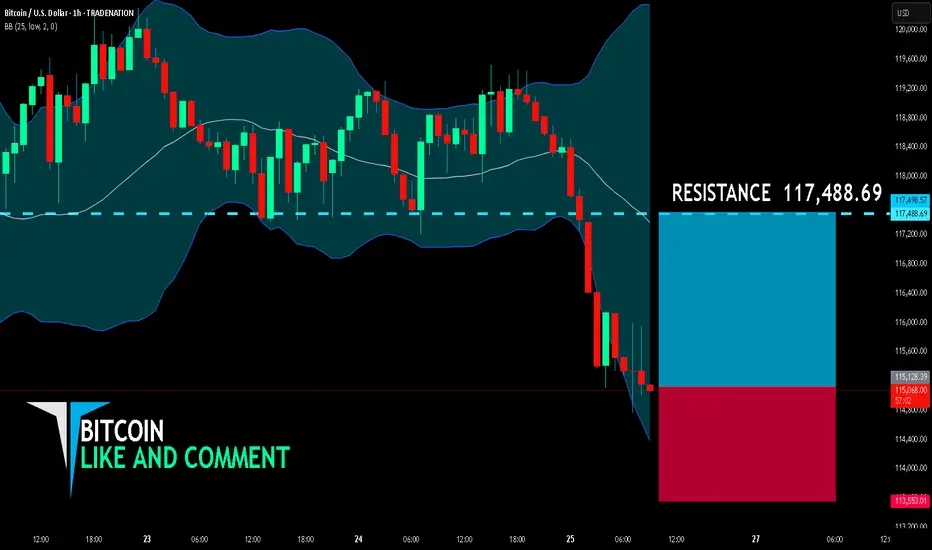
BITCOIN BULLS ARE GAINING STRENGTH|LONG
BITCOIN SIGNAL
Trade Direction: long
Entry Level: 115,128.39
Target Level: 117,488.69
Stop Loss: 113,553.01
RISK PROFILE
Risk level: medium
Suggested risk: 1%
Timeframe: 1h
Disclosure: I am part of Trade Nation's Influencer program and receive a monthly fee for using their TradingView charts in my analysis.
✅LIKE AND COMMENT MY IDEAS✅
Bitcoin - Will Bitcoin continue its upward trend?!Bitcoin is above the EMA50 and EMA200 on the four-hour timeframe and is in its medium-term ascending channel. Bitcoin’s current upward momentum has the potential to reach its previous ATH. If it corrects, you can look for Bitcoin buying opportunities from the identified support area, which is also at the intersection of the bottom of the ascending channel.
If this support is lost, the decline will continue to around $113,000, where you can again buy Bitcoin with a better risk-reward ratio.
It should be noted that there is a possibility of heavy fluctuations and shadows due to the movement of whales in the market, and capital management will be more important in the cryptocurrency market. If the downward trend continues, we can buy within the demand range.
Last week, a group of U.S. senators released an initial draft of a new legislative proposal aimed at creating a clearer regulatory framework for the digital asset industry in the United States. The proposal builds on the recently passed CLARITY Act in the House of Representatives and focuses on strengthening market structure, enhancing consumer protection, and expanding regulatory oversight.
According to the senators, the bill addresses key areas such as banking, disclosure requirements, securities classification, and measures to combat illicit financial activity.Senator Lummis, in highlighting the proposal, stressed the urgent need for legal clarity to support the growth of this emerging industry within the U.S. The legislation aims to facilitate the integration of digital assets into banking services and would allow financial holding companies to provide services based on such assets.
The draft also includes measures aimed at preventing illegal financial activities, such as improving regulatory standards and boosting inter-agency cooperation to identify and block misuse of digital assets.
In addition, the senators have issued a “Request for Information” (RFI) to support the legislative process and have invited the public to share their opinions on more than 35 related topics, encouraging broader engagement in shaping the bill.
Meanwhile, in Asia, Japan-based firm Metaplanet announced that it has added 780 BTC worth $93 million to its digital holdings. This acquisition brings the company’s total Bitcoin reserves to 17,132 BTC, valued at roughly $2 billion. Metaplanet is fast becoming one of the largest institutional Bitcoin treasuries in the region—potentially serving as a model for other firms across Asia.
At the same time, publicly traded U.S. companies have significantly ramped up their Bitcoin holdings. By the end of Q2 2025, these companies had accumulated nearly 900,000 BTC, marking a 35% increase over the previous quarter. This surge, driven primarily by firms such as MicroStrategy, has sent demand for Bitcoin soaring.
Some analysts believe that the $1.5 trillion in free cash flow held by companies within the S&P 500 index could spark a new wave of institutional Bitcoin buying.
Looking ahead, the upcoming week is packed with critical U.S. economic data. Alongside the Non-Farm Payroll (NFP) employment report and inflation metrics via the Personal Consumption Expenditures (PCE) index, the initial estimate for Gross Domestic Product (GDP) and various other indicators will be released—potentially offering a clearer picture of where the U.S. economy is heading.
The Federal Reserve remains primarily focused on inflation and labor market dynamics. June CPI data indicated signs of inflationary pressure caused by tariffs. If Thursday’s PCE report—particularly its core reading—confirms a similar trend, the Fed may decide against a rate cut in September. As a result, financial markets have priced in only about a 65% chance of a rate cut at that meeting.
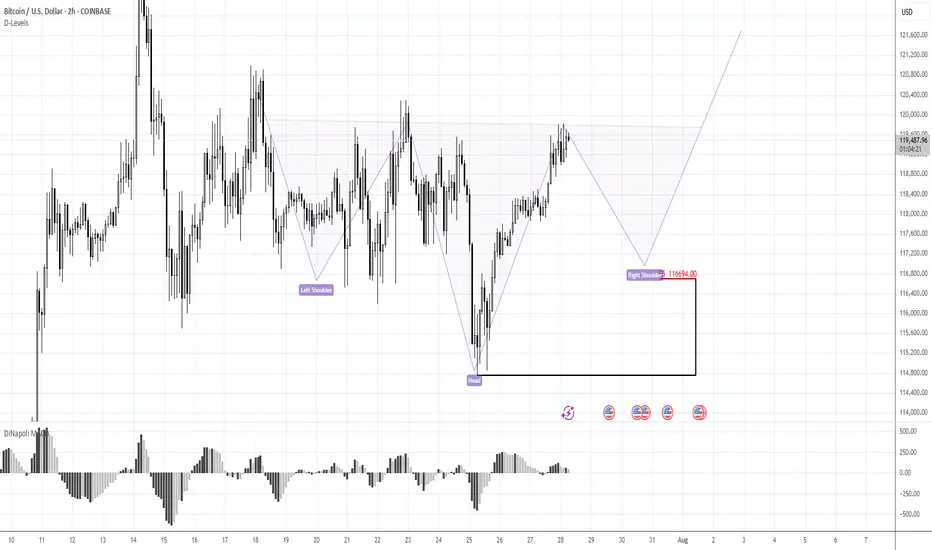
BTC 116.70K stands in focusMorning folks,
Once we've prepared the analysis, we've got upsetting squeeze down, thanks to Galaxy massive sell-off. I don't know what they were trying to do - either hunted for stops under 116K, or just sold in most unwelcome moment... but unfortunately such an issues are out of our control.
For now - BTC totally reversed this sell-off and once again shows positive sentiment. Now we consider same reverse H&S pattern, but this time of a bigger scale. 116.70K support area, where, the right arm should be formed now stands in our focus for long entry. We consider no shorts by far. Hopefully no more tricks will follow from old Donny or somebody else...
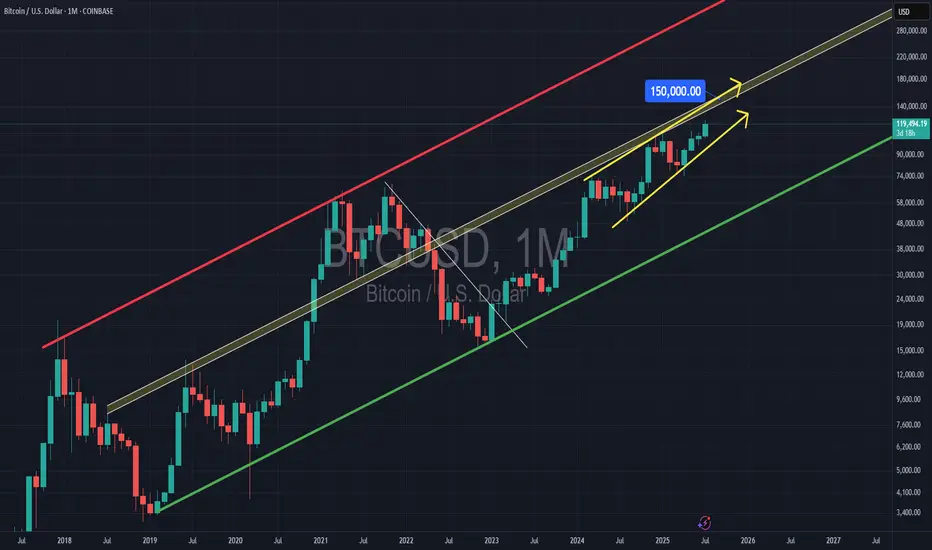
BITCOIN & 150kBitcoin in this RISING WEDGE, inside this huge RISING CHANNEL, gives us the resistance of the rising wedge & the middle line of the rising channel at $150,000.
This might be the TOP.
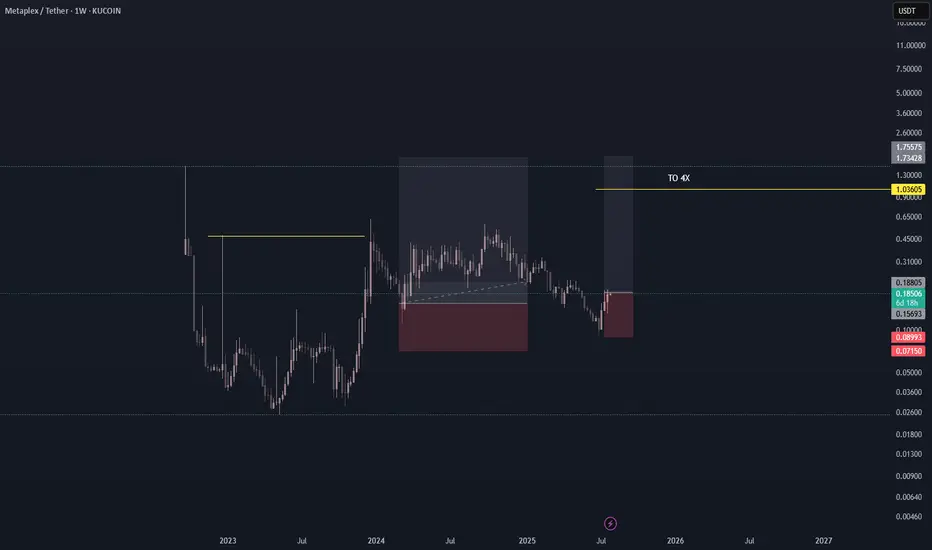
METAPLX/USDT BUY LONG FOR 4XCRYPTO - METAPLEX/USDT
EXPECTED RETURN TO 400-500%
** Crypto investing is highly volatile, you may lose all invested money, please keep it in mind and invest what you can lose and be ok.**
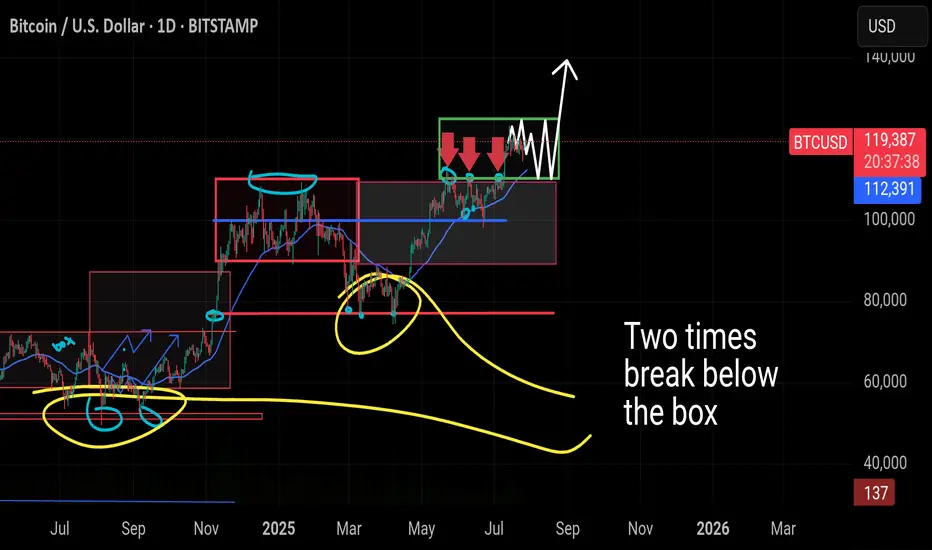
#Bitcoin – What’s Really Happening? Daily Structure + Macro#Bitcoin – What’s Really Happening?
Daily Structure + Macro Setup = Big Move Loading
🔸 1D Chart: CRYPTOCAP:BTC Range-Bound Between $125K–$110K
Bitcoin is currently trading inside a tight sideways range, marked by resistance near $125,000 and support around $110,000. This is now the third time we've seen price consolidate in this green zone.
🔸 In the previous two attempts, BTC briefly dipped below support before quickly reclaiming the level — classic fakeouts, not real breakdowns. The current price behavior mirrors that same structure.
🔸 What If CRYPTOCAP:BTC Drops Again?
A dip below $110K or even toward $100K should not trigger panic. Historically, these wicks below the range are liquidity grabs — not signs of weakness. As long as the 200 MA holds and price doesn’t sustain under $100K, the macro trend remains bullish.
🔸 Key Zones:
– Immediate support: $112,398
– Major support: $100K psychological level
– Structure invalidation: Sustained loss below $100K (not expected)
🔸 Macro Outlook: Still Bullish
While BTC chops sideways, the broader environment is heating up:
🔸 Trump-EU Mega Trade Deal
Markets just got a major catalyst — a massive U.S.–EU agreement that includes:
– $750B in U.S. energy exports
– $600B in EU investment
– $150B in energy purchases from U.S.
This clears out tariff fears and opens the door for stocks and crypto to run. Risk appetite is returning fast.
🔸 Whale Activity Panic = Noise
Galaxy Digital wallet movement spooked the market temporarily, pushing BTC to $114,500. But zoom out:
– ETF inflows still dominate daily sell volume
– BlackRock continues absorbing supply
– Long-term whales haven’t sold — they’re holding
This was not a breakdown. It was a shakeout. Accumulation is still happening.
🔸 The Real Fuel: M2 Money Supply
Here’s where things really align for the bulls:
– In 2020, a 25% rise in M2 → BTC 800% rally
– In 2025 so far: +2.3% increase, and we’re still in “tightening”
– Largest M2 spike: +0.63% in June
Given BTC typically lags M2 by 60–90 days, the June print is setting up for a 15–17.5% upside over the coming weeks. That puts us on a clear path toward $130,000+
🔸 Bitcoin is sideways, not weak. Range-bound price action is accumulation, not distribution. Macro signals are aligning, M2 is expanding, and whale panic was short-lived.
We’re not just holding a range — we’re coiling for the breakout.
You’re early. Stay ready.
#bitcoin
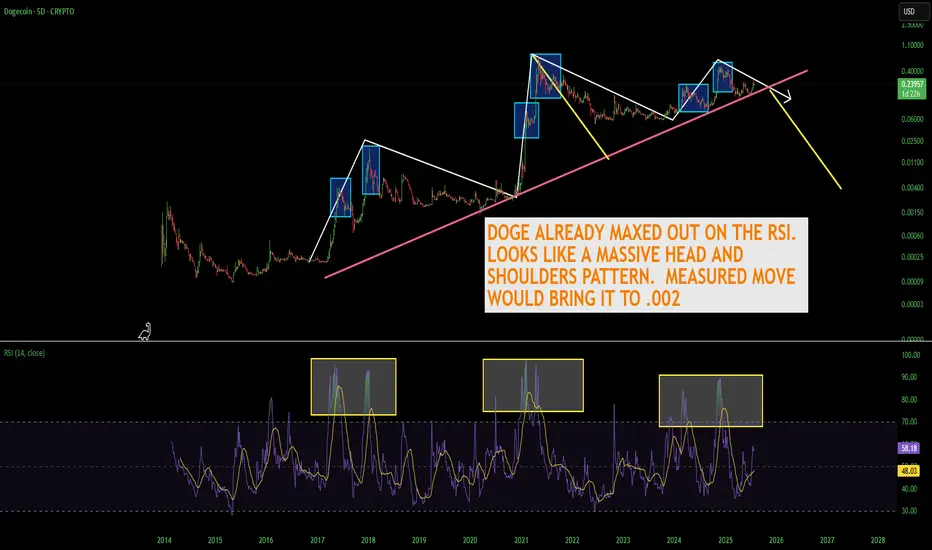
THE TRUTH ABOUT DOGECOINDogecoin is looking really toppy. As you can see the RSI has peaked out early before a new high which is alarming. I think Doge is in serious trouble here as the meme craze starts to shift into newer memes. If the head and shoulders pattern plays out you're looking at a catastrophic drop down to 2 tenths of a penny. Doge is EXTREMELY overvalued and needs to come back down to earth. Don't forget there is close to 15 million Doge mined per day forever. It appears with the way the RSI peaked and price didn't break the high that Doge has reached a plateau in price even if the market cap continues to go up.
Not financial advice just my opinion.
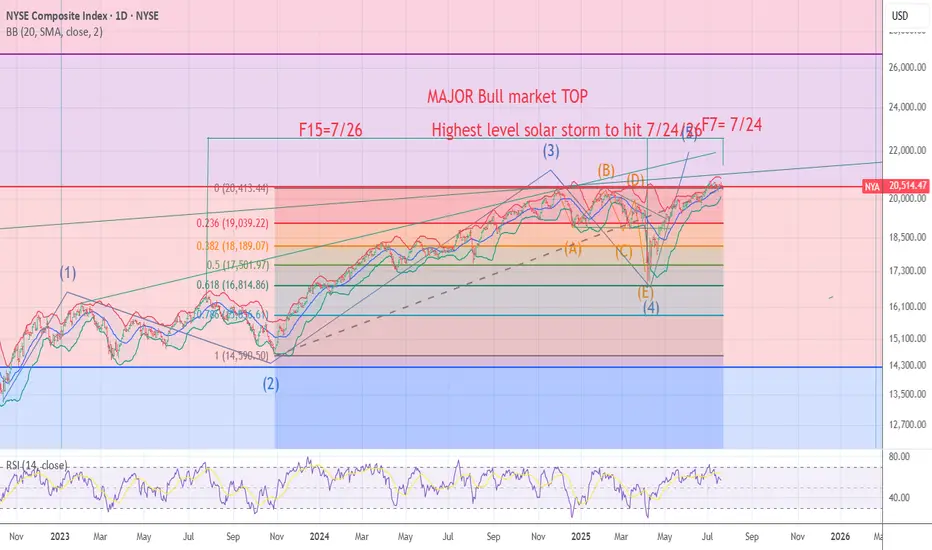
NYA chart Posted The signal for the Top is hours away .7/24/7/26The chart posted is my work based on the golden ratio and SPIRAL calendar work .We will be hit by one of if not the highest ever solar storms from 7/24 to 7/26 I will be re shorting into this date And will look for the markets worldwide to see a massive event .I have been talking a massive earthquake and the markets to begin a drop into OCT 10 to the 20th . best of trades .Wavetimer
BTC/USD Buy Setup (6H Chart)📈 BTC/USD Buy Setup (6H Chart)
Strategy: Trendline Support Bounce
🔹 Entry
Price: $118,674.3
Reason: Price is bouncing off a supportive trendline and holding above the 1st Support zone.
🔻 Stop Loss (SL)
Price: $114,470.6
Reason: Below the 1st Support zone to protect against breakdown.
🎯 Take Profit Targets
TP1: $123,269.6
Reason: Near recent swing high, good for partial profit.
TP2: $127,661.4
Reason: Next resistance zone, ideal for full exit or trailing stop.
#MJTrading
#Bitcoin

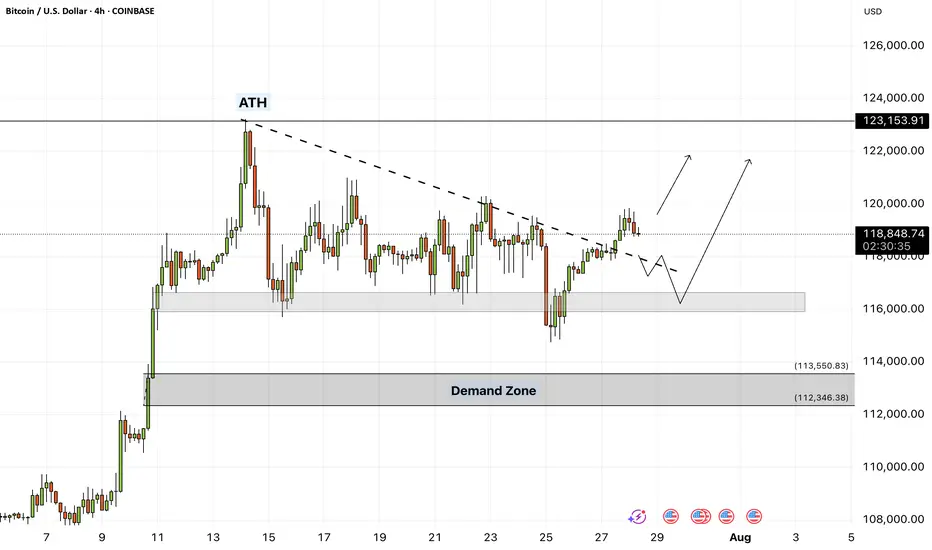
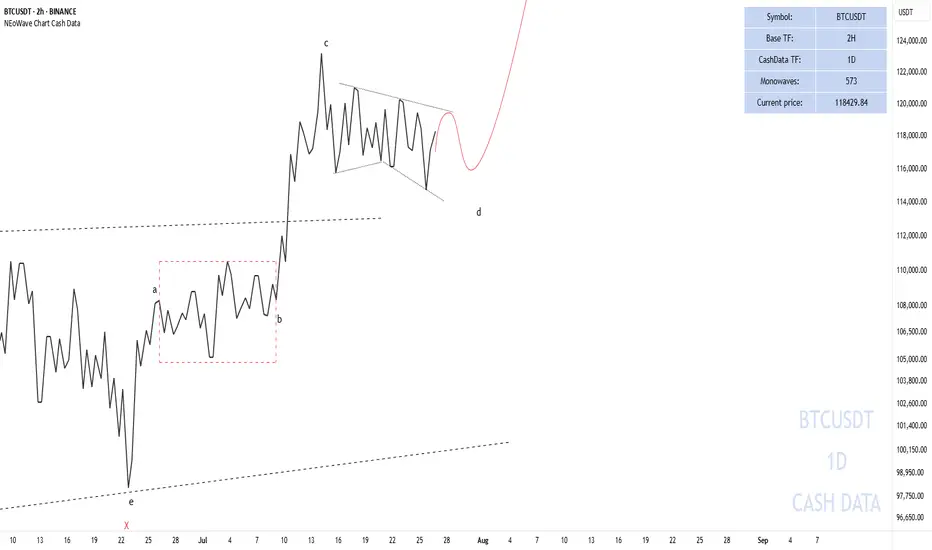
Pessimistic scenario for BITCOINAfter Bitcoin touched the price of 123,218, it entered a corrective phase. According to previous analysis, we expected the price to touch the range of $115,000-113,000. With the formation of more waves, it seems that the recent correction that started on July 14, 2025 is a diametric (bowtie) where waves f and g of this diametric are not yet complete and this pattern is part of a higher degree diametric and after this pattern is completed I expect a move towards the range of 140,000-150,000
Pessimistic scenario:
The pessimistic scenario is that this wave becomes a double pattern and enters the price range of wave-b (marked with a red dashed line) of the higher degree diametric. The probability of this scenario occurring is low and I consider the first scenario more likely, but we must be prepared for all market movements.
Good luck
NEoWave Chart
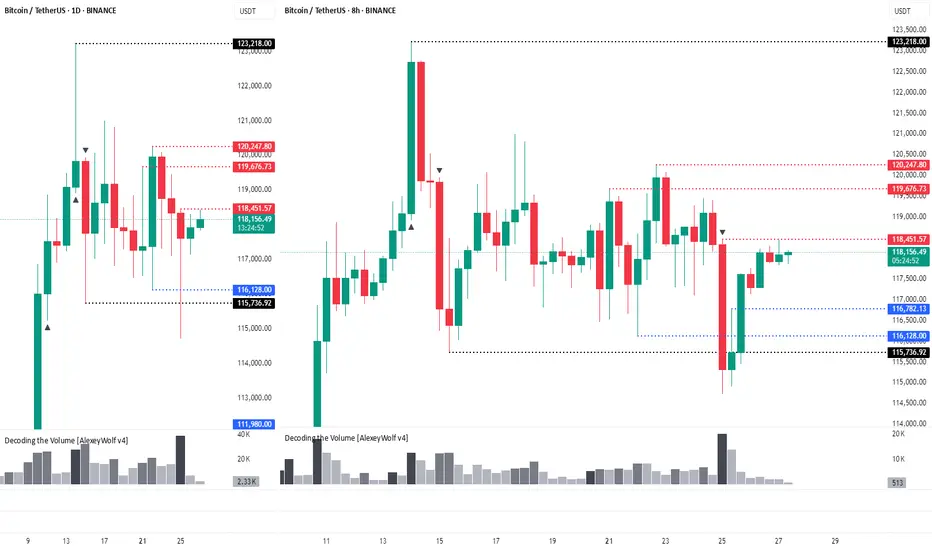
The move is up to the buyersHi traders and investors!
The price has already played out the upper boundary of the scenario, rising above 120,500. Then it also reached the lower boundary by dropping below 115,222.
Now we are at an interest moment: will the price continue to move upward or not?
This situation is clearly visible on the 8-hour timeframe.
On the 8H chart, we see a sideways range, similar to the 1D timeframe. The lower boundary is 115,736 and the upper boundary is 123,218. The active initiative is currently with the buyers, and their target is 120,998 и 123,218.
There is a notable bar attacking the lower boundary (115,736) with very high volume. The high of that bar is 118,451. We’re watching to see whether buyers absorb this bar — that will determine how the next move plays out.
There are three key levels where buyers may step in: 116,782, 116,128, and 115,736. If the price drops to any of these, we can look for a long setup.
Above, we also have three resistance levels from the sellers: 118,451, 119,676, and 120,247. We’ll be watching how sellers react if the price tests these zones.
This analysis is based on the Initiative Analysis concept (IA).
Wishing you profitable trades!
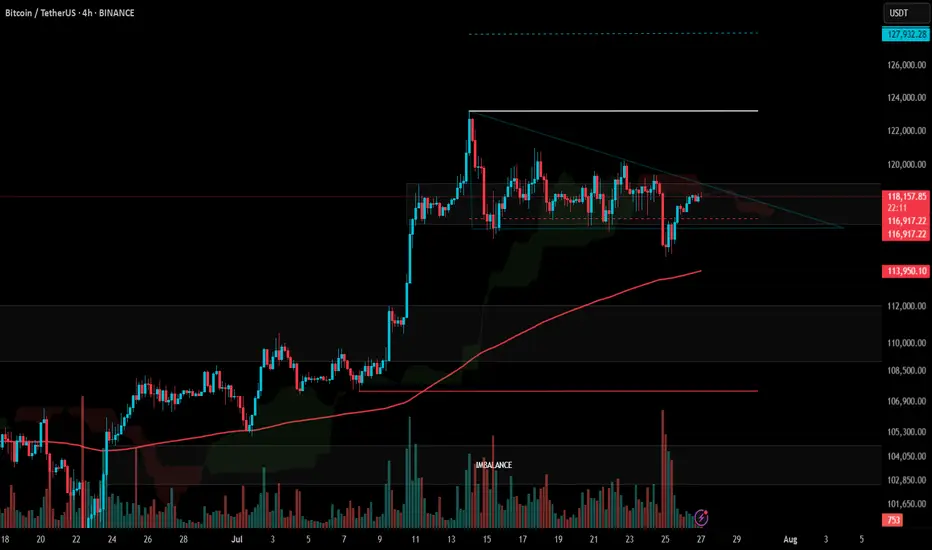
#BTC Update #10 – July 27, 2025#BTC Update #10 – July 27, 2025
Bitcoin continues to move between $116,400 and $118,900, and staying within this range is actually a positive sign, even in bearish scenarios. A decisive close below $114,000, however, could open the door for a deeper and more prolonged correction.
Although BTC hasn’t broken to new highs yet, its ability to hold here means the trend isn’t broken. A strong breakout above $118,900 could lead to a rally toward $123,300 and possibly even $128,000.
🔹 On the 4H chart, BTC seems to have completed its minor correction.
🔹 On the daily chart, the correction remains incomplete – despite dipping to $114,700, the key $112,900 zone hasn’t been tested.
In lower timeframes, BTC remains squeezed within a symmetrical triangle. While it occasionally pokes out, it quickly returns inside — showing indecision.
📌 Direction is unclear at the moment. There’s no strong signal for Long or Short. Waiting for confirmation with volume and a clear breakout is the safer play.
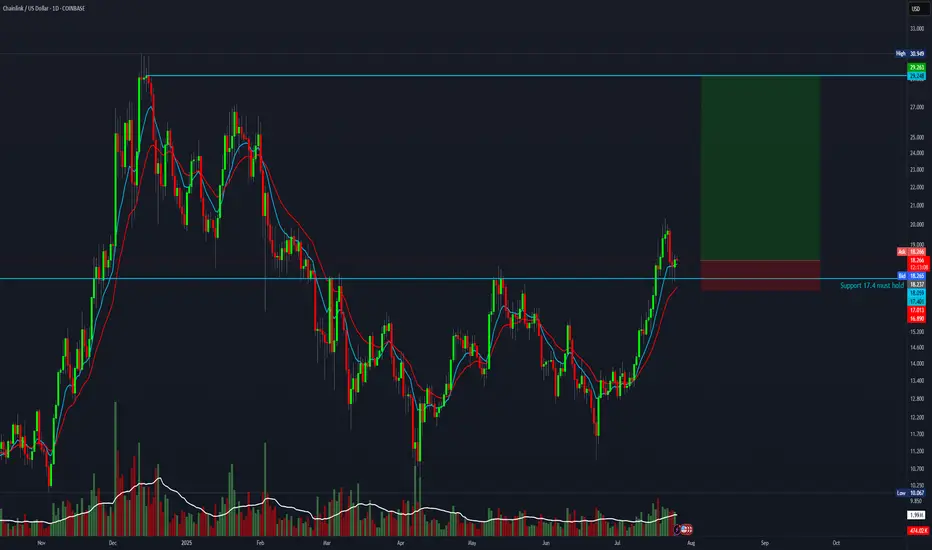
8 R setup for ChainlinkBTC is about to flip upwards. This is the chance to take a high-reward trade with an 8:1 risk-to-reward ratio.
Entry: 18.23
Stop-loss: 16.8
Target: 29
$BTC NEXT WAVE PROGRAMMED!bitcoin will load the next wave after the accumulation process it is in after the parabolic run