Altcoin Season Has Started. And A Quick Look At The Stock MarketHey Traders,
Time for me to catch you up on the latest price action in both the stock market and crypto as well as touch upon a few changes on my platform and subscription services and what I plan for the future.
Timestamps:
00:00 | Housekeeping - site changes, etc
04:35 | BTC Dominance
06:45 | DXY Dollar Chart
10:00 | SPY
14:25 | BTC Bitcoin Chart
15:45 | Bitcoin Liquidity Heatmap
17:30 | Solana
19:05 | Ethereum
20:20 | Crypto & Stock Trackers
24:25 | My Indicator
26:10 | Where I Went Wrong & How I Plan To Course Correct
✌️ Stew
Bitcoin (Cryptocurrency)

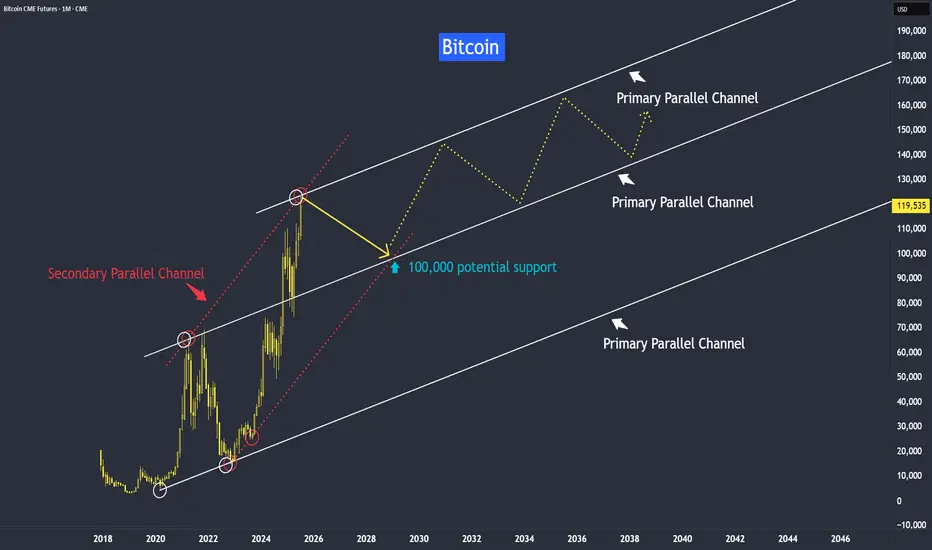
Bitcoin New Support at 100,000Bitcoin’s trend has been growing from strength to strength — and it’s likely to stay that way. Why?
This trend isn’t driven purely by speculation; it’s supported by strong fundamental reasons.
One of the most widely debated topics in finance today is the comparison between Bitcoin and gold. While both are viewed as stores of value, their long-term roles may diverge significantly.
Yes, gold and bitcoin have been moving up in near perfect synchronization with inflation.
Gold is traditionally seen as an inflation hedge, and since June 2022 — when inflation peaked at 9% — we’ve seen both gold and Bitcoin trend higher up to the present day.
Instead of asking why the Fed isn’t cutting interest rates despite the decline in CPI, perhaps we should ask: why the Fed prefers to maintain rates at the current level. What are they seeing with the data and the developments?
When both gold and Bitcoin hold steady at these elevated levels, it suggests that investors still believe the threat of rising inflation remains valid.
In all bull markets, the path is never straightforward — it’s often jagged along with volatility.
What distinguishes a continuing bull market - is the formation of higher lows along its timeline.
However, like gold which we recently discussed, Bitcoin may be approaching a medium-term resistance.
In this first week of this year tutorial, we observed an inverted hammer in the last month of 2024, suggesting a potential correction in Bitcoin, but yet seeing support at around 82,000 level.
As anticipated, the inverted hammer was followed by a correction here toward our support level at around 82,000, with some false breaks along. From that point, the market resumed its upward climb.
Now, it appears to be encountering resistance again.
Still, as long as the market continues to form higher lows, and the threat of rising inflation still remain, the bull trend should remain intact.
This is how the projection might look when mapped with a trendline.
We observed that the primary parallel trendline is reacting in relationship to each other. Next I would like to explore its secondary channel.
Please don’t interpret this as a literal path. Instead, I hope it serves as a guideline to help you form your own projections as the market evolves.
Gold is preferred by older generations, central banks, and conservative investors. Deeply entrenched in traditional finance and cultural value systems.
Cryptocurrency has a rapid adoption by younger investors, tech-native users, and institutions. Millennials and Gen Z are more likely to trust cryptographic assets than governments or fiat systems.
I will keep an open mind to both inflation hedge asset and their instruments.
Its video version for this tutorial:
Disclaimer This analysis is based on technical studies and does not constitute financial advice. Please consult your licensed broker before investing.
Mirco Bitcoin Futures and Options
Ticker: MBT
Minimum fluctuation:
$5.00 per bitcoin = $0.50 per contract
CME Real-time Market Data help identify trading set-ups in real-time and express my market views. If you have futures in your trading portfolio, you can check out on CME Group data plans available that suit your trading needs tradingview.sweetlogin.com
Revsiting $150k - $200k Bitcoin (AND Next Bear Market Bottom)In this video I revisit my 2-year old study showing the potential path for Bitcoin to $150k to $200k and not only how we might get there, but the 11 reasons WHY we can this cycle.
This is the same Fibonacci series that predicted the 2021 cycle high at the 3.618 (Log chart) and used the same way this cycle, with some interesting 2025 forecasts of:
1.618 - $100k
2.618 - $150k
3.618 - $200k
There are quite a few confluences that we get to $150k like the measured moves from both the recent mini bull flag, but also the larger one from earlier this year.
** Also I touch on revisiting my study from 2 years ago where I may have discovered the retracemebnt multiple that correctlty predicted and held the 2022 lowes around $16k. **
It's a VERY interesting number you all will recognize (buy may not agree with).
Let me know what you think.

Bitcoin - Trust the higher timeframe!⚔️Bitcoin ( CRYPTO:BTCUSD ) is still 100% bullish:
🔎Analysis summary:
For the past couple of months we have been seeing an overall consolidation on Bitcoin. But looking at the higher timeframe, Bitcoin remains in an underlying strong bullrun. Consolidations are always expected and no reason to freak out since everything is still bullish.
📝Levels to watch:
$100.000
🙏🏻#LONGTERMVISION
Philip - Swing Trader

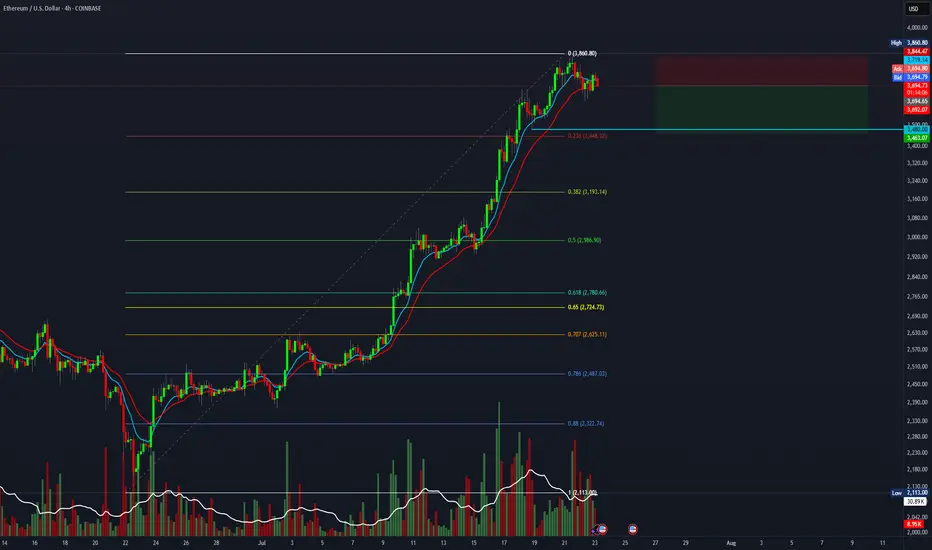
Short swing setup on ETH, targeting 1.5R.It's time for a healthy pullback on ETH. This short setup offers a 1.5:1 risk-to-reward ratio with a target of $3,500.
Entry at $3,725
Stop loss at $3,850
Target at $3,500.
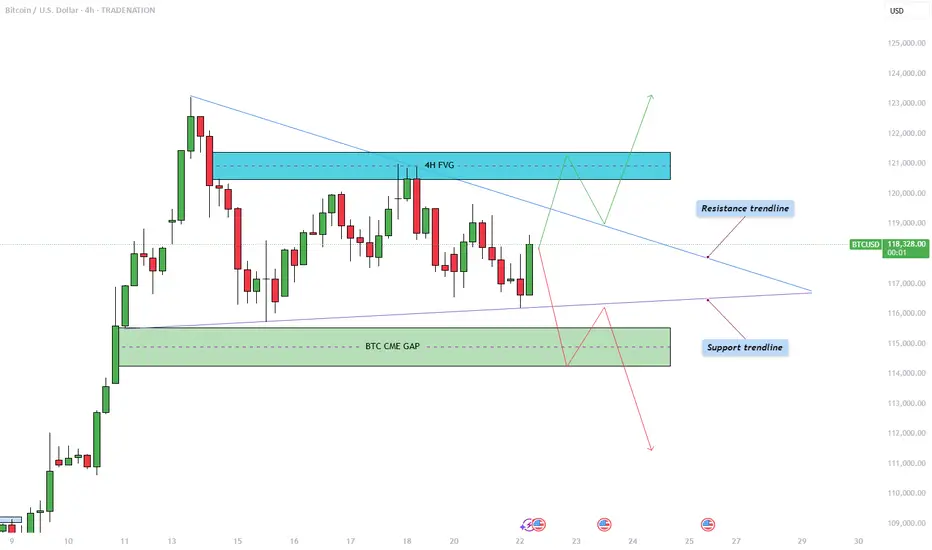
Bitcoin - Triangle pattern consolidation!The Bitcoin price action is currently coiling within a symmetrical triangle pattern on the 4-hour chart, as illustrated in the chart provided. After a significant bullish move earlier this month, BTC has now entered a phase of consolidation, marked by a series of lower highs and higher lows. This has formed a triangle pattern, suggesting an imminent breakout as price nears the apex. The upper boundary of the triangle acts as dynamic resistance, while the rising lower trendline provides firm support. Given the preceding upward momentum leading into this consolidation, the bias slightly favors a breakout to the upside, though the market can always surprise.
Bullish Scenario
In the bullish case, Bitcoin would need to break convincingly above the descending resistance trendline. Should that occur, the next key level to watch lies within the 4-hour bearish Fair Value Gap (FVG) between $120,500 and $121,400. This region represents an area of inefficiency where price moved rapidly in the past, and it is likely to attract selling pressure again. Bulls would ideally aim to reclaim this zone with strong momentum and potentially use it as support in a retest scenario. A successful retest of the triangle’s upper boundary could also trigger a liquidity grab above recent highs, particularly above the all-time high levels.
Bearish Scenario
On the flip side, a bearish breakout would involve BTC breaking below the ascending support trendline. If this happens, the most probable downside target would be the CME gap left behind from two weekends ago, located between $114,300 and $115,500. This price gap occurred due to the discrepancy between Friday’s closing price and Sunday’s opening price on the Chicago Mercantile Exchange, often a magnet for price reversion. After this gap is filled, it is possible that BTC sees a short-term bounce to retest the triangle from below, before potentially continuing lower to address further imbalances in price action.
How to Confirm a Valid Breakout
Trading triangle patterns can be deceptive, as BTC often exhibits false breakouts designed to trap traders on the wrong side. To confirm a valid breakout, it's crucial to observe at least a few 4-hour candles closing decisively above or below the triangle boundaries. Additionally, breakout strength should be accompanied by a noticeable increase in volume. A breakout without volume confirmation is often a sign of a fake move, and entering trades under such conditions can be highly risky.
Final Thoughts
BTC is currently consolidating within this symmetrical triangle formation, signaling a period of indecision and potential volatility ahead. While both bullish and bearish scenarios are plausible, it is essential to wait for clear confirmation before committing to a position. Patience and discipline are key, especially when navigating patterns prone to fake-outs. For now, remaining on the sidelines until a confirmed breakout occurs may be the most prudent strategy.
--------------------------
Disclosure: I am part of Trade Nation's Influencer program and receive a monthly fee for using their TradingView charts in my analysis.
Thanks for your support. If you enjoyed this analysis, make sure to follow me so you don't miss the next one. And if you found it helpful, feel free to drop a like and leave a comment, I’d love to hear your thoughts!
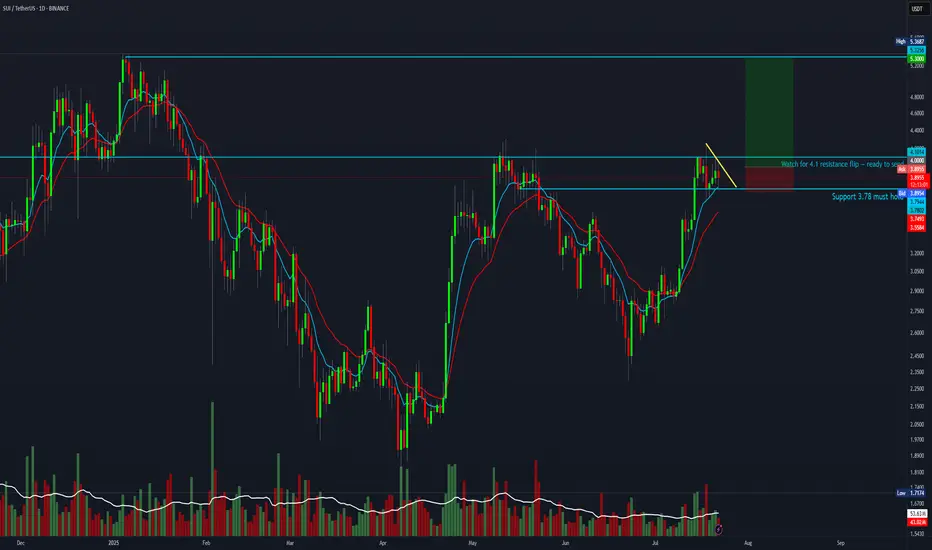
SUI 5R setup forming.SUI looks ready to move. Wait for a breakout above $4 — once it flips the $4.10 resistance, it could fully send toward ATH.
Entry: $4
Stop Loss: $3.70
Target: $5.30
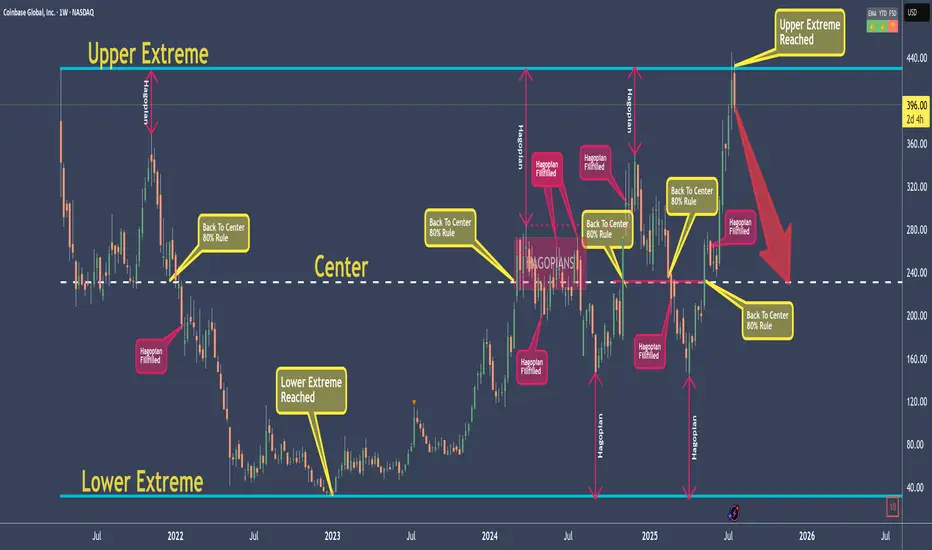
COINBASE - My rules say: Down with high probabilityI don't elaborate too much here, because I want to give you a chance to learn something!
As for the Trade, my rules say that it is a good Short.
The Short is not valid anymore, if price open and close above the Upper Extreme!
So, what are the rules?
Well, that's exactly what you will learn today ;-)
Go to my previous post which I will link, and you find everything you need to jump on the Steam-Train if you like.
As my old Mentors always said: "Larn To Earn"
Happy Profits Guys & Gals §8-)
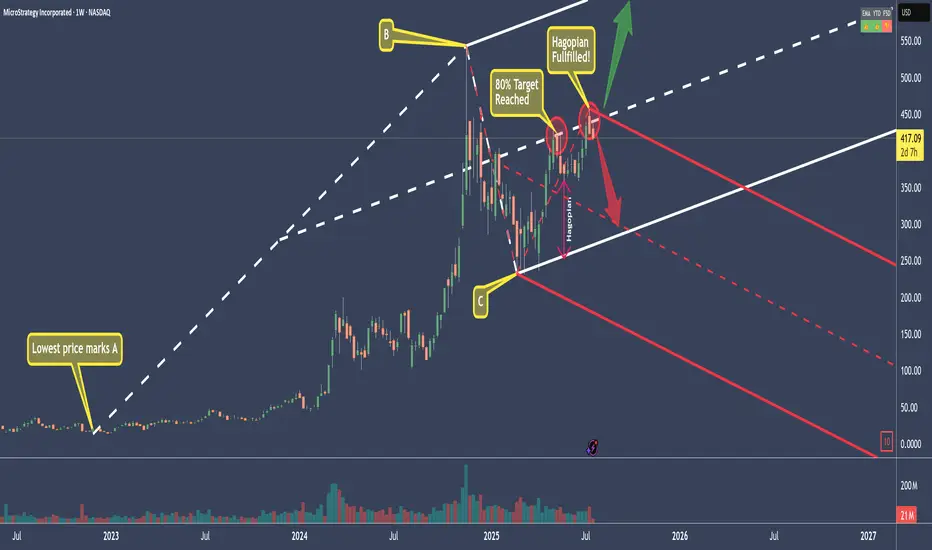
MSTR - Microstrategy Short...for now.The White Fork is created by choosing point A, which must be the lowest price before the swing.
B and C are the natural high and low of the swing we want to measure.
What this gives us is a Pitchfork that projects the most probable path of price.
Additionally, with the three lines that make the Fork, we have the natural extremes above, below, and the center—the mean.
We can see that price started to rise in March 2025.
The 80% rule states that price will reach the Centerline around 80% of the time.
And as we see, it did this time as well. Price reached the CL (Center Line), and immediately the big whales dumped positions.
Then price fell—only to be picked up before reaching the Lower Line, also called the L-MLH or Lower Median Line Parallel.
When price can't make it to this (or any of these) lines, we call this a 'Hagopian,' because it follows 'Hagopian's Rule.' This rule says that if price can't reach 'the line' (the L-MLH in this case), there is a high chance that price will reverse in the previous direction (up in this case), and even go further than where it came from (the Centerline).
And as we see, price indeed traded upwards—beyond where it came from—and overshot the Centerline (CL).
Unfortunately for long-positioned traders, the gas in the goose was empty, and price now starts to head south again, missing the target, which would have been the U-MLH (Upper Median Line Parallel).
So, the open happened below the CL!
If we also see a close this week, I'm ready to initiate a short trade.
Why?
Well, as before, Hagopian’s Rule applies—an indication that price will trade further down than where it came from, which is below $361.
And since we know that the natural target is the Centerline about 80% of the time, we have a heck of a good chance that we’ll be happy campers in a couple of weeks. :-)
With a risk/reward of about 2 to 3, and such a high chance of a profitable trade, I’ll sleep like a baby in the coming weeks.
The trade idea would be cancelled if price closes above the CL this Friday.
Let’s stalk it closely...
TradeCityPro | Bitcoin Daily Analysis #135👋 Welcome to TradeCity Pro!
Let’s move on to the analysis of Bitcoin and major crypto indices. In this analysis, as usual, I’m going to review the futures triggers for the New York session.
⏳ 1-Hour Timeframe
Yesterday, Bitcoin broke the 119,395 level but couldn’t hold above it and has now returned below this level, currently sitting on its previous trendline.
✔️ Today, the market will probably try to form more structure, and I think Bitcoin will range.
⭐ However, if it wants to move, we can enter a long position with the trigger at 120,594.
🔽 For a short position, we can enter if the 116,000 support area breaks.
👑 BTC.D Analysis
Let’s move on to Bitcoin Dominance. Yesterday, dominance had a bullish move, and finally, a support floor managed to prevent further drop in dominance.
🧩 A retracement to 61.20 has occurred. If this retracement continues, the upper levels are 61.53 and 62.
A break of 60.46 will start the next bearish leg.
📅 Total2 Analysis
Let’s go to Total2. This index has formed a range box between 1.48 and 1.55 and is still oscillating within it.
🎲 If 1.55 breaks, we can open a long position, and on the other hand, if 1.48 breaks, the price could correct to lower support levels.
📅 USDT.D Analysis
Let’s move on to Tether Dominance. This index also has a range box and is still moving inside it.
🔑 Breaking 4.13 is very important for the future market trend and could lead to a drop in dominance.
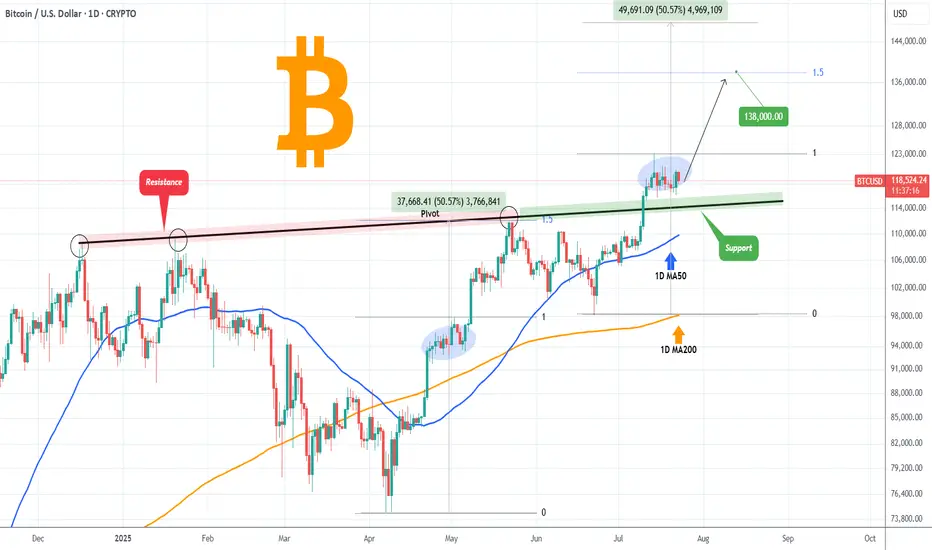
BITCOIN Former Resistance turned Support!Bitcoin (BTCUSD) is consolidating right above the December 17 2024 Pivot trend-line, a level that started off as a massive Resistance delivering two strong rejections but has now been turned into Support, holding this consolidation.
The 1D MA50 (blue trend-line) will soon cross this Pivot trend-line and will confirm it as a Support with the price technically looking for a new Bullish Leg towards the 1.5 Fibonacci extension at least ($138000), similar to the April - May uptrend, which also consisted of an Accumulation Phase much like the current.
Can the Pivot trend-line provide the necessary support for such a rebound? Feel free to let us know in the comments section below!
-------------------------------------------------------------------------------
** Please LIKE 👍, FOLLOW ✅, SHARE 🙌 and COMMENT ✍ if you enjoy this idea! Also share your ideas and charts in the comments section below! This is best way to keep it relevant, support us, keep the content here free and allow the idea to reach as many people as possible. **
-------------------------------------------------------------------------------
💸💸💸💸💸💸
👇 👇 👇 👇 👇 👇
GOLD - Strong Trendline & Golden Pocket ContinuationMarket Context
Gold is currently trading within a rising wedge structure on the 4-hour timeframe. This formation typically represents a tightening market, where buyers continue to push higher — but with decreasing momentum. The confluence of both trendlines and repeated Golden Pocket bounces makes this setup technically rich and worth watching closely.
Golden Pocket & Trendline Confluence
Throughout the recent move up, price has consistently reacted to the 0.618–0.65 Fibonacci retracement zone — often referred to as the Golden Pocket. Each major retracement has found support not only at this zone but also at a rising trendline, showing strong alignment between horizontal and diagonal demand. This dual-layer support has repeatedly led to sharp rebounds, reinforcing the bullish structure.
What Comes Next?
Price is currently sitting just below the upper resistance of the wedge. If history repeats, a retracement toward the lower trendline could be the next logical step. A reaction in the same region — where the Golden Pocket once again overlaps the trendline — could offer a high-probability long opportunity for continuation toward the top of the wedge or even a breakout.
Alternatively, if price breaks below the trendline with conviction, it could signal exhaustion in the current structure, potentially flipping the bias toward a broader correction.
Final Thoughts
This is a textbook example of how technical confluence can guide trade planning — especially in clean, trending environments like this. Remember: patience is key. Let the market come to your levels.
If you enjoyed this breakdown, a like would go a long way — and feel free to share your thoughts or ideas in the comments below!

Altcoin Season May Be Real This TimeBitcoin Dominance Finally Breaks – Altcoin Season May Be Real This Time
Since late 2022, Bitcoin Dominance has been on a steady rise — and during this time, the vast majority of altcoins have bled heavily, losing value both in USD and BTC terms.
The long-awaited “altcoin season” became a meme more than a market event.
Every rally was short-lived, and rotation never truly materialized.
Until now...
________________________________________
📉 A Technical Break That Matters
Looking at the BTC.D chart, we finally see something meaningful:
➡️ A clear technical breakdown under confluence support given by the horizontal one and the rising trend line, which held for months and provided the structure for BTC outperformance.
At the same time, Bitcoin is stable around the 120k zone, and the price action suggests strength — not mania, not collapse — just solid consolidation at high levels, and most probably preparing for new ATHs.
This environment historically tends to be favorable for alts.
________________________________________
USDT Dominance (USDT.D) Also Pointing Lower
The USDT.D chart adds even more confluence to the idea:
• It's now pointing towards support
• The structure suggests there’s room for a further drop, which historically means more money flowing into risk assets — particularly altcoins
When stablecoins dominance drops, it usually reflects increased market participation and risk-on behavior — exactly what altcoins need to finally shine.
________________________________________
🔍 What Am I Doing?
I’ve already started buying selected altcoins and I'm looking to add more on dips.
This technical shift is meaningful. It’s not about catching hype, it’s about recognizing a real potential rotation.
In conclusion, I’ll be looking for strong altcoin setups to buy on pullbacks,
as I believe the next weeks and months could offer the kind of upside that can at least double my investment (yeah, yeah, I'm not "to the mooner, hoping for 100x ).

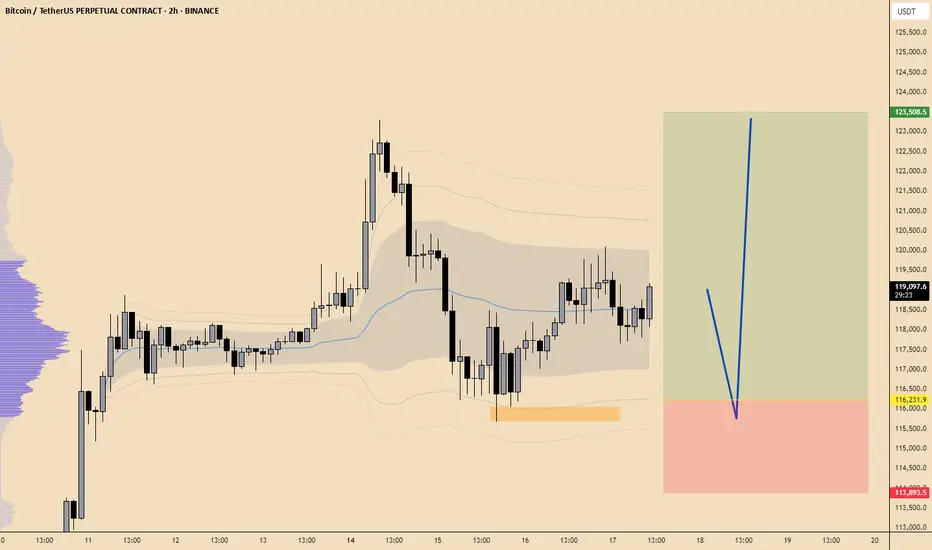
Bitcoin H4 | Crypto to remain elevated?Bitcoin (BTC/USD) is falling towards a multi-swing-low support and could potentially bounce off this level to climb higher.
Buy entry is at 116,242.45 which is a multi-swing-low support.
Stop loss is at 111,600.00 which is a level that lies underneath a pullback support.
Take profit is at 122,734.70 which is a swing-high resistance.
High Risk Investment Warning
Trading Forex/CFDs on margin carries a high level of risk and may not be suitable for all investors. Leverage can work against you.
Stratos Markets Limited (tradu.com ):
CFDs are complex instruments and come with a high risk of losing money rapidly due to leverage. 66% of retail investor accounts lose money when trading CFDs with this provider. You should consider whether you understand how CFDs work and whether you can afford to take the high risk of losing your money.
Stratos Europe Ltd (tradu.com ):
CFDs are complex instruments and come with a high risk of losing money rapidly due to leverage. 66% of retail investor accounts lose money when trading CFDs with this provider. You should consider whether you understand how CFDs work and whether you can afford to take the high risk of losing your money.
Stratos Global LLC (tradu.com ):
Losses can exceed deposits.
Please be advised that the information presented on TradingView is provided to Tradu (‘Company’, ‘we’) by a third-party provider (‘TFA Global Pte Ltd’). Please be reminded that you are solely responsible for the trading decisions on your account. There is a very high degree of risk involved in trading. Any information and/or content is intended entirely for research, educational and informational purposes only and does not constitute investment or consultation advice or investment strategy. The information is not tailored to the investment needs of any specific person and therefore does not involve a consideration of any of the investment objectives, financial situation or needs of any viewer that may receive it. Kindly also note that past performance is not a reliable indicator of future results. Actual results may differ materially from those anticipated in forward-looking or past performance statements. We assume no liability as to the accuracy or completeness of any of the information and/or content provided herein and the Company cannot be held responsible for any omission, mistake nor for any loss or damage including without limitation to any loss of profit which may arise from reliance on any information supplied by TFA Global Pte Ltd.
The speaker(s) is neither an employee, agent nor representative of Tradu and is therefore acting independently. The opinions given are their own, constitute general market commentary, and do not constitute the opinion or advice of Tradu or any form of personal or investment advice. Tradu neither endorses nor guarantees offerings of third-party speakers, nor is Tradu responsible for the content, veracity or opinions of third-party speakers, presenters or participants.

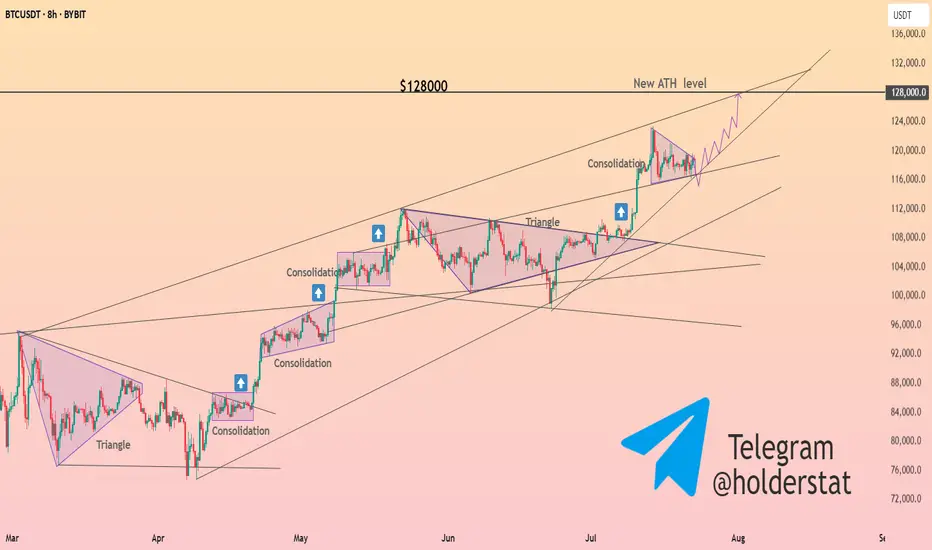
HolderStat┆BTCUSD consolidatedBINANCE:BTCUSDT is consolidating between $129K and $137K. Breakout above $137K could lead to new highs. Key support remains at $125K.
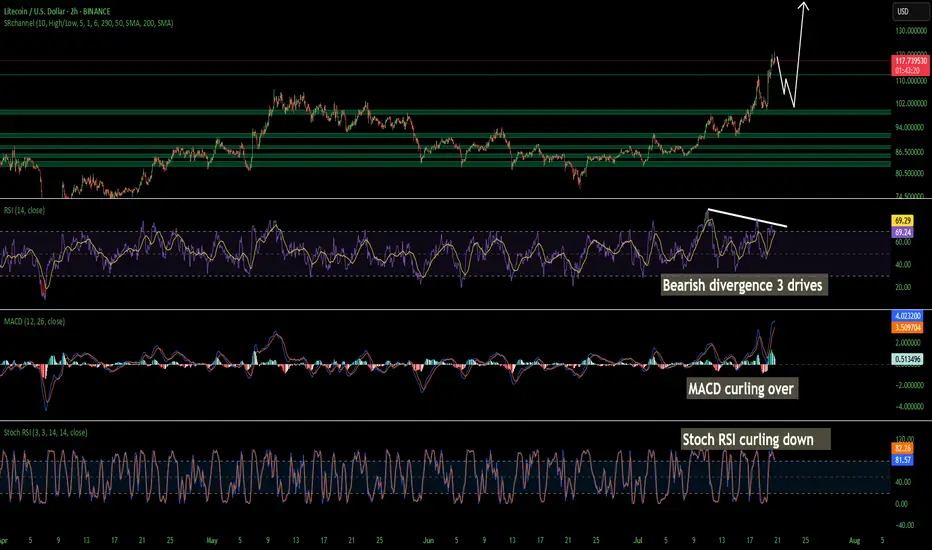
LTC Litecoin Short Term Pull Back Quick and SharpI believe Litecoin Is topping out on the 2 hour. Looks like we may come back down and tap support at around 104 but I wouldn't be surprised a wick hits 100. I have buy orders around 103-106. I am not super confident on a deeper pullback so thats why my buys are there is so i don't miss the dip. Id rather make a little less money than miss a buy in trying to nail the bottom. Litecoin is starting its breakout from a 7 year consolidation and accumulation phase. This should be pretty massive. Litecoin is going to benefit considerably from these new bills that are being signed and many of the favorites in the top 100 will soon disappear!
The time for Litecoin to shine as I have been talking about for years is now. I am almost certain that this is that time. My predictions all still hold if you would like to go read them. I was just off on timing. Timing is the hardest thing to predict especially with how wild this planet has been lately. None of this is financial advice its just my opinion.
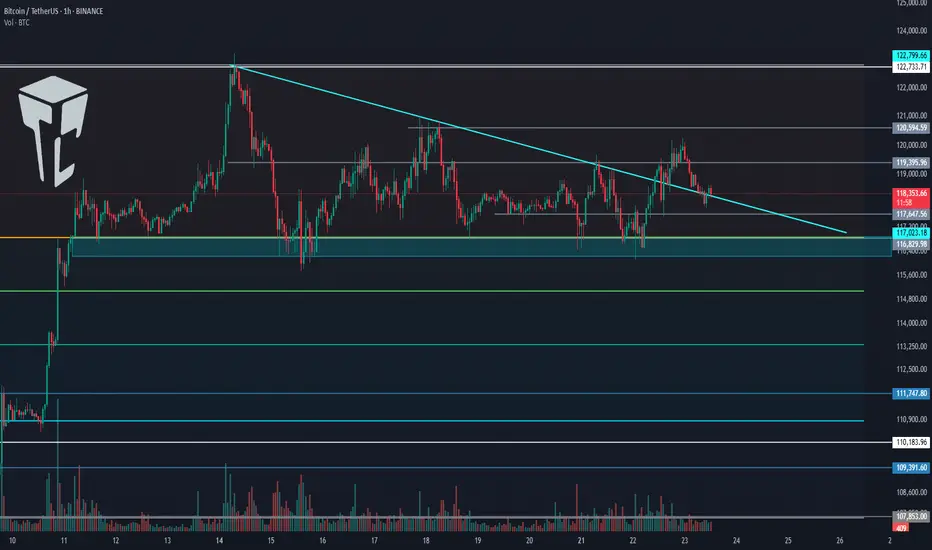
TradeCityPro | Bitcoin Daily Analysis #134👋 Welcome to TradeCity Pro!
Let’s dive into the Bitcoin analysis and key crypto indices. As usual, in this analysis I will review the New York futures session triggers for you.
⏳ 1-Hour Timeframe
On the 1-hour timeframe, Bitcoin has formed a range box between 116829 and 119395. Yesterday, after getting supported at 116829, it climbed back to the top at 119395.
📊 As you can see, buying volume has increased, which indicates strong buyer momentum.
📈 If 119395 is broken, the price could move toward higher targets like 120594 and 122733.
🧩 This 119395 area is also the breakout trigger of the descending triangle. The bottom at 116829 has supported the price multiple times, and now with the descending trendline being broken, price could aim for higher resistance levels.
👑 BTC.D Analysis
Let’s move on to Bitcoin Dominance. BTC Dominance has been supported at 60.46, which is why Bitcoin is moving upward, while altcoins are dropping.
🎲 The dominance trend is still clearly bearish, and if 60.46 breaks, the next downward leg may begin.
📅 Total2 Analysis
Let’s look at Total2. This index has also formed a range between 1.48 and 1.55, and it is currently sitting at the bottom of the box.
🔔 If we get confirmation of support at 1.48, we can consider entering a long position. The main long trigger would be the break of 1.55.
📅 USDT.D Analysis
This index has also formed a range box. The previous support level was 4.08, which has now shifted to 4.13.
💥 The top of the box is 4.25. Given the bearish momentum in dominance, the probability of 4.13 breaking is higher.
🎲 So keep a close eye on altcoins in the coming days, because a lot of capital is flowing into them and they could see significant pumps.
❌ Disclaimer ❌
Trading futures is highly risky and dangerous. If you're not an expert, these triggers may not be suitable for you. You should first learn risk and capital management. You can also use the educational content from this channel.
Finally, these triggers reflect my personal opinions on price action, and the market may move completely against this analysis. So, do your own research before opening any position.
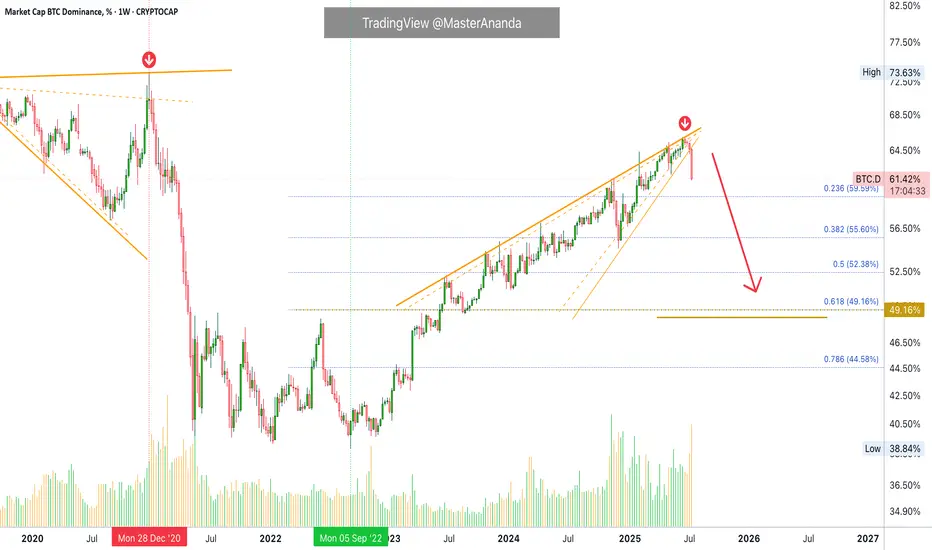
Bitcoin Dominance Weekly · Highest Bearish Volume in YearsThis week Bitcoin Dominance Index is producing the highest bearish volume session since February 2021. More than 4.5 years.
This week we have the strongest bearish action since June 2022. We can say that the altcoins market bull market is not only fully confirmed but already underway. We are already experiencing the best altcoin season since 2021 but it is still early, this is only the start.
Bitcoin Dominance is set to produce the strongest drop in many years and this only happens when the altcoins go ultra-bullish.
Bitcoin is moving sideways right now near resistance. As Bitcoin does this, the altcoins continue to move forward. This is classic bull market dynamics. When Bitcoin consolidates at a high price, the altcoins tend to explode. You can expect this pattern to continue to repeat for months to come. There is more good news though.
The fact that the altcoins are growing, perfect examples right now are Ethereum and Litecoin, is a bullish signal for Bitcoin.
It is not like the altcoins will grow and then Bitcoin will drop, no. Bitcoin consolidates and the altcoins grow, when Bitcoin stops consolidating it will move forward and hit a new major high, that is a price just around $134,000 and $136,000. When Bitcoin hits this price the altcoins continue to grow, back and forth. This is the most bullish the market has been since 2021. We will have to wait and see where this will all lead but new all-time highs are expected across all major projects and then some. Bitcoin is already in new all-time high territory but we need a new all-time high on Solana, Litecoin, Ethereum, Cardano, and so on. XRP is already at a new all-time high but it has much more to give.
If you visit @MasterAnanda, you will find up-to-date analyses for all these altcoins with new updated not conservative but realistic and good optimistic targets.
I will continue to share updates throughout the entire bull market. This is only the start. Get ready because the best is yet to come.
Namaste.
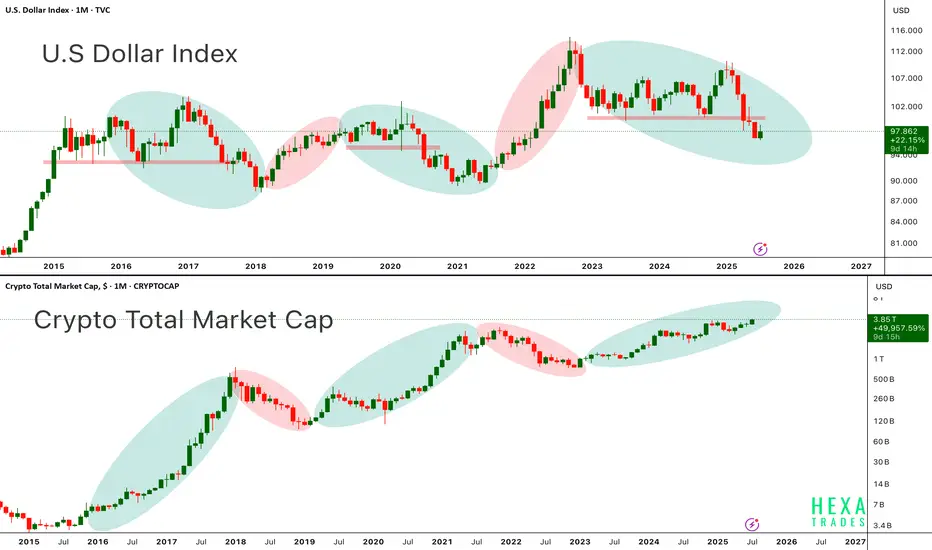
DXY vs. CryptoAbove chart highlights the long standing inverse correlation between the U.S. Dollar Index and the Crypto Total Market Cap a relationship that has guided the macro trend for Bitcoin and altcoins since 2015.
in the first chart, When the dollar weakens (green ovals), crypto tends to rally. When the dollar strengthens (red ovals), crypto markets usually experience corrections or prolonged bear markets.
In the second chart, each period of dollar weakness aligns almost perfectly with explosive crypto upside seen in 2017, 2020–2021, and now potentially again in late 2024 through 2025. Conversely, periods of DXY strength (2018, 2022) coincide with crypto market downturns.
Currently, DXY is entering a downward phase, while the crypto total market cap is pushing higher, now above $3.8 trillion suggesting that a new leg in the crypto bull cycle may be underway. Bitcoin and Ethereum have historically performed best when DXY trends lower, as liquidity shifts into risk-on assets.
Key Points:
-DXY and crypto market cap show a strong inverse macro relationship.
-DXY in a clear downtrend from 2024 highs supportive of further crypto upside.
-Crypto Total Market Cap approaching all-time highs suggesting broad market strength.
-Potential for BTC > $150K and ETH > $6K+ if this macro divergence continues.
-This setup resembles early 2020, right before the massive crypto bull run.
If the dollar continues to weaken structurally, crypto markets led by Bitcoin and Ethereum could see accelerated momentum, pushing into parabolic territory by late 2025.
Cheers
Hexa🧘♀️
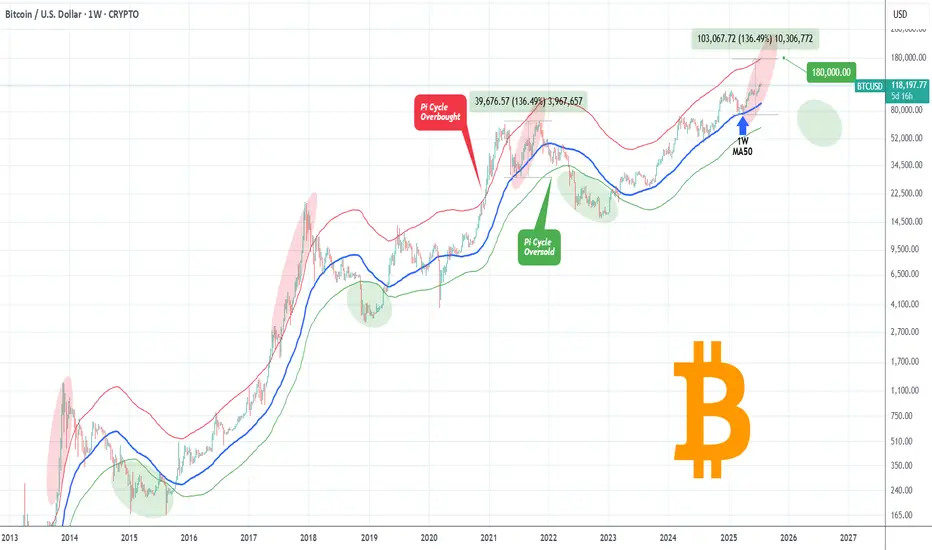
BITCOIN Isn't even overbought yet!Bitcoin (BTCUSD) has been rising strongly within a structured Channel Up pattern but even this consistent and steady uptrend since the April 07 2025 rebound on the 1W MA50 (blue trend-line) hasn't been enough to touch the Pi Cycle's overbought trend-line (red).
Throughout BTC's historic Cycles, all Tops have been priced after the overbought level was breached, which currently sits around $180000 (and rising). Given that the 4-year Cycle Theory won't change, even a repeat of the 'weaker' +136.49% last rally of the previous Cycle (Jun-Nov 2021), would take us to $180k exactly but still will be below the overbought trend-line. This just shows the immense upside potential of the market even at the current stages.
So do you think we will get that kind of rally? Feel free to let us know in the comments section below!
-------------------------------------------------------------------------------
** Please LIKE 👍, FOLLOW ✅, SHARE 🙌 and COMMENT ✍ if you enjoy this idea! Also share your ideas and charts in the comments section below! This is best way to keep it relevant, support us, keep the content here free and allow the idea to reach as many people as possible. **
-------------------------------------------------------------------------------
💸💸💸💸💸💸
👇 👇 👇 👇 👇 👇
Will cryptos lose their appeal, as more regulation comes in?In this new world, where governments and financial institutions are getting more and more interested in cryptos, will those start losing their appeal?
Let's take a look at CRYPTO:BTCUSD
MARKETSCOM:BITCOIN
CRYPTO:ETHUSD
MARKETSCOM:RIPPLE
Let us know what you think in the comments below.
Thank you.
75.2% of retail investor accounts lose money when trading CFDs with this provider. You should consider whether you understand how CFDs work and whether you can afford to take the high risk of losing your money. Past performance is not necessarily indicative of future results. The value of investments may fall as well as rise and the investor may not get back the amount initially invested. This content is not intended for nor applicable to residents of the UK. Cryptocurrency CFDs and spread bets are restricted in the UK for all retail clients.

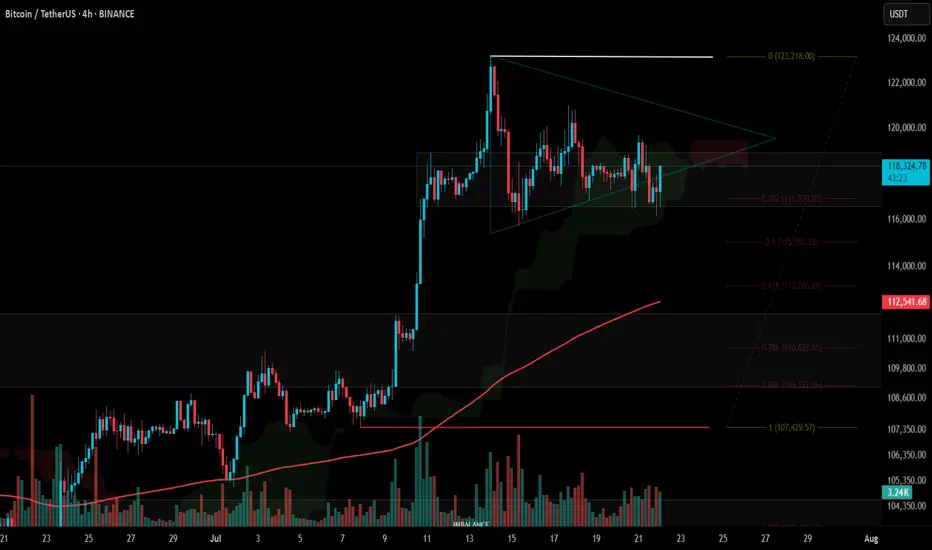
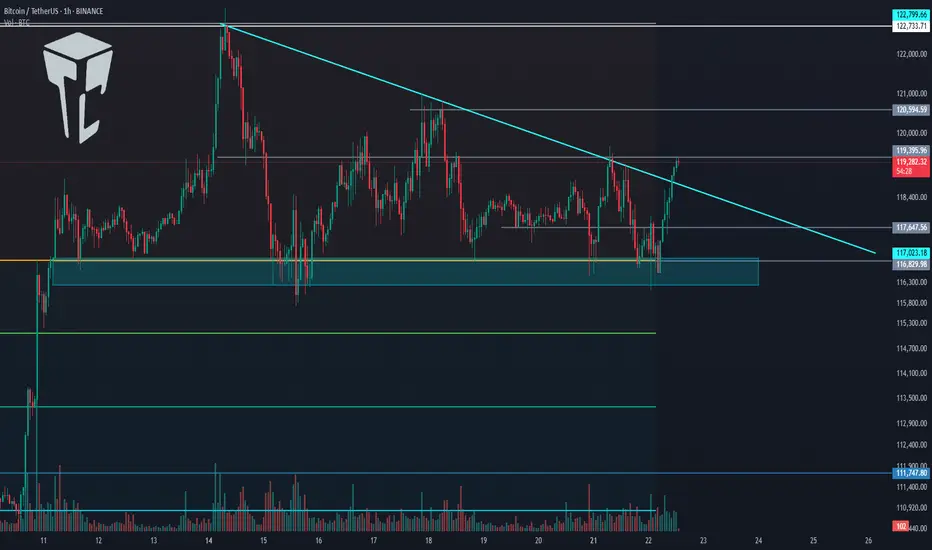
#BTC Update #9 – July 22, 2025#BTC Update #9 – July 22, 2025
As previously noted, Bitcoin is currently trading within both a horizontal range (box) and a tightening triangle formation. Although there was a drop last night, price didn’t pierce the lower boundary of the box and is now showing an upward reaction.
As long as BTC holds above this box, there’s no major risk. Bitcoin has already completed the 0.382 Fibonacci retracement from its previous impulsive move. If that correction is sufficient, the next upside target is $127,900.
However, one key point to watch: Bitcoin failed to break its previous high in its last three attempts — a clear sign of price compression and market indecision.
📌 No need to rush into Long or Short positions. It’s best to wait for a confirmed breakout before acting, as premature entries could carry elevated risk.