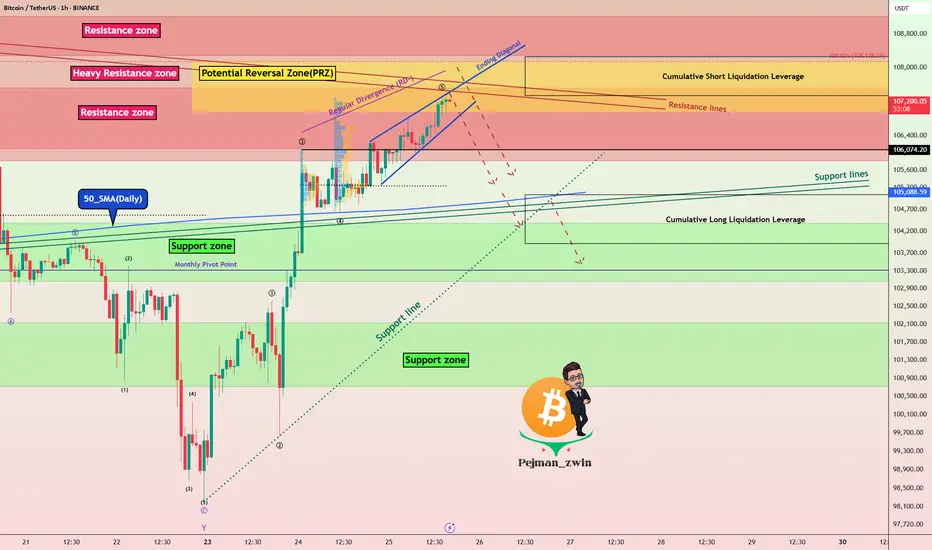
Bitcoin Reaches PRZ with Bearish Signals — Is a Drop Imminent?Bitcoin ( BINANCE:BTCUSDT ) has reached the Potential Reversal Zone(PRZ) as I expected in yesterday's post .
Bitcoin is trading in the Heavy Resistance zone($110,720-$105,820) , Potential Reversal Zone(PRZ) , and near the Resistance lines .
In terms of Elliott Wave theory , it seems that Bitcoin has managed to complete the main wave 5 with the help of the Ending Diagonal . The structure of wave 5 can be different.
Also, we can see the Regular Divergence(RD-) between Consecutive Peaks.
I expect Bitcoin to drop to at least $105,400 .
Cumulative Short Liquidation Leverage: $107,334-$108,250
Cumulative Long Liquidation Leverage: $105,037-$103,392
Note: We could be in for a bit of excitement in the financial markets during Federal Reserve Chairman Powell's speech.
Note: Stop Loss(SL)= $109,020 = We can expect more pumps.
Please respect each other's ideas and express them politely if you agree or disagree.
Bitcoin Analyze (BTCUSDT), 1-hour time frame.
Be sure to follow the updated ideas.
Do not forget to put a Stop loss for your positions (For every position you want to open).
Please follow your strategy and updates; this is just my Idea, and I will gladly see your ideas in this post.
Please do not forget the ✅' like '✅ button 🙏😊 & Share it with your friends; thanks, and Trade safe.
Bitcoinanalysis
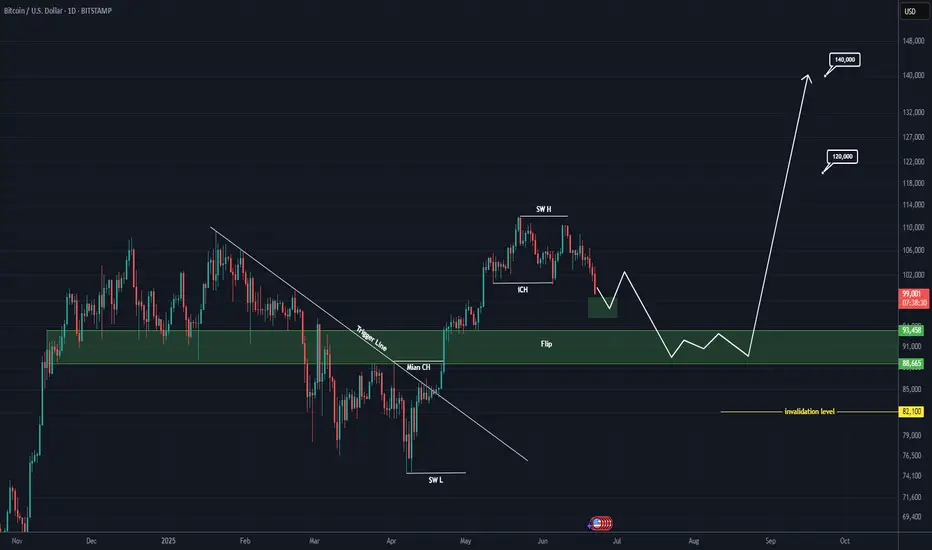
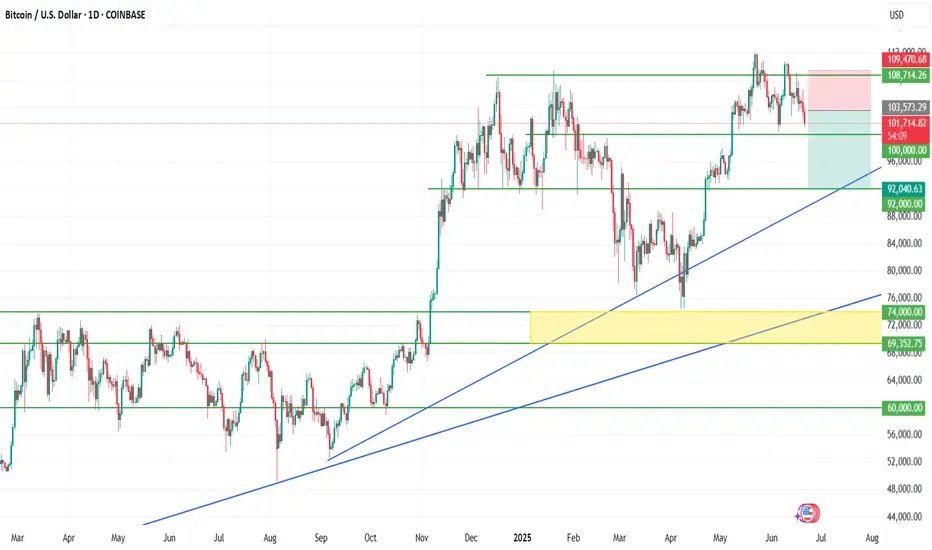
Bitcoin is gearing up for 120K and 140K (1D)The flip zone has been reclaimed, but no proper pullback had occurred. The recent pullback came with a sweep of the all-time high (ATH), which has caused confusion and uncertainty among market participants.
In fact, this drop can be interpreted as a pullback to the flip zone, accompanied by an ATH hunt.
We expect the price, after touching the green zone and forming a base around this level, to move toward the targets of 120K and 140K — which we currently consider as Bitcoin’s final targets for this cycle.
A weekly candle close below the invalidation level would invalidate this analysis.
For risk management, please don't forget stop loss and capital management
When we reach the first target, save some profit and then change the stop to entry
Comment if you have any questions
Thank You
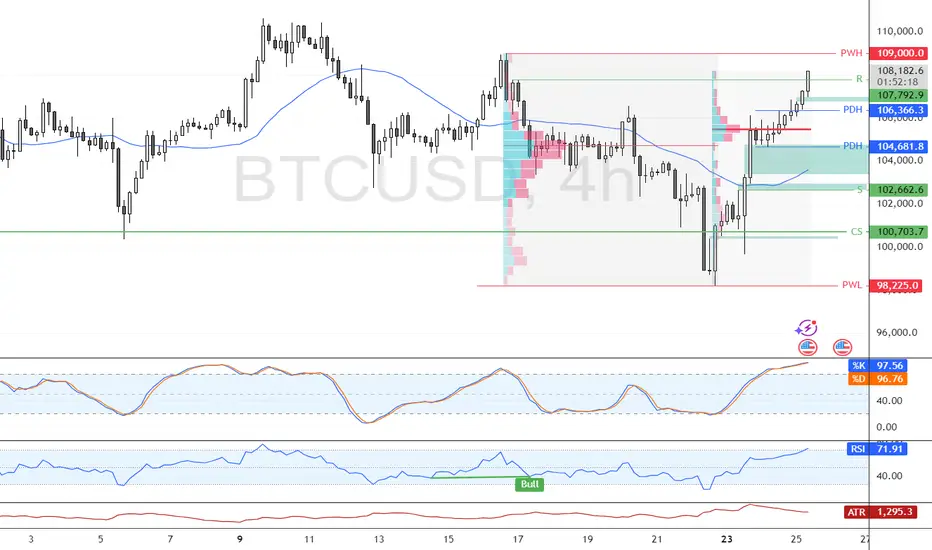
Bitcoin Climbs Above $107K with Overbought Signals in PlayBitcoin closed above the 107,792 resistance after breaking the previous day's high. RSI and Stochastic indicators show overbought conditions, signaling short-term overpricing.
BTC may test the $109,000.00 resistance next, followed by a potential pullback toward $104,618.00, offering a favorable entry point for bulls.
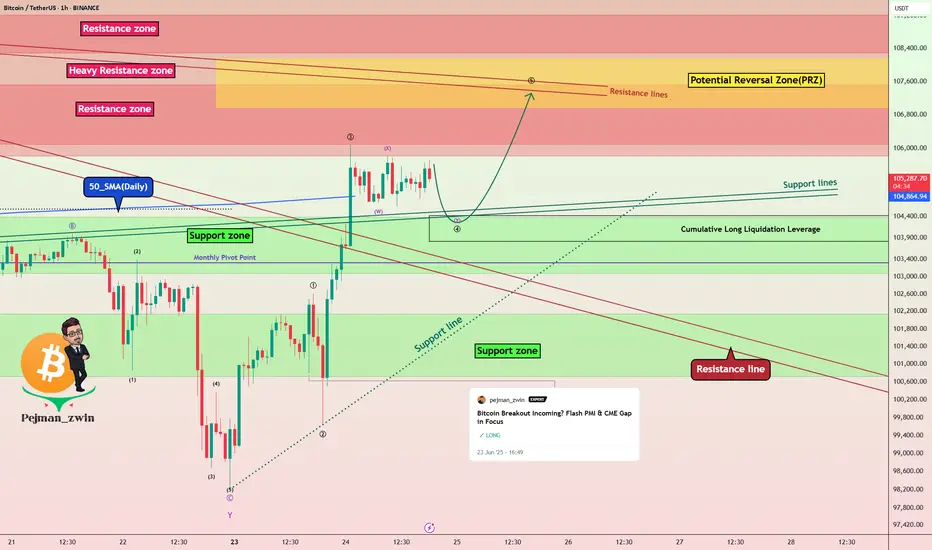
Bitcoin Roadmap: Key Levels to WatchBitcoin( BINANCE:BTCUSDT ) managed to pump as I expected yesterday , of course, the main catalyst could have been the ceasefire announcement between Iran and Israel , which had a major impact on high and medium risk assets in the financial markets .
Bitcoin is once again moving near the Heavy Resistance zone($110,720-$105,820) and the Resistance zone($107,520-$106,100) after breaking the Resistance lines .
In terms of Elliott Wave theory , it seems that given Bitcoin’s bullish momentum , Bitcoin has completed the main wave 3 and is currently completing the main wave 4 on the 1-hour time frame . The corrective wave structure of wave 4 could be a Double Three Correction(WXY) .
I expect Bitcoin to start rising again near the Support zone($104,380-$103,060) , 50_SMA(Daily) , Support lines , and Cumulative Long Liquidation Leverage($104,412-$103,812) to rise at least to the Potential Reversal Zone(PRZ) and Resistance lines .
Note: Stop Loss(SL)= $102,600 = We can expect more dumps.
Please respect each other's ideas and express them politely if you agree or disagree.
Bitcoin Analyze (BTCUSDT), 1-hour time frame.
Be sure to follow the updated ideas.
Do not forget to put a Stop loss for your positions (For every position you want to open).
Please follow your strategy and updates; this is just my Idea, and I will gladly see your ideas in this post.
Please do not forget the ✅' like '✅ button 🙏😊 & Share it with your friends; thanks, and Trade safe.
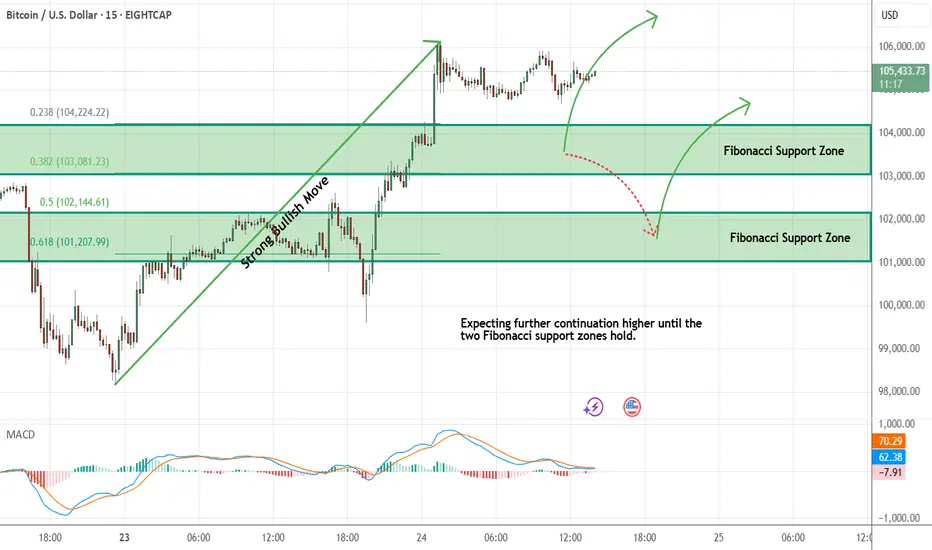
Bitcoin - Looking To Buy Pullbacks In The Short TermM15 - Strong bullish move.
No opposite signs.
Currently it looks like a pullback is happening.
Expecting further continuation higher until the two Fibonacci support zones hold.
If you enjoy this idea, don’t forget to LIKE 👍, FOLLOW ✅, SHARE 🙌, and COMMENT ✍! Drop your thoughts and charts below to keep the discussion going. Your support helps keep this content free and reach more people! 🚀
--------------------------------------------------------------------------------------------------------------------
Bitcoin Rebounds Above $105K After Liquidity SweepFenzoFx—Bitcoin swept liquidity below $100,703.0 and rebounded to around $105,400.0, just above the volume profile point of interest.
Immediate resistance lies at $106,135.0. A break above this level could lead to a retest of $107,702.0. However, if resistance holds, BTC may consolidate toward $102,662.0, supported by Stochastic overbought signals.

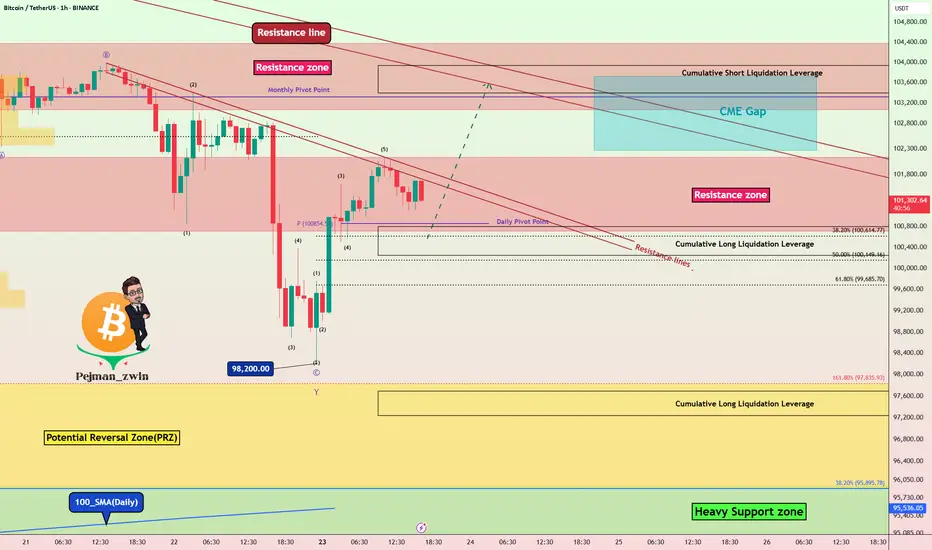
Bitcoin Breakout Incoming? Flash PMI & CME Gap in FocusBitcoin ( BINANCE:BTCUSDT ) started to fall ( about -4%) after the news that the US was involved in the Middle East tension , but it has risen again with good momentum .
Do you think Bitcoin will go below the previous bottom($98,200) again on the 1-hour time frame?
Bitcoin is trading in the Resistance zonezone($102,130-$100,700) and near the Resistance lines .
In terms of Elliott Wave theory , it appears that a Double Three Correction(WXY) has been completed near the Potential Reversal Zone(PRZ) . Also, the first 5 microwaves of the Impulsive have now been completed .
---------------------------------
Bitcoin traders should monitor today’s Flash Manufacturing (expected 51.1) and Services PMI (expected 52.9) . Both forecasts are already lower than last month’s figures (51.3 and 54.8) , but I see a chance they come in even weaker.
Why weaker PMI is likely?
Slowing retail sales and softer labor data point to reduced consumer demand.
High interest rates are starting to pressure both the production and services sectors.
Regional Fed surveys already showed a cooling in business activity.
If the PMI prints below expectations, the market may anticipate a more dovish Fed, pushing the dollar( TVC:DXY ) down and giving Bitcoin a potential bullish boost.
---------------------------------
I expect Bitcoin to move towards filling the CME Gap($103,730-$102,275) after breaking the Resistance lines , and if the Resistance zone($104,380-$103,060) is broken, we should expect further increases.
Cumulative Short Liquidation Leverage: $103,391-$103,934
Cumulative Long Liquidation Leverage: $100,800-$100,250
Cumulative Long Liquidation Leverage: $97,691-$97,241
Note: Increased tensions in the Middle East or new and important news surrounding this news can make the analysis invalid, so be more careful with capital management.
Note: If Bitcoin can touch $98,170 , we can expect more dumps.
Please respect each other's ideas and express them politely if you agree or disagree.
Bitcoin Analyze (BTCUSDT), 1-hour time frame.
Be sure to follow the updated ideas.
Do not forget to put a Stop loss for your positions (For every position you want to open).
Please follow your strategy and updates; this is just my Idea, and I will gladly see your ideas in this post.
Please do not forget the ✅' like '✅ button 🙏😊 & Share it with your friends; thanks, and Trade safe.
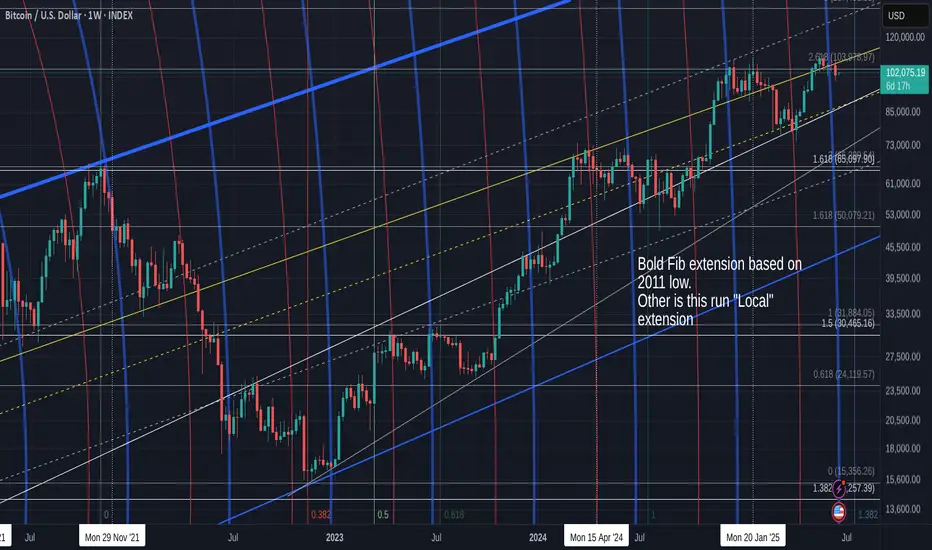
Bitcoin Closed week RED and opens Green but is back in channel
As the title says, BTC PA has fallen back in channel that offers a potential low in the High 80K should confidence fail.
PA also lost support on the Local 2.618 Fib extension.
This is a shame and poses potential problems reclaiming that.
I will say, that I do not consider this a long term Bearish beginning but it could certainly add to the "Calm" Summer I have talked about.
I say "Calm", that does depend on the world not entering a level of Madness.
The Zoomed chart below shows more detail
Here we can see clearly how PA got rejected off that upper trend line, fell through the 2.618 and is currently being rejected by it.
The potential for a further drop does exist and if we repeat the "Pattern" we have since the beginning of 2024, of bounce off Lower trend line, get rejected from Upper zone, re test lower as support and bounce again, we can expect to revisit 89K
This idea is supported from this LINEAR Daily chart
The dashed Trend line that is arrowed has origin in Sep 2024 and was also used again in April 2025.
That intersection the arrow points to is the intersection with the current supporting Fib circle at around 88500 USD
None of this is certain but these levels exist as support.
PA also has the ability to move higher
The Weekly MACD below shows us how MACD is turning down towards its signal line ( red)
We did this before in Jan 2024 ( Arrow) and The MACD bounced.
We talked about this possibility a few weeks ago But on a Daily MACD, things do look a little different.
The FEB 2024 looked like this, Bullish, rising and above Neutral
Currently, the Daily MACD looks like this
We just fell below Neutral and the Signal line just hit it
We may seea bounce but we need to have the idea that this may continue to drop a little further.
But the White bar on the Histogram shows us some recovery is currently in progress
We will have to watch the rest of this month closely. This time next week is last day of month.
I have mentioned a number of times that a small RED Month candle would be potentialy good.
We are currently Only just GREEN, so a further Drop in price is actually almost expected this week.
Interesting days ahead
Quick BITCOIN update 98K incomingWe talked about this possibility on Friday and now it seems to be happening
We have support and we will hopefully Hold on that Fib extensiona nd risong line pf support.
The madness in the world right now , however, may decide to try and crash markets
If you decide to sell out, AVOID THE $
Me , I will remain Holding for a while longer

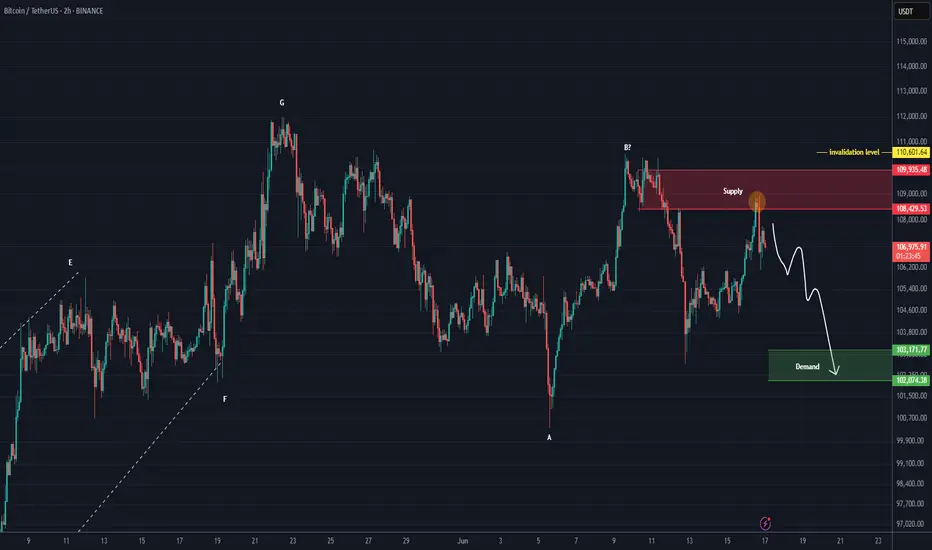
BTC is still bearish (2H)This analysis is an update of the analysis you see in the "Related publications" section
The red zone seems to have had enough orders to reject the price downward. It is expected that the price will drop at least to the green zone below.
There will be some fluctuations along the way.
A daily candle closing above the invalidation level would invalidate this analysis.
For risk management, please don't forget stop loss and capital management
Comment if you have any questions
Thank You
BTC posibility if fundamental favoursBTC posibility if fundamental favours.
This baby has beenrushing downhill for afew days now.
As always, my thoughts are on the chart.
Please trade this RR of 1:1.69 with care
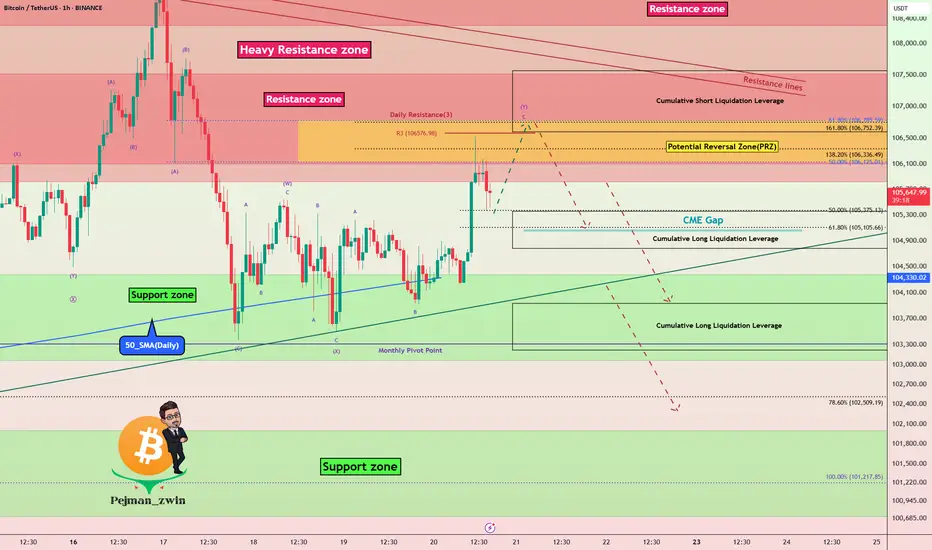
Bitcoin Hits PRZ — Is This the Perfect Short Entry?Bitcoin ( BINANCE:BTCUSDT ) has entered the Potential Reversal Zone (PRZ) after a strong bullish impulse , testing the confluence of Daily Resistance(3) .
In terms of Elliott Wave analysis , the market seems to have completed a complex WXY corrective structure , with the recent rally likely representing the final wave Y . This makes the current zone highly reactive for potential reversal .
I expect Bitcoin to retrace toward the CME Gap($105,075-$105,055) and possibly continue downward toward the Support zone($104,380-$103,060) and Cumulative Long Liquidation levels if the sellers regain momentum .
Cumulative Short Liquidation Leverage: $107,568-$106,601
Cumulative Long Liquidation Leverage: $105,360-$104,784
Cumulative Long Liquidation Leverage: $103,937-$103,217
Note: It is better to look for short positions at the Potential Reversal Zone (PRZ) or if Bitcoin touches $104,780 before reaching PRZ. That is why I chose to label this analysis as ''Short".
Note: If Bitcoin can touch $107,620 , there is a possibility of breaking the resistance lines and increasing further.
Please respect each other's ideas and express them politely if you agree or disagree.
Bitcoin Analyze (BTCUSDT), 1-hour time frame.
Be sure to follow the updated ideas.
Do not forget to put a Stop loss for your positions (For every position you want to open).
Please follow your strategy and updates; this is just my Idea, and I will gladly see your ideas in this post.
Please do not forget the ✅' like '✅ button 🙏😊 & Share it with your friends; thanks, and Trade safe.
Bitcoin Daily, Something for the weekend Sir / Madame ?This will be the main chart and 3 indicators that could be telling us something.
Main chart is the Heiken Ashi. Each candle starts in the centre of the previous one and so we get rid of noise and get a good understanding of possible Trends.
And Right now, CALM is not the word ! Candles are getting smaller and smaller.
However, we do seem to be forming a bullish pennant with an Apex at the end of the month.
PA always reacts before the Apex.
Other things to note here is that we are now using the previous line of resistance as support. Look back to Dec 2024 to Feb 2025. It was this line that put as back down to 75K
We have tested this 4 times in a small way But not in a real Meaningful Way yet.
Do remain Cautious.......but that 2.518 Fib extension should hold us in place if we drop but there could be a much deeper drop.
But lets take this step by step as there are some Very Bullish signs to.
The ADX chart below shows us that Change is near.
Remember, ADX ( yellow ) NEVER shows trend direction, just trend strength. As you can see, it rarely drops much further below this point and does not spend to long here.
SO, current trend is Weak and a new trend is likely in the near future ( this could be tomorrow or in 3 weeks..near future is a wide window..but it is not 2 months or more)
The DI + ( orange ), positive Directional price Index, and the DI - ( red) , negative Directional price Index, are also low, showing no real price action.
This can happen for longer periods of time and it is impossible to say which will rise, However, as we can see, the price movements have not been huge and so to expect a sudden Massive Dive, as some are suggesting, is not really backed by anything.
But we should never say never. Be cautious
Accumulation / Distribution chart below
What is nice about this, is simply that Accumulation is still the MAJOR movement. The majority are still accumulating and so the idea that we maybe in a Bear market is almost Dismissed. People would not accumulate an asset that is about to Dive for a long eriod of time....Normally.
There has been distribution, as marked by the RED zones. This is heavier distribution and as you can see, this Stopped at the beginning of this month, having begun when we reached the high towards end of 2024.
So many thought that was cycle ATH
They have seen the error of their ways BUT, Again, remain Cautious till we see a bigger move higher.
And now my favorite, MACD
And for me, this is where we will see the decision being made. We are approaching the Neutral zone
Last time we bounced off this area was in October 2024 and we went from 70K to 109K
BUT remain cautious, we have every possibility that we may fall through the neutral zone for a while too....But we are in an area that could show us a time to move.
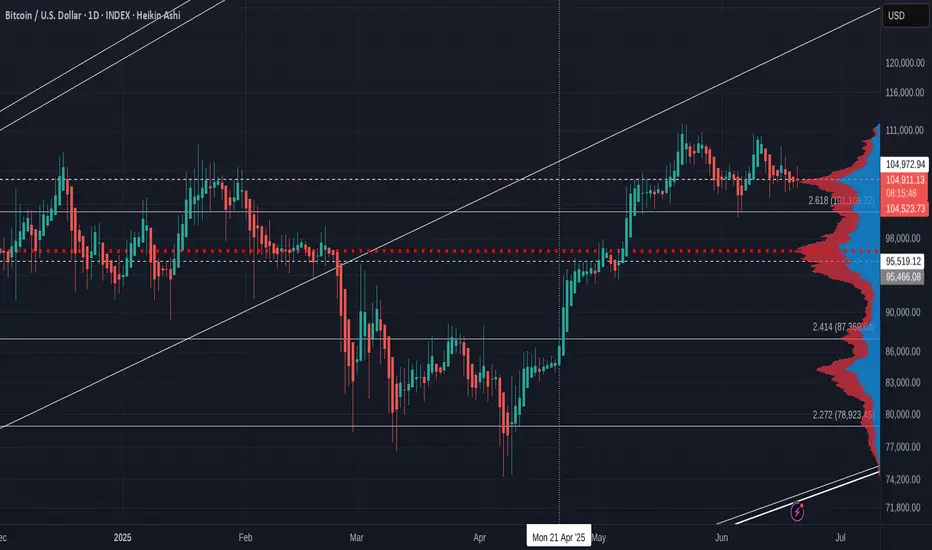
This is a LINEAR Bitcoin Daily chart
And those descending lines are FIB Circles and you can see how PA often runs along them.
You can also see how we are in a Pinch, a tight Squeeze right now ( arrow) with Horizontal line of support and the rejecting red 236 Fib circle.
That Apex is, again, at the end of the month.
So, to conclude, we are certainly heading towards a Move and possibly a new trend.
I like to think this will be Bullish but there are plenty f reasons for Caution.
I will remain with my Monthly charts that suggest June may be RED and that after than we will see more Green.
A Dip is possible and I have New Buy orders around 98K incase PA wicks down to them but there is NO guarantee this will happen...OR if it does, that it will stop there....
We just have to be prepared.
Stay safe
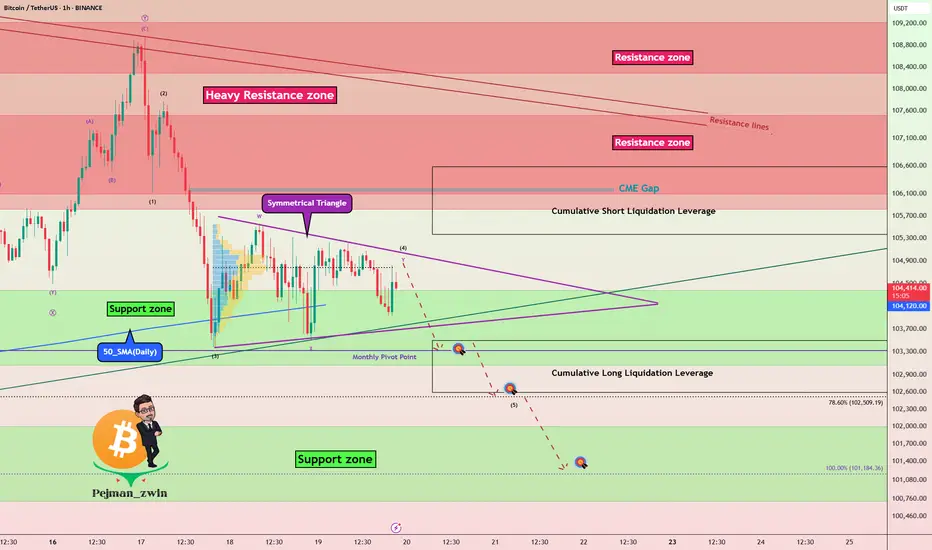
BTC - Key Battle Between Bulls and Bears – Symmetrical TriangleBitcoin ( BINANCE:BTCUSDT ) is currently consolidating within a Symmetrical Triangle , showing indecision among Bulls and Bears around the Support zone($104,380-$103,060) and just above the 50_SMA (Daily) .
From an Elliott Wave perspective, the current range may represent a WXY corrective structure . The market seems to be waiting for a breakout direction , potentially aiming to complete wave 5 after this correction.
The Monthly Pivot Point($103,300) and the presence of significant Cumulative Liquidation Leverage Zones (both Long and Short ) are key liquidity magnets to watch in the short term .
I expect Bitcoin to re-attack the Support zone($104,380-$103,060) AFTER breaking the lower line of the Symmetrical Triangle Pattern and decline to the targets I have outlined on the chart.
Note: Stop Loss: $106,703 = Worst Stop Loss(SL)
Please respect each other's ideas and express them politely if you agree or disagree.
Bitcoin Analyze (BTCUSDT), 1-hour time frame.
Be sure to follow the updated ideas.
Do not forget to put a Stop loss for your positions (For every position you want to open).
Please follow your strategy and updates; this is just my Idea, and I will gladly see your ideas in this post.
Please do not forget the ✅' like '✅ button 🙏😊 & Share it with your friends; thanks, and Trade safe.
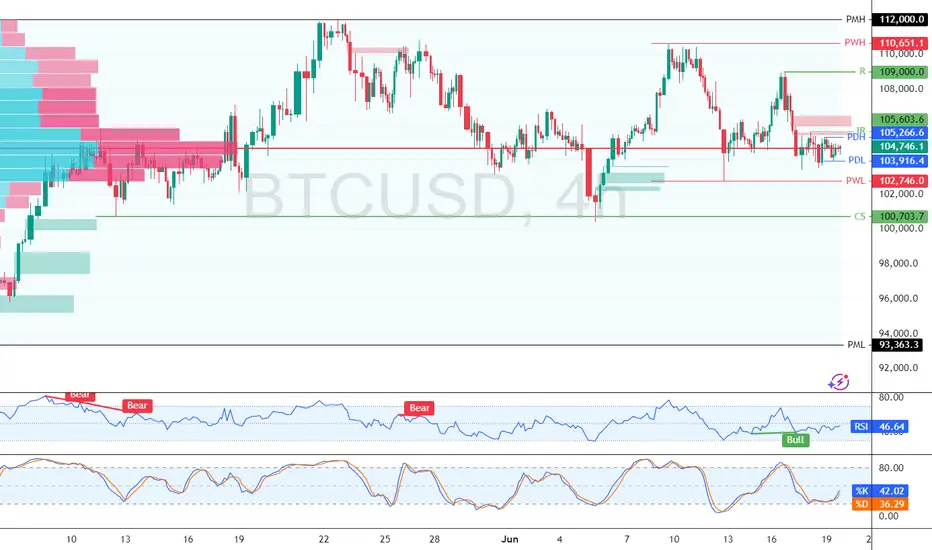
Bitcoin Consolidates Liquidity Around $105,000FenzoFx—Bitcoin is trading sideways near $104,650 after a sharp drop from $109,000, forming a high-liquidity zone with potential for a breakout.
The $102,746–105,266 range shows strong accumulation, offering support. BTC remains bullish above the previous week's low, but must close above the previous day's high to resume its uptrend.
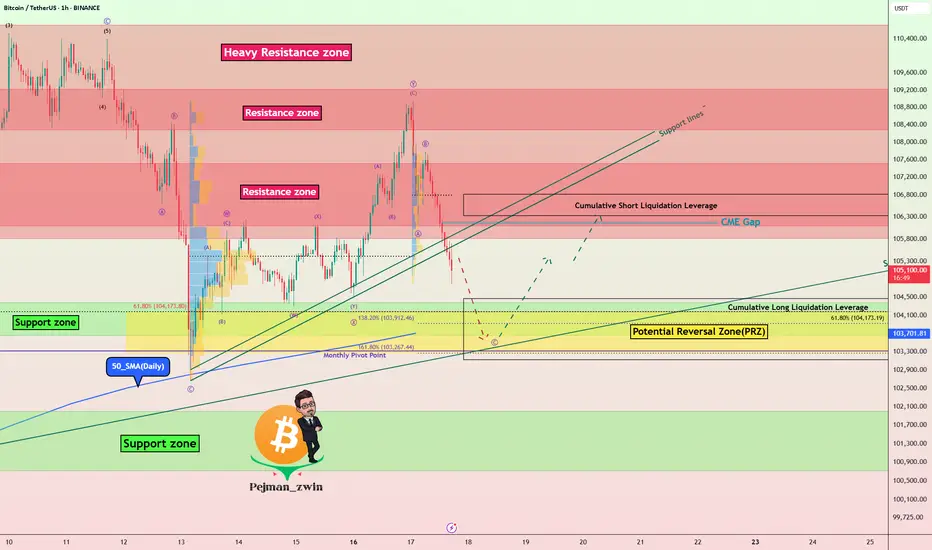
BTC Approaching Key Confluence Zone: Pivot + PRZ + LiquidationsBitcoin ( BINANCE:BTCUSDT ) appears to have broken the Support lines and is currently declining .
In terms of Elliott Wave theory , Bitcoin appears to be completing a corrective wave C . The corrective wave structure is a Zigzag Correction(ABC/5-3-5) .
I expect Bitcoin to start rising again from the Support zone($104,380-$103,660) , Potential Reversal Zone(PRZ) , Cumulative Long Liquidation Leverage($104,471-$103,124) , Monthly Pivot Point , Support line , and 50_SMA(Daily) , and the small CME Gap($106,190-$106,150) will also fill.
Note: Stop Loss: $102,520
Please respect each other's ideas and express them politely if you agree or disagree.
Bitcoin Analyze (BTCUSDT), 1-hour time frame.
Be sure to follow the updated ideas.
Do not forget to put a Stop loss for your positions (For every position you want to open).
Please follow your strategy and updates; this is just my Idea, and I will gladly see your ideas in this post.
Please do not forget the ✅' like '✅ button 🙏😊 & Share it with your friends; thanks, and Trade safe.
Bitcoin extended cycle, $120,000-$140,000 next july-augustBitcoin looks like its gonna be a good summer imo, too much people say it will a boring summer and we top in oktober-dec but what if we top in august and drop 50%, and sep-dec will be correction month, and we continue the bullrun end 2025 till q1 2026 and we print a top in q1 2026,

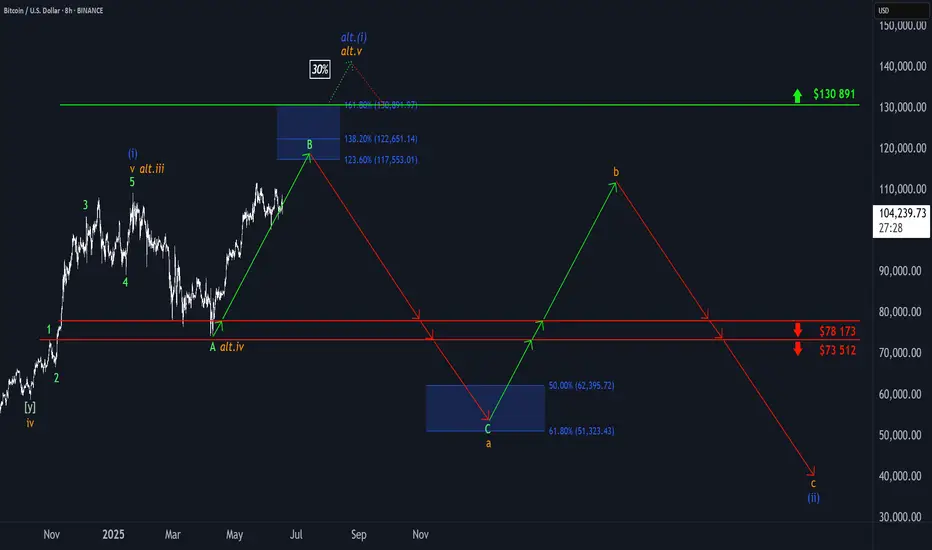
₿itcoin: SetbackBitcoin has come under selling pressure in recent hours. We cannot rule out that a deeper dip may precede the next leg higher into the upper blue Target Zone between $117,553 and $130,891. Once green wave B concludes in this range, we anticipate a wave C decline into the lower blue Target Zone between $62,395 and $51,323 to complete the larger orange wave a. From there, a corrective rally in orange wave b is expected, which should set the stage for a final leg lower to finalize blue wave (ii). Meanwhile, we’re still monitoring the alternative scenario (30% probability), in which blue wave alt.(i) is still in progress. In this case, BTC would stage an immediate breakout above resistance at $130,891.
📈 Over 190 precise analyses, clear entry points, and defined Target Zones - that's what we do.

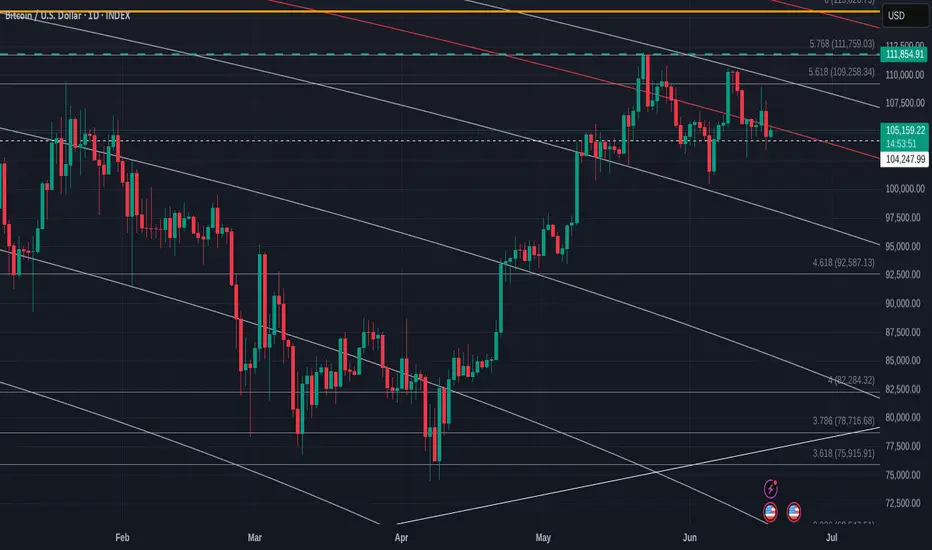
Bitcoin Daily Linear chart getting Squeezed on FED day - Caution
Those Fib circles are showing their strength again.
See how PA is pushed by them 99% of the Time.
And right now, we see PA ina tight Squeeze between horizontal Local support and that falling red 236 fib circle.
The Apex of that Bearish pennant is near the end of this month.
And, Today, depending on how Markets react to the FED Rate decision, PA could break away from this
A Push higher will meet resistance around 109K
A Drop lower would find support around 100K - 98K
And if I am going to show a Bearish side, a drop to the 4.618 at 92K is VERY possible given Macro events
We live in Hope that the Bulls Will show up
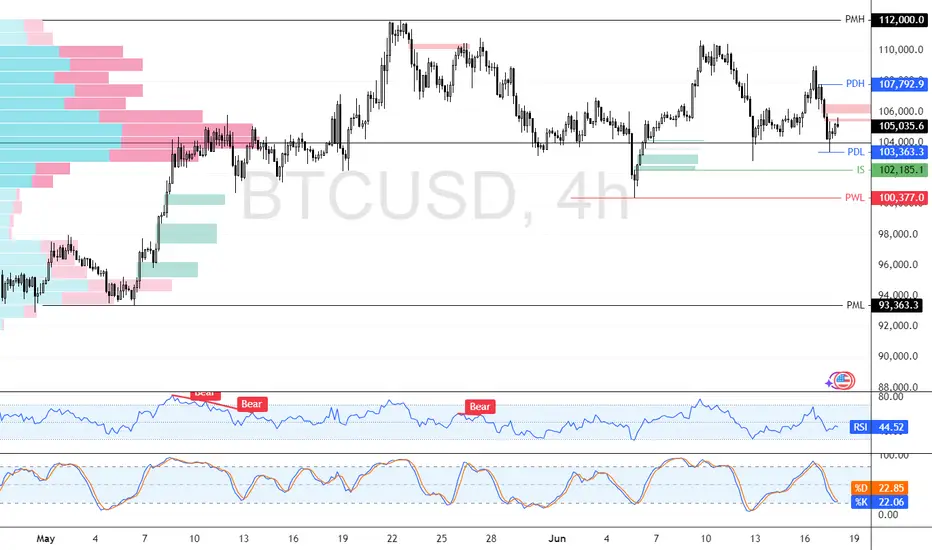
Bitcoin Bounced from a High-Volume Area at the 103,363 Support.FenzoFx—Bitcoin dipped to $105,175, creating a bearish fair value gap that highlights selling pressure. Immediate support is at $103,463, backed by high volume, while resistance stands at $107,792. If support holds, BTC/USD could rise toward $112,000.
A drop below $102,185 may accelerate the downtrend toward $93,363, the previous monthly low.
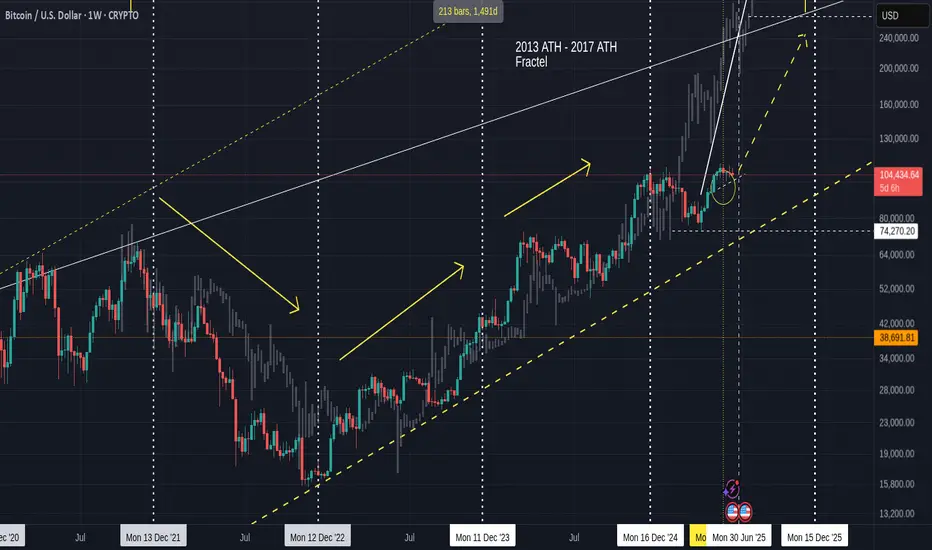
Bitcoin in expected price zone, may go lower then UP ?
This is the old fractal chart and I have faded out the Fractal from 2013 to 2017,
Everything ese remains unchanged since Feb this year.
We hit the expected price range indicated by the circle and we are still in that area but I expect, once the month closes and we have a small red month candle, then we can start printing Green again.
The daily version of this chart shows us more local detail
We have left the area of resistance and so now, we have a free move BUT I think we may dip down to that line of support around 100K - 98K
This would not be a bad thing to do before the end of the month as it would cool off the PA / RSI and MACD and so give confidence to the serious investor while scaring the pats off the New guys and Gals.
The Daily MACD still has a way to dip before it may find support on the neutral line
This level could see PA near that line of support but it is possible for MACD to drop while PA ranges.
So we could see that Dip to line of support and it may offer the last 100K buying zone for a very long time ..
But we do have Stupid people trying to start WW3 with Lies and Greed - this could possibly destabilise things.
Be Cautious
₿itcoin: Directly or with a Detour?!Under our primary scenario, Bitcoin remains on track to climb into the upper blue Target Zone between $117,553 and $130,891 during green wave B. The key question at this stage: will the crypto giant head straight for the zone – or take a detour below the $100,000 level first? Either path remains structurally consistent with the broader outlook. Once wave B concludes, we expect a pullback to unfold in wave C, with the low of that move – and the bottom of orange wave a – anticipated in the lower blue Target Zone between $62,395 and $51,323. From there, orange wave b should initiate a corrective rally, likely rebounding toward the $100,000 mark. This would set the stage for the final leg down in blue wave (ii). Meanwhile, our alternative scenario remains intact on the 8-hour chart. This 30% likely scenario suggests Bitcoin is still advancing within blue wave alt.(i) , rather than correcting in wave (ii). A confirmed breakout above $130,891 would validate this outcome.
📈 Over 190 precise analyses, clear entry points, and defined Target Zones - that's what we do.
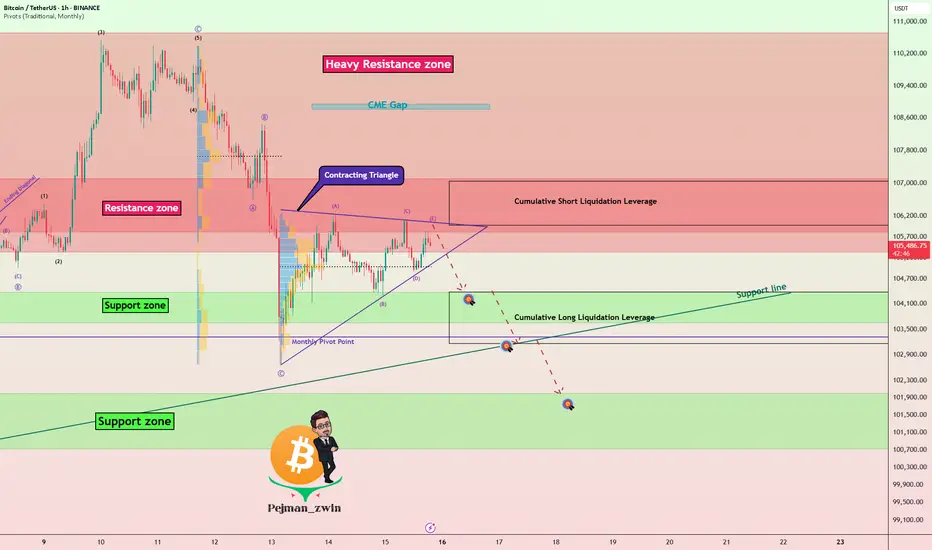
Geopolitical Tensions & Technical Pattern Point to BTC Decline!Bitcoin ( BINANCE:BTCUSDT ) fell about -5% after tensions between Israel and Iran escalated. Unfortunately , these tensions are still escalating, but Bitcoin has managed to recover about +3% so far.
Bitcoin is moving near the Resistance zone($107,120-$105,330) and Cumulative Short Liquidation Leverage .
In terms of Elliott Wave theory , it seems that Bitcoin is completing a corrective wave . The corrective wave structure could be Contracting Triangle . In case of a sharp decline in Bitcoin again, we can consider these waves as five descending waves (if Bitcoin does NOT touch $106,600 ).
I expect Bitcoin to start declining again and at least drop to the Support zone($107,120-$105,330 ). The second Target could be the Support line and Cumulative Long Liquidation Leverage .
Note: If Bitcoin can break the Resistance zone($107,120-$105,330), we can expect further increases in Bitcoin.
Please respect each other's ideas and express them politely if you agree or disagree.
Bitcoin Analyze (BTCUSDT), 1-hour time frame.
Be sure to follow the updated ideas.
Do not forget to put a Stop loss for your positions (For every position you want to open).
Please follow your strategy and updates; this is just my Idea, and I will gladly see your ideas in this post.
Please do not forget the ✅' like '✅ button 🙏😊 & Share it with your friends; thanks, and Trade safe.