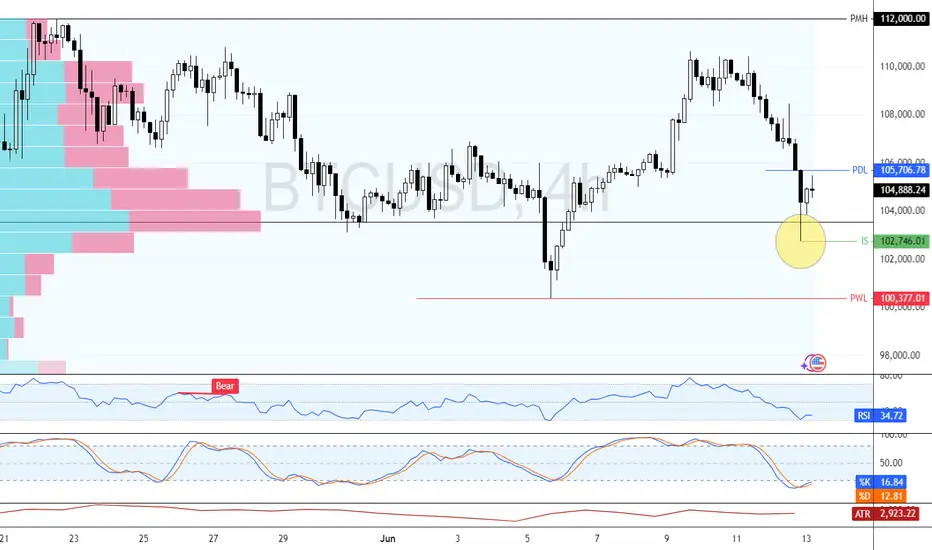
BTC/USD Faces Key Support—What’s Next for Bitcoin? FenzoFx—Bitcoin dipped from its $112,000 monthly high, now trading near $104,900. Liquidity was swept, forming immediate support at $102,746.
Stochastic signals an oversold market, suggesting potential consolidation or an uptrend resumption. BTC/USD must close above $105,706 for bullish momentum, targeting $112,000.
A rejection at $102,746 may invalidate bullish outlooks, driving BTC toward $100,377.
Bitcoinanalysis
Bitcoin weekly / Daily showing a Dip to sub 100K possibleBitcoin weekly / Daily showing a Dip to sub 100K possible but is avoidable.
On the weekly, we can see how PA is top of Range, just below the arc that has rejected everything since 2011.
There is more resistance overhead than support below and the first Real line of support sits around 103,599 , 101K then we go to 98K.
If we loose 98K for some strange reason, it is a png drop to around 88K - I doubt we will see that just yet.
However, as you can see on the weekly chart, that is the area of a STRONG line of support that has been used this cycle 4 times to propel PA higher.
The Indicators are Bull Bear Power, showing the momentum of the Trend. We have just begun a Red Bear Candle..gut this is currently sitting on a line of resistance....
The RSI is above its average and has just been rejected off the high, so the likelihood os that this will retreat lower in time or with a sharp drop.
The ADX shows trend strength NOT DIRECTION. This has just turned and has begun rising and with BTC PA falling, it suggests the beginning of a Bear trend - MAYBE
Looking at the Daily
We can see once again, PA got pushed away from the Arc of Resistance ( blue) and has begun falling.
The Bull Bear power chart shows ua how the Bears maybe meeting resistance right now and we may see a drop in bear power in the near future.
RSI has fallen below its average now and now has bumped into the Neutral line that does offer support, as we saw recently and in early 2025
Again, the ADX is Low and turning up , indicating a new trend maybe forming but we have to wait to see what this maybe
To conclude, we need to wait to get a clearer picture right now but it seems almost certain that a new trend is forming.
On the shorter term we have the chance of a bounce back / Range horizontal at current price range but the longer term looks a little more bearish for now
We are half way through June and as suggested in my posts about monthly colour candle close, It seems that a Red June candle would be a Good thing but it needs t be a not to deep candle.
So 2 more weeks of scary PA would be OK but nerve raking.
We shall have to watch close here....
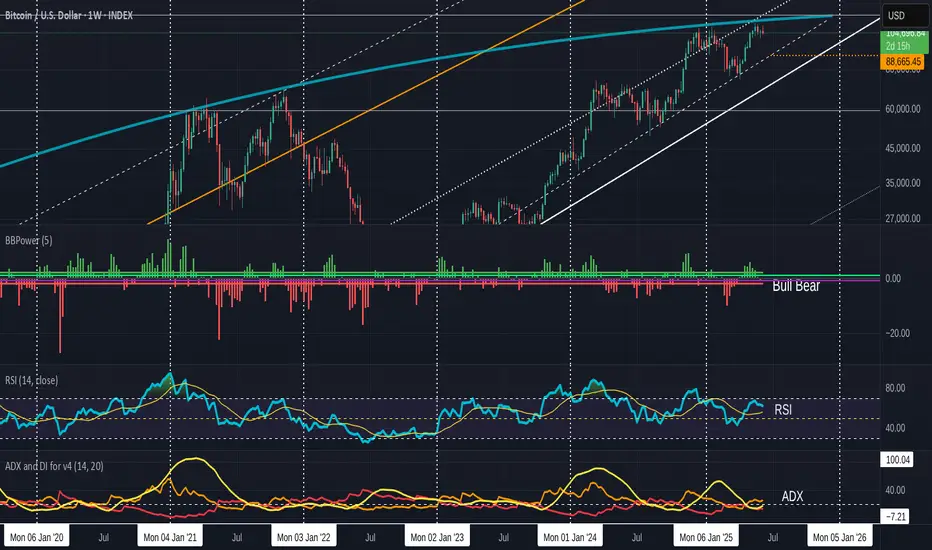
Bitcoin life cycle-stage One ending-Next cycle has to start NOW
There are 3 things to see in this chart
1) The Orange Arc of resistance. I have talked about this previously but to recap a little, it has its origins in Oct 2009 and has rejected EVERY ATH since then, as you can see on the chart. The Arc itself is part of a Fibonacci Spiral.
This Arc has begun to Squeeze PA against the lower trend line, that was formed in 2011.
And we are now in a position where PA MUST react or get pushed below the Long Term line of support.
This could be called Make or Break time for Bitcoin.
The Apex of this pennant is around Jan 2026
PA always reacts before the Apex.....99% of the time.
2) The Vertical Coloured bars are Trend Based Fibonacci Time, It begins on the 1st ATH in the channel that Bitcoin created. This channel is shown in the chart below
See how the Runs to the 2017 & 2021 ATH were all in a Bullish Green zone and how PA never retouched the lower trend line of support in this time
Since Mid 2021, we entered a Bearish Zone.
On the main chart, you will notice how this Fib Time has just ended.
3) The Trend based Fibonacci Extensions. Every single ATH rejected off a Fib extension.
The Root is at the 2009 Low and 1 is at the First ATH in the Bullish Fib time Zone.
The numbers here are all based off the 3,6,9 number sequence.
Lets look a little closer at the weekly chart
As we can see, PA got repeatably rejected off this orange Arc of Resistance and Current PA has been up there, trying to break through since 2024.
Many people have also commented on how PA has been so subdued this cycle and could this be reflected in the Fib Time showing us that we are in a Red Bearish Zone.
See how, from Mid 2021, when we entered a Strong Red zone, PA took a Deep dive off the Nov 2021 ATH.
Also note how this zone ended in late 2022 and in Jan 2023, PA began its current cycle Run. See the change in Colour ?
And Currently, while Bitcoin tries to break out of this squeeze, we were in a Red zone again....that just ended.
AND we can also see that we have not yet reached the 6 Fib Extension at 120,251 usd
The situation we face here is that if PA gets rejected off that Fib line, having just broken through the Arc, we could get pushed right back down under the Arc again. It is VERY STRONG RESISTANCE
This next move from Bitcoin HAS to be strong enough to take us up to the 9 fib line at 180,391 usd at a minimum. This way we can use the 6 Fib extension as support when PA cools off from a big push and so remain above the Arc and begin the Next long term cycle.
The Daily chart below shows us where we are right now
You can see how PA has repeatably tried to break above the Arc and been rejected Firmly Every time...so far, PA has avoided going right back down to the Lower trend line and has remained in near distance to this Arc..But we are running out of Time.
Recent attempts by PA have been Strong and I am sure that we will make it over but the real question is can we also get over that 6 Fib extension and stay above.
The weekly MACD certainly has enough strength to cope
Should we have a subdued Summer trading on Bitcoin, we will see this MACD cool off and be stronger before a sustained push near Autumn maybe.
To conclude, Bitcoin is under pressure to move out of its First Full Cycle.
It is getting Squeezed and now it is time for Bitcoin to prove it can cope with its new found "Adulthood"
The Next Big push, maybe later in the year, could very realistically reach 200K or more and this would place us Above that 9 Fibonacci extension I talked about earlier.
Of course, events could change and we could see PA collapse back below the Arc.
If this happens, all is NOT lost but it would certainly weaken the case for Long Term holders to continue doing so.
This then could create a Snownall effect and prices may tumble....And I will buy MORE....
Either way, we are in a HUGE moment for Bitcoin and I am privileged to be able see this all unfold...
Lets see what happens but, for me, I am Still VERY Bullish though Cautious....
We may have to revisit low 70K in the near future if Pa cannot get over this Arc and the 6 Fib extension

Bitcoin Near Breakout – CPI Miss Could Be the Catalyst?Just Released: Key U.S. Inflation Data:
Core CPI m/m: 0.1% (vs. 0.3% forecast)
CPI m/m: 0.1% (vs. 0.2% forecast)
CPI y/y: 2.4% (vs. 2.5% forecast)
Market Reaction & Outlook:
The softer-than-expected inflation figures suggest easing price pressures in the U.S. economy — a potential bullish signal for risk assets, such as Bitcoin ( BINANCE:BTCUSDT ).
-----------------------------
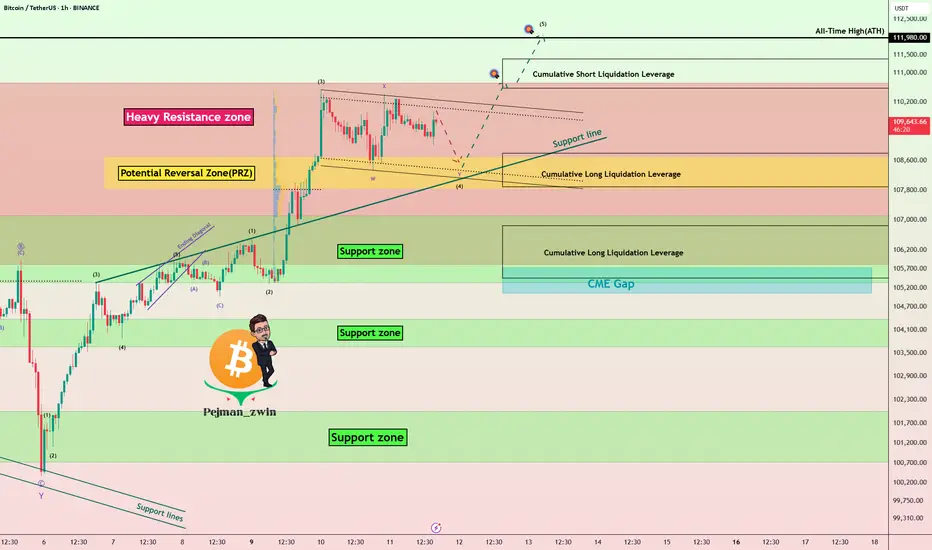
Now let's take a look at the Bitcoin chart on the 1-hour time frame .
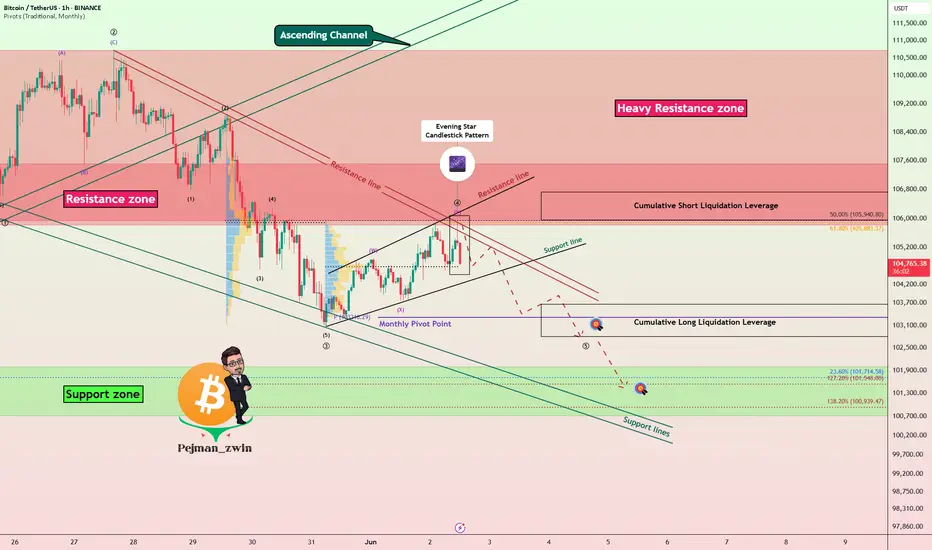
Bitcoin is trading in the upper part of a Heavy Resistance zone($104,380-$103,670) and is trying to break through this zone. The announcement of US indexes could be a trigger for a breakout of this zone .
In terms of Elliott Wave theory , Bitcoin appears to be completing microwave 4 of the main wave 3 . The structure of microwave 4 is a Double Three Correction(WXY) .
I expect Bitcoin to start rising from the Potential Reversal Zone(PRZ) and near the Support line again and rise to at least $110,670 and if the Heavy Resistance zone($104,380-$103,670) is broken we should expect new ATHs in the coming days .
Cumulative Long Liquidation Leverage: $108,791-$107,887
Cumulative Long Liquidation Leverage: $106,840-$105,457
Cumulative Short Liquidation Leverage: $111,381-$110,568
Note: If Bitcoin falls below $105,700(Worst Stop Loss(SL)), we should expect further declines.
If you want to know my weekly analysis about BTC , I suggest you check out the following idea:
Please respect each other's ideas and express them politely if you agree or disagree.
Bitcoin Analyze (BTCUSDT), 1-hour time frame.
Be sure to follow the updated ideas.
Do not forget to put a Stop loss for your positions (For every position you want to open).
Please follow your strategy and updates; this is just my Idea, and I will gladly see your ideas in this post.
Please do not forget the ✅' like '✅ button 🙏😊 & Share it with your friends; thanks, and Trade safe.
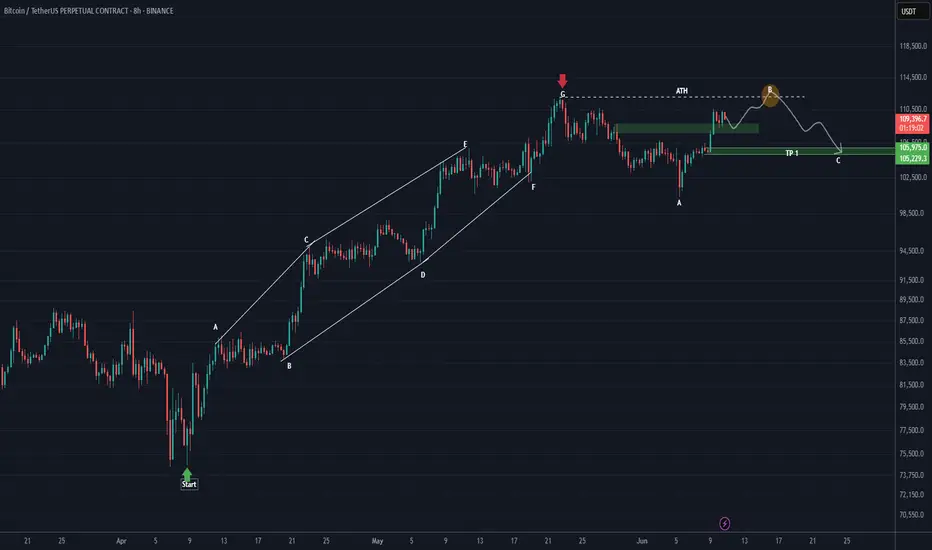
Will Bitcoin move toward its ATH?This analysis is an update of the analysis you see in the "Related publications" section
In the previous analysis, we mentioned that the red zone marked on the chart could potentially be broken.
From the point where we placed the green arrow on the chart, Bitcoin’s diametric pattern has completed, and it has entered a corrective phase.
It now appears that we are in wave B of a running flat, and wave B could complete around the all-time high or slightly above it.
Let’s see whether this move will play out or not.
For risk management, please don't forget stop loss and capital management
Comment if you have any questions
Thank You
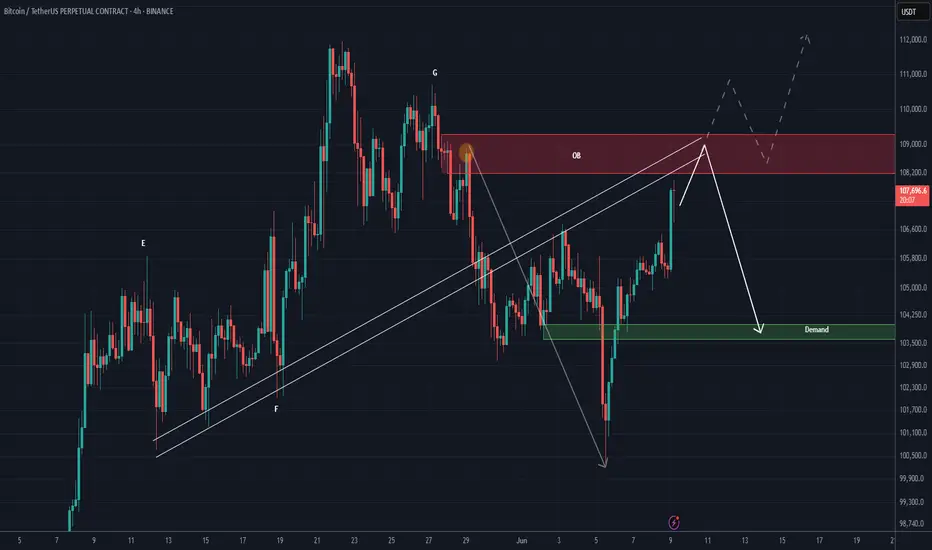
BTC NEW UPDATE (4H)This analysis is an update of the analysis you see in the "Related publications" section
These days, Bitcoin's movement is mostly driven by liquidity hunting and is caught in complex and risky corrections.
The resistance zone currently in front of Bitcoin is marked in red. If the price is going to get rejected, it should happen from this zone. However, if this zone is broken and price stabilizes above it, Bitcoin could turn bullish again.
Considering today is Monday, volumes are still low, and the price is near a strong order block | you should be careful with your positions.
For risk management, please don't forget stop loss and capital management
Comment if you have any questions
Thank You
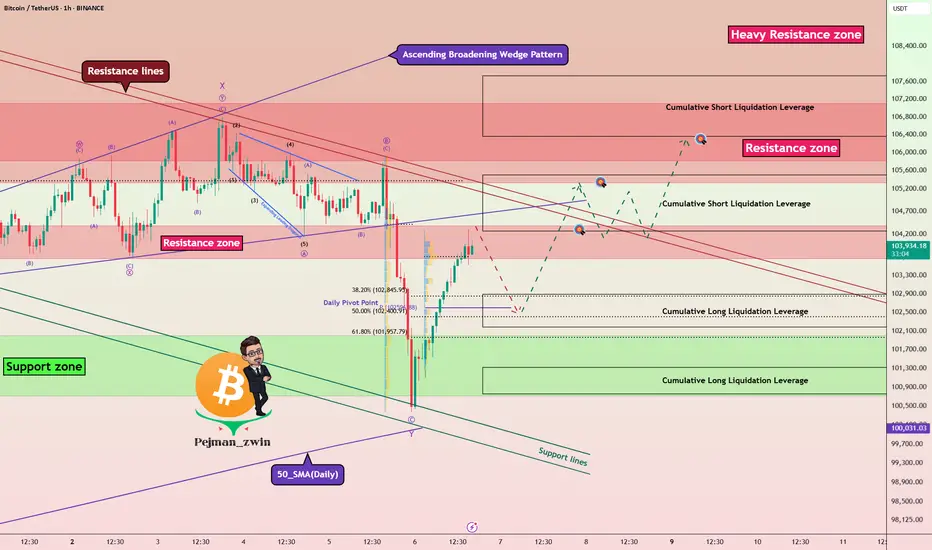
Bitcoin’s Reversal from Supports — Is the Correction Over? Bitcoin ( BINANCE:BTCUSDT ) moved as I expected in the previous idea , and it also reversed the decline I intended and started to rise from the Support zone($102,000-$107,120) , Support lines , and 50_SMA(Daily) .
Bitcoin is trading near the Resistance zone($104,380-$103,670) , Cumulative Short Liquidation Leverage($105,500-$105,265) , and Resistance lines .
In terms of Elliott Wave theory , it seems that Bitcoin has managed to complete the main wave Y . The main corrective structure was the Double Three Correction(WXY) . If the Resistance lines are broken , we can confirm the end of the main wave Y .
I expect Bitcoin to start rising after a re-correction from Cumulative Long Liquidations Leverage and reach the targets I have specified on the chart.
Cumulative Long Liquidation Leverage: $102,883-$102,181
Cumulative Long Liquidation Leverage: $101,318-$100,748
Note: If Bitcoin falls below $100,200(Worst Stop Loss(SL)), we should expect further declines.
Note: $105,500 is an important price for Bitcoin, and if Bitcoin can close the 4-hour candle above it, we can expect a break of the Heavy Resistance zone($104,380-$103,670)
Please respect each other's ideas and express them politely if you agree or disagree.
Bitcoin Analyze (BTCUSDT), 1-hour time frame.
Be sure to follow the updated ideas.
Do not forget to put a Stop loss for your positions (For every position you want to open).
Please follow your strategy and updates; this is just my Idea, and I will gladly see your ideas in this post.
Please do not forget the ✅' like '✅ button 🙏😊 & Share it with your friends; thanks, and Trade safe.
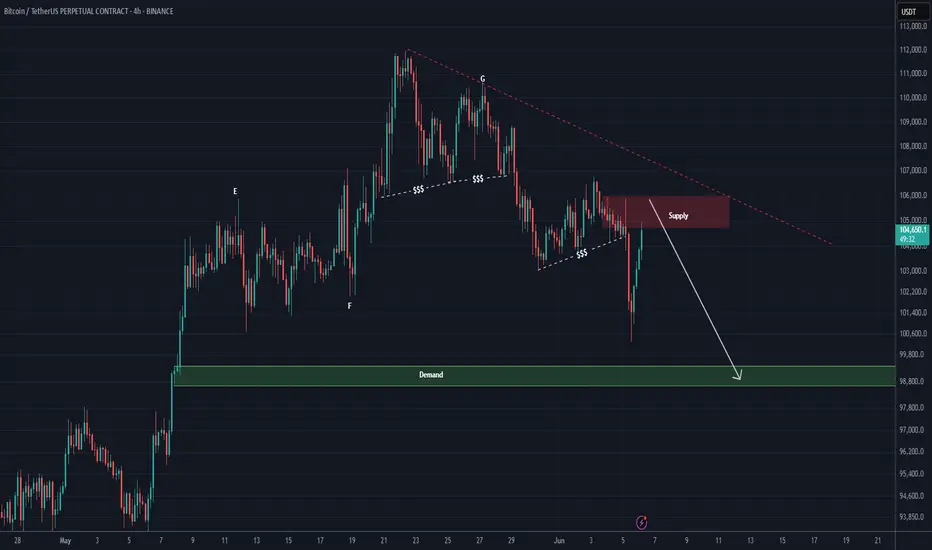
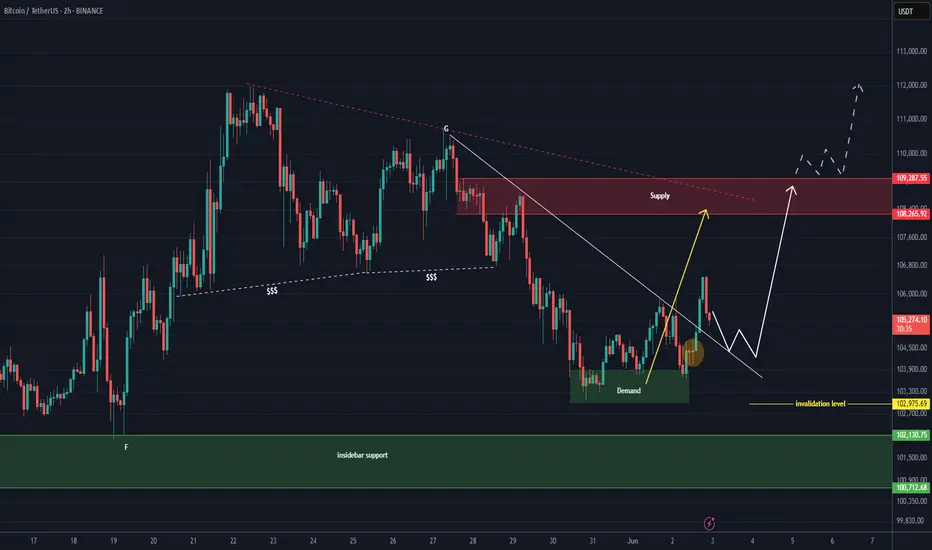
BTC NEW UPDATE (4H)After dropping toward the 100K zone and sweeping the liquidity pool, Bitcoin has made a strong rebound to the upside, putting high-leverage short positions at risk. However, it is now approaching a supply zone that could potentially push the price back down toward the 98K area.
If the market maker intends to drive the price lower and trigger a bearish scenario, this is the zone to do it from. Let’s see what happens.
A daily candle close above the invalidation level ($107,000) would invalidate this analysis.
Let’s see how Bitcoin reacts to the red box.
For risk management, please don't forget stop loss and capital management
When we reach the first target, save some profit and then change the stop to entry
Comment if you have any questions
Thank You
Bitcoin's Structure Breaks — PRZ May Trigger a BounceBitcoin ( BINANCE:BTCUSDT ) has finally continued its downward trend , as I expected in my previous idea .
Do you think this downward trend will continue or not?
Bitcoin has now managed to break the Support zone($104,180-$103,670) and the lower line of the Ascending Broadening Wedge Pattern .
In terms of Elliott Wave theory , Bitcoin appears to be completing microwave C of the main wave Y of the Double Three Correction(WXY) .
I expect Bitcoin to continue to decline to the Support zone($102,000-$107,120) and the Potential Reversal Zone(PRZ) and then start to rise again.
I choose to label this idea as ''Long''.
Note: If Bitcoin falls below $100,200, we should expect further declines.
Please respect each other's ideas and express them politely if you agree or disagree.
Bitcoin Analyze (BTCUSDT), 1-hour time frame.
Be sure to follow the updated ideas.
Do not forget to put a Stop loss for your positions (For every position you want to open).
Please follow your strategy and updates; this is just my Idea, and I will gladly see your ideas in this post.
Please do not forget the ✅' like '✅ button 🙏😊 & Share it with your friends; thanks, and Trade safe.

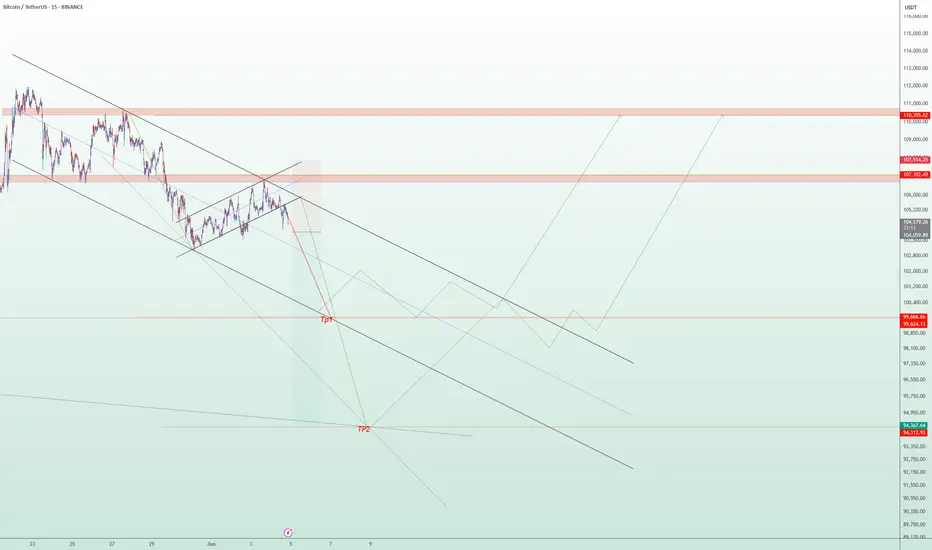
BTC/USDT Technical Analysis – 15-Min Chart | Short-Term Bearish The current price action of Bitcoin (BTC/USDT) shows a sustained bearish trend within a well-defined descending channel. Following a temporary bullish correction in the form of a rising channel, the price faced strong resistance around the $107,000–$110,500 supply zone and is now showing signs of a bearish breakout.
📉 Key Technical Observations:
A clear rejection from the upper resistance zone has led to a breakdown below the rising correction channel.
Immediate support zones are identified around $99,600 (TP1) and $94,300 (TP2), where price may potentially stabilize or bounce.
The bearish momentum remains dominant unless a strong reversal above $107,000 occurs.
📌 Scenarios to Watch:
Bearish Scenario: Price could continue falling toward TP1 and possibly TP2 if momentum holds and no strong reversal signals appear.
Bullish Reversal Scenario: A bounce from support levels with higher lows and a break above $107,000 could signal the beginning of a new bullish phase.
🔔 Disclaimer:
This analysis is intended for educational and informational purposes only. It is not financial advice. Please conduct your own research and risk assessment before making any trading decisions.
Is Bitcoin Repeating Its 2021 Price Action? | TRADEDOTSWe’ve observed that Bitcoin CME:BTC1! appears to be repeating a previous wave pattern. If it follows its historical price action yet again, here’s what we might expect:
2021 Comparison
Back in 2021, Bitcoin formed two large rounded wave structures where the second wave exceeded the first, forming two consecutive all-time highs followed by a huge drawdown. This year’s price action looks very similar to the beginning of the second 2021 waves. If it continues to unfold in the same way, we anticipate a new all-time high before the end of this year, followed by a notable pullback into early next year.
Key Support at $96,000
As long as BTC holds above $96,000, the bullish trend remains intact. This level has shown great demand and volume support, reinforcing its role as the floor for the short-term uptrend.
Upside Potential to $117,000
If buyers continue to support the market above $96,000, BTC could reach the $117,000 region, setting another all-time high. This expectation follows the earlier wave pattern seen earlier this year and completes a close parallel to the 2021 bull run.
Deeper Pullback Expected
After a potential new high, a larger correction is likely. Drawing on previous pullback price action, a 30% dip toward $82,000 could align with a higher-time-frame trendline and significant support area—mirroring the wave structure from 2021.
Final Thoughts
BTC remains structurally bullish above $96,000
A pullback to the $82,000 region could present a key buying opportunity if it occurs.

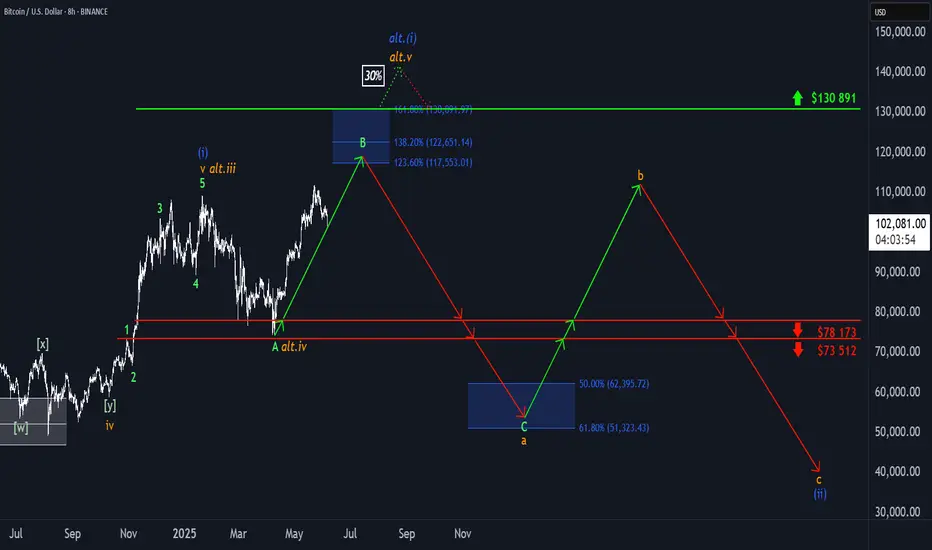
BTC: Facing Resistance?Bitcoin recently encountered renewed selling pressure, stalling the anticipated continuation of green wave B. Under the primary scenario, this corrective upward movement should still extend into the upper blue Target Zone between $117,553 and $130,891, where the price is expected to reverse and initiate green wave C. That move should complete with a low in the lower blue Target Zone between $62,395 and $51,323, thereby finalizing orange wave a. Following a corrective advance in wave b, the larger wave (ii) should reach its conclusion. There remains a 30% probability for the alternative scenario, in which BTC pushes above the upper blue Target Zone, establishing a new high in blue wave alt.(i)— which would delay the expected pullback.
📈 Over 190 precise analyses, clear entry points, and defined Target Zones - that's what we do.
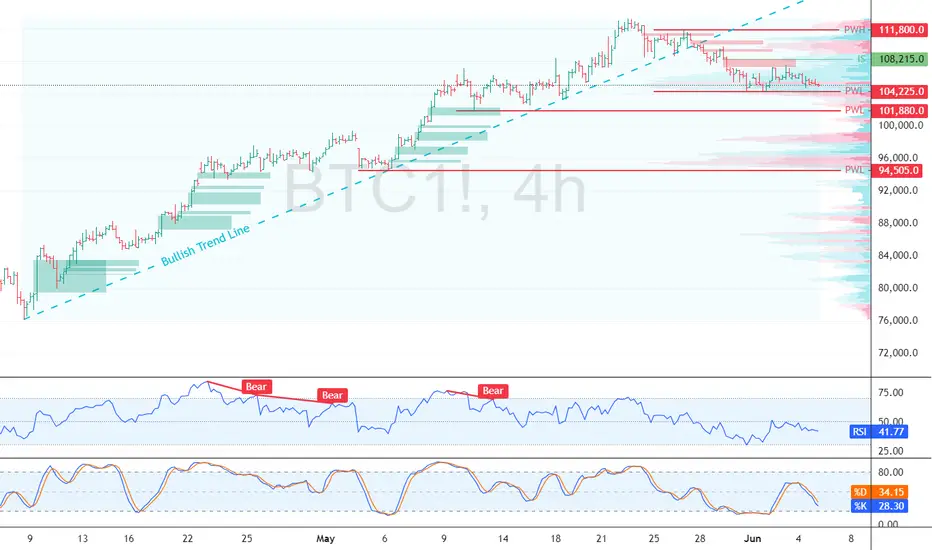
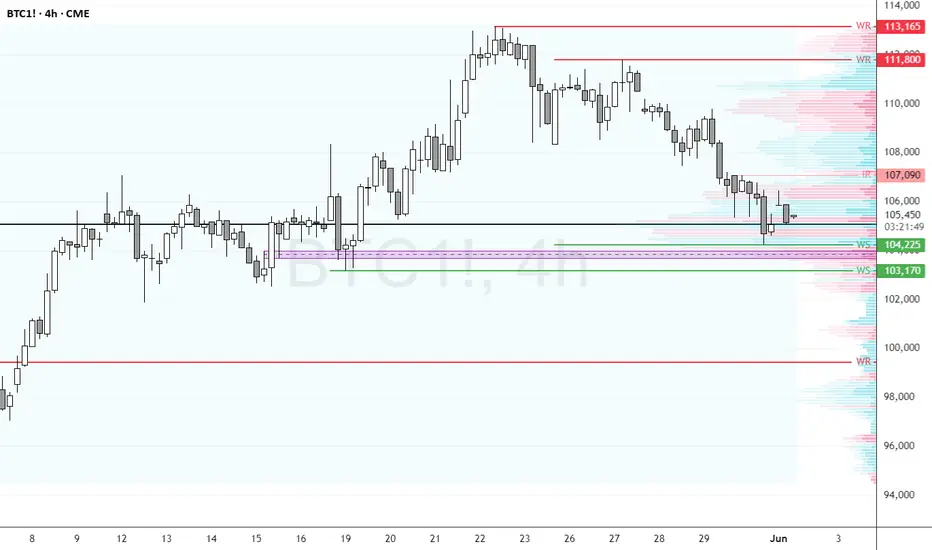
Bitcoin 4 hour update and longer term outlook for next 5 days
Bitcoin is in a Rising channel after dropping.
This can be easily called a BEAR FLAG and it needs to be paid attention to for a number of reasons.
The line of support that held PA up in May is now close overhead resistance and we are climbing towards an apex around 11 June.
PA always reacts before APEX
I would expect this to happen from the 8th June but could obviously happen before.
I can see PA dropping to around 102K, on the POC ( red dotts ) off the VRVP
We will have to see what happens form there but there is a strong line of support just below this.
The 4 hour MACD is currently being rejected from Neutral back down into oversold.
The Daily MACD is continuing to fall Bearish and will reach neutral bu the weekend, the 7th
This could be the beginning of a longer term Bearish move and could end up back in the mid 95K before it finishes over the next 8 weeks
HOWEVER, PA does have the ability to turn the tables on the newly woken Bears
We will have to take this a step at a time right now.
But as emtioned in apost earlier today, I do expect us to NOT move to much higher in the near future but more to range once again, maybe for up to 8 - 10 Weeks
We shall see and watching the Dominance chars right now is a VERY good idea
Bitcoin’s Bearish Signal: Key Levels to WatchFenzoFx—Bitcoin consolidates near $104,225 after breaking below the bullish trendline, signaling a possible break of structure. This level acts as immediate support, and a bearish wave could form if BTC closes below it, targeting the $101,880 demand zone.
The bearish outlook remains valid unless Bitcoin surpasses $108,215. If broken, price could rise toward $111,800.
Bitcoin’s Rally Fades Below Resistances — Bearish Wave Setup!Bitcoin ( BINANCE:BTCUSDT ) started to fall as I expected in the previous idea , but failed to break the Heavy Resistance zone($110,000-$105,820) .
Bitcoin is trading near the Resistance zone($107,520-$105,940) , Cumulative Short Liquidation Leverage($106,720-$105,948) , and the Resistance lines .
From the perspective of Elliott Wave theory , Bitcoin appears to have completed a main wave 4 near the Resistance lines. The structure of the main wave 4 was a Double Three Correction(WXY) . One of the signs of the completion of the main wave 4 could be the Evening Star Candlestick Pattern .
I expect Bitcoin to decline to at least Cumulative Long Liquidation Leverage($103,666-$102,800) AFTER breaking the Support line , and the next target is the Support zone($102,000-$107,120) .
Note: Rising tensions between Russia and Ukraine could help drive down Bitcoin.
Note: If Bitcoin touches $107,600, we can expect more pumps.
Please respect each other's ideas and express them politely if you agree or disagree.
Bitcoin Analyze (BTCUSDT), 1-hour time frame.
Be sure to follow the updated ideas.
Do not forget to put a Stop loss for your positions (For every position you want to open).
Please follow your strategy and updates; this is just my Idea, and I will gladly see your ideas in this post.
Please do not forget the ✅' like '✅ button 🙏😊 & Share it with your friends; thanks, and Trade safe.
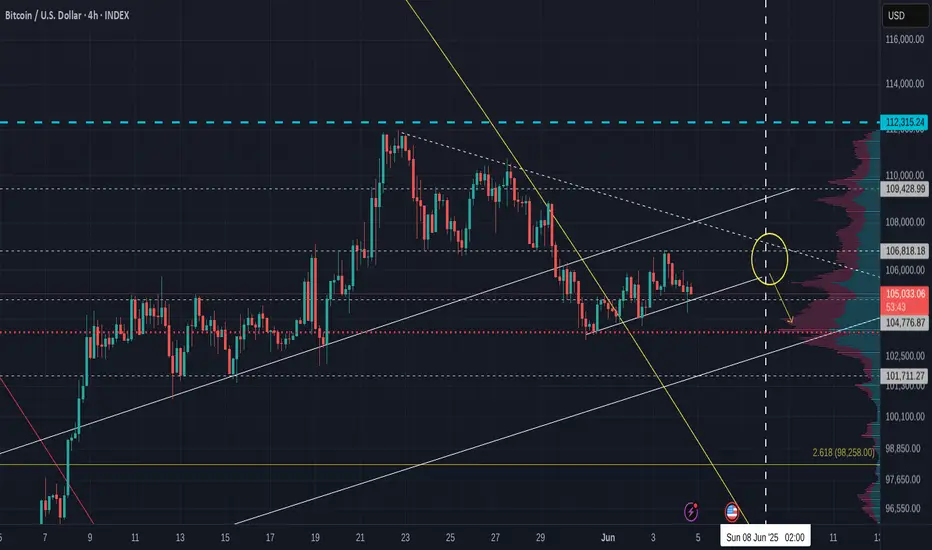
BTC NewUpdate (2H)This analysis is an update of the analysis you see in the "Related publications" section
As we had identified in the previous analysis, the price could have reversed to the upside from either the upper or lower green zone. It seems that the orders in the upper green zone were sufficient.
Given the break of the trigger line, the area marked by the yellow circle is now a key zone for us. If the price pulls back to this yellow circled area, it could move toward the red zone. And if the red zone is broken, we might witness a new all-time high (ATH).
The closure of a 4-hour candle below the invalidation level will invalidate this analysis.
For risk management, please don't forget stop loss and capital management
Comment if you have any questions
Thank You
Bitcoin Monthly Candle Colour Close since 2011 - looking forward
May Closed GREEN, and We are currently on a Very small Green candle for the month open.
Last month, in this series of monthly charts posts, I mentioned this..
"On only 2 occasions have we had a GREEN JAN, RED FEB, RED MARCH, GREEN APRIL
And Both of them were on the way to ATH. ( Arrows )
On both those occasions we had a GREEN MAY, though the gains were minimal and one was followed by a Green June and the other by a Red June."
And we just closed May with a minimal GREEN candle.
This is important to understand, This month, we have a 50/50 chance of repeating the Green June candle in this pattern.
Outside of this pattern, The previous MAY closes, 7 Green to 6 Red.
Of the 7 Green, 5 were followed by a Green June
With this, we have a higher % chance of a Green June
Of All previous June Closes, we had 7 Green to 6 Red.
Of those 7 previous Green June Closes, 3 were followed by GREEN July
Of the 6 previous RED Junes, ALL were followed by GREEN July
With this in mind, we maybe in a better position if we did close June with a small RED candle, as we did in the 2020 sequence ( right hand Arrow)
Should we close June RED, I will then expect a fairly level summer period with PA beginning to start moving again around September / October
Bitcoin PA is in an excellent position to move higher now though. It is also in an excellent position to move away from previous cycle patterns and begin creating new one.
We do have to remain vigilant as markets are moving everywhere and Macro conditions could change rapidly
But the one thing that seems to remain static is that it is a VERY GOOD IDEA to Buy Bitcoin and HOLD IT

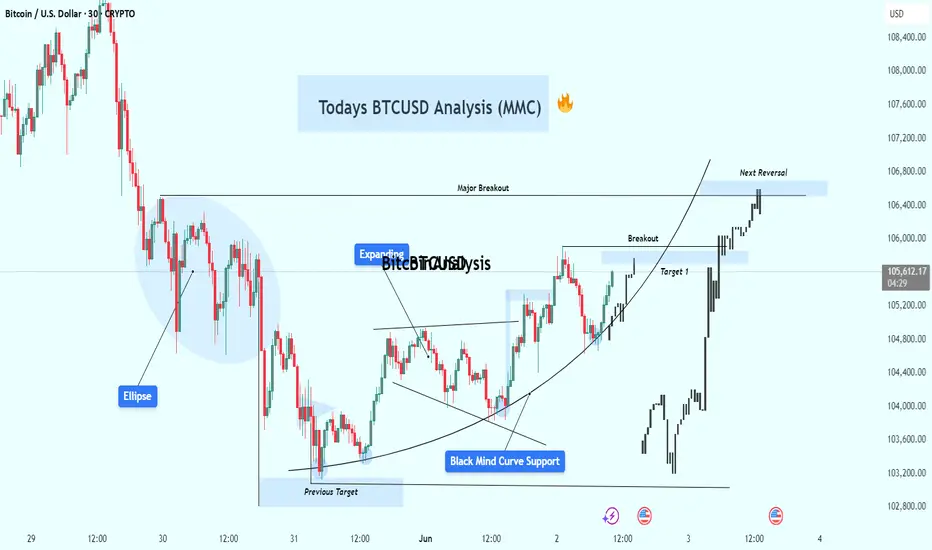
BTCUSD Mind Mapping Analysis (MMC) + Structure Mapping + Target🕵️♂️ Introduction
Welcome traders! In today’s BTCUSD analysis, we dive deep into the Mind Mapping Concept (MMC) with curve-based support, smart money structure shifts, and mapped liquidity levels. This chart reveals how institutional players moved price through liquidity traps, accumulation zones, and major breakout points, culminating in a reversal zone.
This breakdown is ideal for traders using:
Smart money concepts (SMC)
Curve theory
Liquidity sweeps
Structure mapping
🔍 Detailed Breakdown of the Chart:
🔹 1. Ellipse Zone – Liquidity Trap Phase
The blue ellipse on the left shows a clear area of price compression and indecision.
This is where retail traders often enter prematurely, expecting reversal.
Smart money exploits these zones to collect liquidity — this is not yet a trend shift, but a trap.
You can observe multiple wicks and fakeouts, signaling manipulation and preparation for expansion.
🔹 2. Expanding Channel – Volatility Phase
Following the trap, price enters an expanding pattern (also known as a megaphone).
These structures indicate uncertain market behavior, often manipulated to clear both highs and lows.
Smart money uses this to exhaust both buyers and sellers before deciding the real trend direction.
🔹 3. Previous Target & SR Flip Zone
Price reaches the previous downside target, completing a downward liquidity move.
From here, the market forms a support-resistance flip (SR-Interchange) — a textbook zone for institutional entries.
Once this zone holds, it confirms that buyers are absorbing sell orders.
The curve starts forming, indicating deeper market structure realignment.
🔹 4. Black Curve – Mind Mapping Curve Support
One of the most important elements of MMC — the curve — acts as a psychological and algorithmic support line.
The curve captures the accumulation structure in a flowing manner.
Repeated touches and rejections confirm its strength.
As long as price respects the curve, the bullish momentum remains intact.
🔹 5. Breakout Confirmation
Price breaks through mid-range consolidation and hits Target 1.
This move confirms a shift in market sentiment from indecision to bullish control.
The breakout is supported by volume, structure alignment, and curve acceleration.
🔹 6. Major Breakout Zone
A major resistance line is broken — this marks a shift in macro structure.
At this point, we label the zone as “Major Breakout” — any retest of this can offer a high-RR entry.
🔹 7. Next Reversal Zone (Supply Zone)
Price is now inside the Next Reversal Zone, which is a potential supply area or liquidity magnet.
Institutional traders may use this zone for profit-taking or to initiate a deeper retracement.
Watch for rejection signs, such as long wicks, engulfing patterns, or volume divergence.
If this zone is absorbed (i.e., broken cleanly), expect another leg higher.
💡 MMC Summary (Flow Recap):
Trap → Expansion → Liquidity Target → SR Flip → Curve Accumulation → Breakout → Target Hit → Reversal Zone
Each stage reflects smart money behavior and follows the natural cycle of manipulation → accumulation → distribution.
📊 What to Watch Next?
Confirmation Rejection in Reversal Zone? Short entries could be valid with curve re-entries.
Bullish Continuation? A clean break above reversal zone = new weekly highs likely.
Retest of Curve? If price pulls back, watch for rejections on the curve for safer long positions.
🚨 Trade Tips Based on This Setup:
✅ Use multi-timeframe confluence (M30 + H1 or H4)
✅ Always mark out previous liquidity zones
✅ Place SL below the curve or zone rejections
✅ Avoid entering trades inside expanding zones – wait for structure confirmation
🔖 Conclusion
This BTCUSD setup showcases a masterclass in smart money behavior using the Mind Mapping Concept (MMC). From trap to breakout, every move is cleanly mapped, providing a strong edge to traders who understand institutional footprints.
Whether you're a scalper, day trader, or swing trader, incorporating MMC curve support and liquidity logic can take your trading precision to the next level.
BTC Faces Critical Resistance—Breakout or Further Decline?FenzoFx—Bitcoin continues its bearish trend after hitting its 2025 all-time high at 113,165. BTC/USD is currently trading near $105,400, a high-volume area where price could either bounce or break lower.
The key resistance level rests at $103,170, supported by a bullish Fair Value Gap. If price holds above this zone, Bitcoin could rise toward $107,090.
However, a close below $103,170 would invalidate the bullish outlook, with the next bearish target at $99,435.
BTCUSD Weekly Structure Analysis – Bearish Trend + Target🔍 Overview:
Bitcoin has shown us a classic market structure shift, moving from bullish strength into a clear bearish retracement, all while respecting major zones and smart money concepts. This current price action highlights a Bearish Break of Structure (BOS), followed by a continuation move toward a key demand zone, which we are eyeing for the next potential reversal opportunity.
🧩 1. TRC Breakout & Early Bull Run
The chart shows a strong bullish phase starting from November 2024, which peaked in late May 2025.
The TRC (Trendline Resistance Channel) Breakout marked the shift from lower highs to higher highs.
This breakout was the initial sign of bullish strength, leading to a break of structure (BOS) around the $108,000–$110,000 level.
⚠️ 2. BOS Confirmed – Structure Starts to Crumble
Once price reached the reversal area near $112,000 (supply zone), we saw a failure to form new highs.
The Bearish BOS was confirmed when price failed to hold support and aggressively broke below the previous higher low.
This BOS is our first confirmation of trend exhaustion and a transition into bearish structure.
🧠 3. Structural Analysis & Smart Money Behavior
Notice how price moved sideways near the top before dropping — a typical distribution phase.
This is where smart money distributes positions to retail buyers at the top before the markdown.
After the BOS, each lower high confirmed the bearish market structure, with no strong bullish CHoCH in sight.
🧱 4. Major CHoCH & Interchange Zone
Look lower on the chart — the SR Interchange Zone around the $76,000–$78,000 area is significant.
This acted as resistance in early 2025, flipped into support later, and now stands as a potential Major CHoCH (Change of Character) if price revisits and reverses here.
If price respects this zone again, it could mark the next bullish accumulation phase.
🎯 5. Current Target: $83,000–$85,000 Zone
Based on structural behavior, liquidity voids, and past interaction, our short-term target is the $83,000–$85,000 demand zone.
This area is marked as “Target + Next Reversal” on the chart.
We expect either:
A reaction and reversal from this zone
Or a deeper push toward SR Interchange depending on volume and macro triggers
🧮 Key Technical Breakdown:
Component Observation
Trendline Break TRC Breakout in February
Bullish BOS Confirmed around $108,000
Reversal Area ~$112,000 (Supply/Distribution)
Structure Shift Bearish BOS confirmed
Current Target $83,000–$85,000
CHoCH Potential $76,000–$78,000
Bias Bearish short-term
🧠 Trading Wisdom:
“Structure tells the story — price action confirms it.”
Always analyze shifts in structure, not just candle patterns. BOS and CHoCH are some of the most reliable tools in understanding true market intent, especially when aligned with high-volume reversal areas.
✅ Final Thoughts:
Bitcoin is currently in a controlled retracement phase, and we are watching closely how price behaves near the $83K–$85K demand zone. If that fails, the deeper SR Interchange at ~$76K becomes the next high-probability zone for long entries.
This is a time to be patient, analyze clean structure, and ride with smart money, not against it.

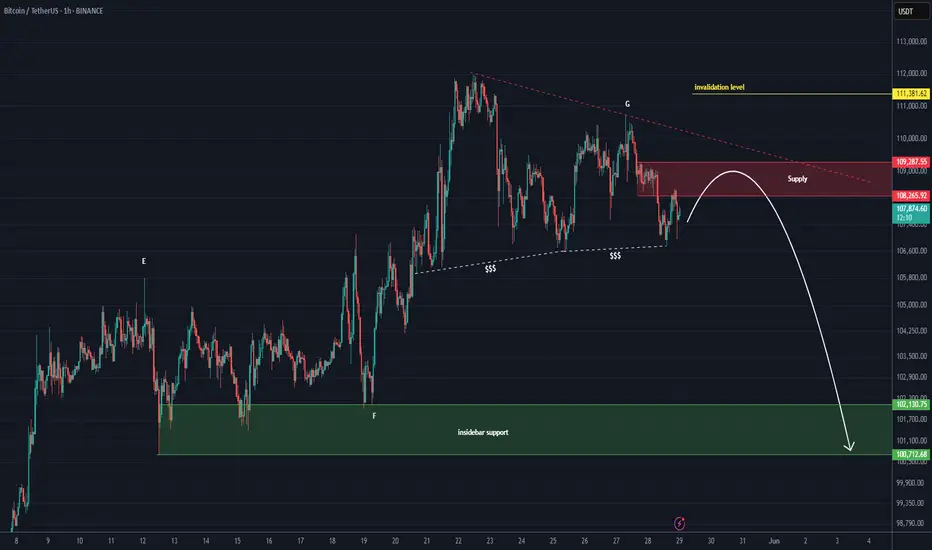
Bitcoin is bearish | stay cautious (1H)This analysis is an update of the analysis you see in the "Related publications" section
We have been warning about a potential Bitcoin correction for some time. It appears that wave G has ended, and key levels have been lost. If the price reaches the red box, it is expected to be rejected downward.
The green zone is a relatively strong support area for Bitcoin, and we should closely watch this level.
A daily candle closing above the invalidation level would invalidate this analysis.
For risk management, please don't forget stop loss and capital management
Comment if you have any questions
Thank You
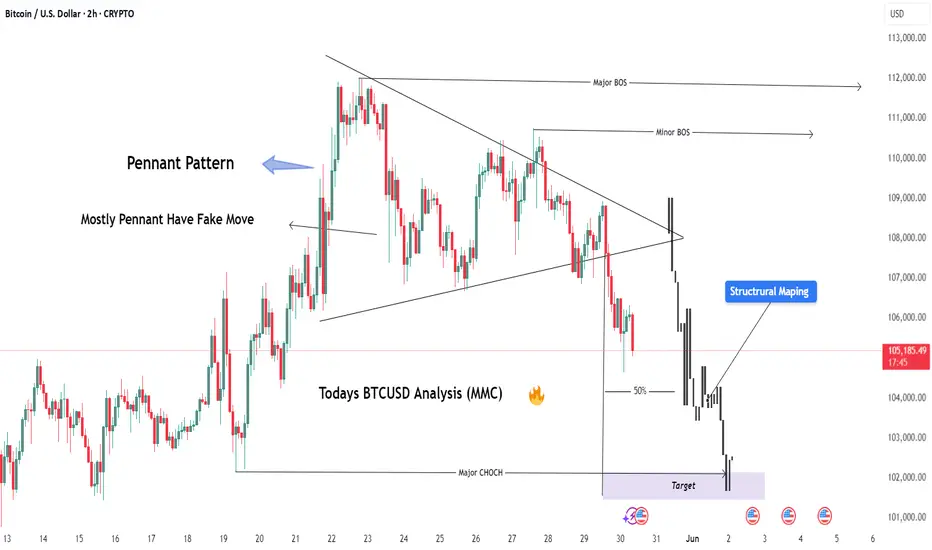
BTCUSD Breakdown from Pennant – MMC Structure Analysis + Target🧠 Introduction: Why This Chart Matters
Bitcoin recently provided a textbook example of market manipulation, where the price action formed a bullish-looking pattern (Pennant), trapped traders with a fake breakout, and then reversed strongly to the downside. By using Mirror Market Concepts (MMC), we can clearly see the logic behind this move—how the market mirrored a previous pattern and fulfilled a predictable target zone.
This analysis breaks it all down, step-by-step, for both educational and practical trading purposes.
🔍 Detailed Chart Breakdown:
1️⃣ The Illusion – Bullish Pennant Formation
Initially, BTC/USD formed what looked like a bullish pennant—a common continuation pattern in technical analysis. The pattern appeared after a sharp upward move, followed by converging trendlines suggesting consolidation.
Retail traders often anticipate a breakout above the pennant as a sign of bullish continuation. This is where the trap begins.
Why It’s a Trap: The pattern looked clean and reliable—but the context told another story. This move was designed to lure breakout traders into long positions right before a reversal.
2️⃣ The Fakeout – Liquidity Grab Above the Pattern
Shortly after the pennant formed, price pushed above the upper trendline, triggering breakout entries and stop losses of short-sellers. But instead of continuing up:
The price reversed sharply.
This aggressive move confirmed the fakeout.
This is a classic example of a liquidity hunt, where the market moves briefly in one direction to gather orders before executing the real move.
📌 MMC Insight: This behavior mirrors a prior setup—price previously faked upward, then dropped to a key demand zone. The mirror pattern gives a clue that the same outcome might repeat.
3️⃣ CHoCH – Change of Character Confirmed
After the fakeout, BTC broke below a key internal support and trendline structure, signaling a CHoCH (Change of Character)—a shift from bullish to bearish market control.
This moment is crucial:
It confirms the smart money’s intention.
It signals that the previous bullish move was just a setup.
Sellers now have control.
💡 Pro Tip: CHoCH is one of the earliest and most reliable signs of a reversal when combined with liquidity patterns.
4️⃣ Trendline Break & Structural Sell-Off
The break of the trendline following CHoCH solidified the bearish direction. This was the best confirmation-based entry point, as the structure flipped and began forming lower highs and lower lows.
5️⃣ Target Fulfilled – Previous Demand Zone Hit
The price then continued down aggressively and hit the marked MMC target zone. This area coincided with:
A previous demand zone (where buyers stepped in before).
A Mirror Market reversal point, seen earlier in the chart.
This fulfillment of the MMC target validates the entire analysis—from trap to reversal to target.
🎯 Key Zones:
Fakeout High: $69,600 area (liquidity sweep)
CHoCH Break Level: Around $69,100
Trendline Break Confirmation: $69,000
Final Target Zone: $68,500–$68,700
📈 Trading Strategy Recap:
Entry Idea: Enter short after CHoCH and trendline break
Stop Loss: Above fakeout high ($69,600+)
Take Profit: MMC demand zone ($68,500–$68,700)
This trade offered excellent risk-to-reward and confluence using multiple tools (MMC, CHoCH, structure, liquidity sweep).
🧠 What You Can Learn from This Setup:
Patterns Can Lie: A pattern like a pennant isn’t enough—context is key.
Liquidity Is King: Understand where the market needs to go to collect orders.
Mirror Market Concepts Work: Historical behavior often repeats in reverse. Use MMC to forecast likely outcomes.
CHoCH is Powerful: It's your early alert system for trend changes.
🔎 Final Thoughts:
This BTC/USD chart is a powerful example of how smart money operates—with manipulation, pattern traps, and mirrored market behavior. If you’re a price action trader or use MMC, this breakdown is a must-study.
Don't just trade patterns—trade context. Look for traps. Use MMC. Watch CHoCH. And always have a mapped target based on structure.
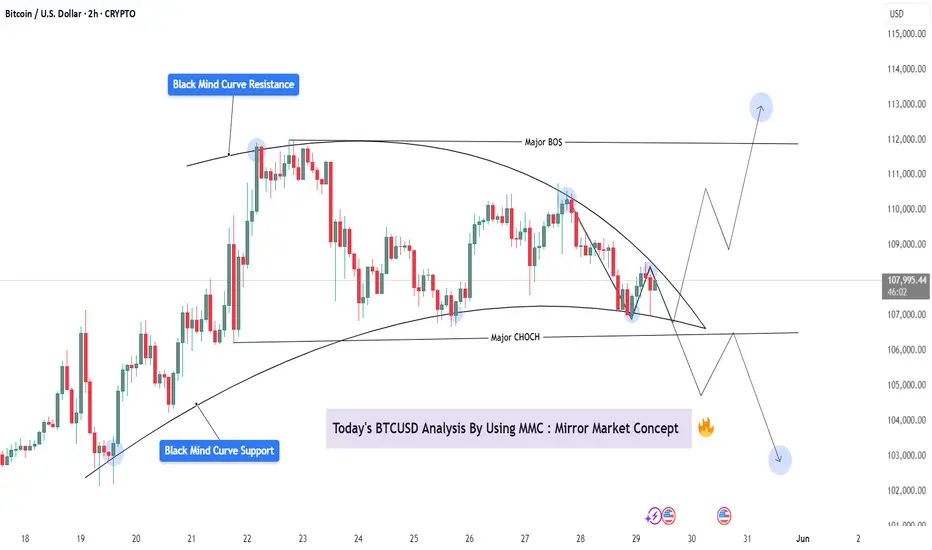
BTCUSD Analysis – Mirror Market Concepts (MMC) Action + Target🧭 Mirror Market Concepts (MMC) Explained
Mirror Market Concepts analyze repeating emotional and structural patterns in the market—like looking at a price “mirror” that reflects past movements into the present. Core tools include:
Mind Curve Resistance/Support
CHoCH (Change of Character)
BOS (Break of Structure)
Price Reflection Zones
These tools let us understand not just what price is doing—but why it's reacting at specific levels.
📊 Technical Breakdown of the Chart
🔹 1. Black Mind Curve Support & Resistance
The chart is framed between a rising support curve and a descending resistance curve, forming a psychological squeeze zone.
These mind curves represent subconscious institutional memory—where reactions often repeat based on historical liquidity and risk-off/on behavior.
🔹 2. Major CHoCH (Change of Character)
Price broke below a previous minor higher low, shifting sentiment from bullish to neutral/bearish.
This CHoCH happened within the mind curve boundary, signaling that we’re transitioning into a decision phase.
🔹 3. Major BOS (Break of Structure)
The BOS occurred during the recent drop, confirming sellers took temporary control.
However, price respected the lower mind curve support, which may still hold as the "mirror zone."
🔹 4. Key Compression Pattern (MMC Symmetry)
Price is forming a symmetrical wedge between the two curves, often seen in MMC just before a major explosive move.
The pattern resembles past behavior where price compressed before breaking out in either direction.
🎯 Potential Scenarios (Plotted on Chart)
📈 Bullish Path:
If BTC breaks above the descending curve + confirms above 109,000, we may see:
✅ Target 1: 111,000 (BOS retest)
✅ Target 2: 112,500–113,000 zone (previous emotional high + liquidity sweep)
📉 Bearish Path:
A breakdown below 107,000 and curve support suggests sellers regain control:
⚠️ Target 1: 105,000 (local demand zone)
⚠️ Target 2: 102,500–103,000 (full MMC retrace)
⚠️ Watchlist Considerations:
Two key economic news events (highlighted on chart) could serve as catalysts.
Wait for confirmation and volume breakout before committing to either side.
This is a textbook MMC compression pattern, and patience is key before reacting.
🧠 What Makes This an MMC Setup?
🔄 Mirror Reflection of past rallies and drops forming current wedge
🧩 Mind Curve Boundaries acting like subconscious trend guides
🔁 CHoCH + BOS sequencing for momentum shift detection
💡 Psychological memory zones holding strong reactions
📌 Summary
BTC is caught in a psychological squeeze between mind curve support and resistance.
Structure favors a coming breakout or breakdown, but confirmation is critical.
MMC tools show a high-probability setup—either toward 112K or 103K based on where the breakout happens.
📣 Community CTA (Call-to-Action):
📊 How are you trading this BTC curve compression?
💬 Share your charts, setups, or alternate views below. Let’s decode the market mirror together.