#Bitcoin Recovers, Trend Remains Bearish With Support at $22.5kPast Performance of Bitcoin
Bitcoin is firm when writing, springing higher from the $22.5k support line. BTC is up two percent in the last 24 hours, steady, and likely to build on yesterday's gains. Even though prices are inside the bear bar of February 9, gains are with rising volumes, pointing to participation, a net positive. As we advance, traders can search to fade the primary bearish trend, especially if today closes as a solid bar.
#Bitcoin Technical Analysis
BTC is inching higher. Volumes are relatively firm, considering the lull of the past few trading days. However, volumes are comparatively lower than those of February 9. In the days ahead, conservative traders can wait for a clean break above $23k, reversing the losses of the mid-last week. Notice that bears are still in control from an effort versus result perspective, especially considering buyers have yet to recover losses. February 9 will define the short-term going forward. Losses below $22.5k with rising volumes mirroring last week may trigger a sell-off towards $18k in a bear continuation formation.
What to Expect from #BTC?
Considering the trend of the past few months, buyers may have the lead. Prices are moving inside the bull range from November lows to February highs. Nonetheless, BTC remains in a bearish breakout formation with caps at $23. Bears have the upper hand if buyers break above this line, reversing losses.
Resistance level to watch out for: $23k
Support level to watch out for: $22.5k
Disclaimer: Opinions expressed are not investment advice. Do your research.
Bitcoinanalysis

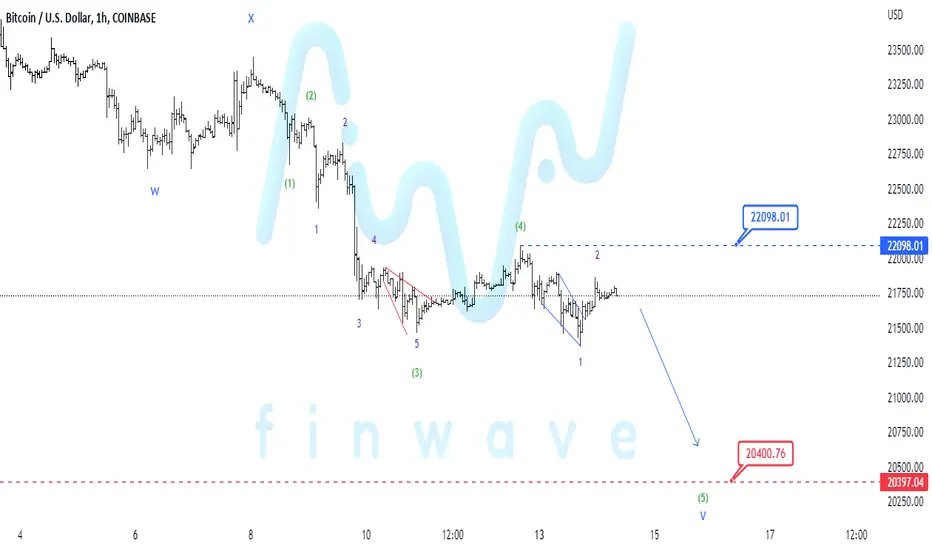
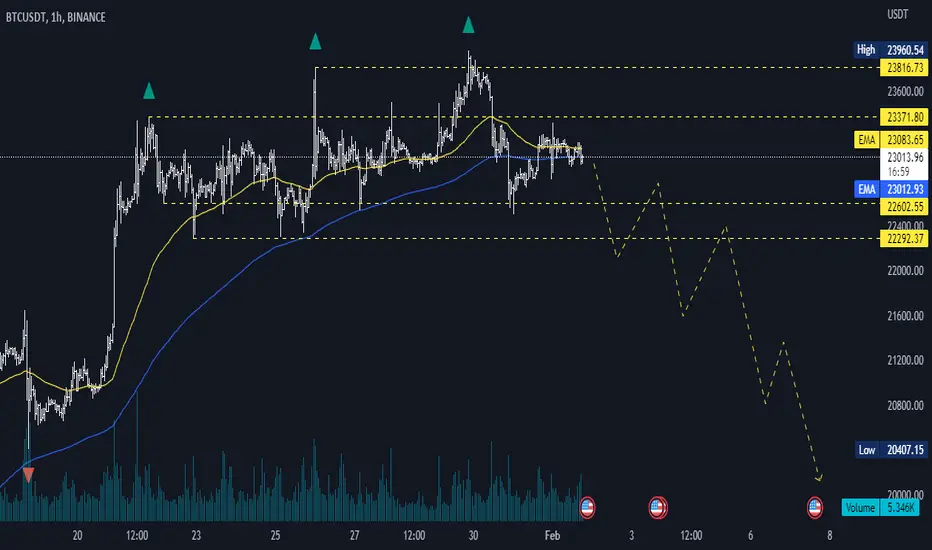
Financial Wave. BTCLet's consider Bitcoin movement in more detail. Our priority variant remains the same, continuation of decrease in a small wave (5) can lead the price of BTC to 20400$, growth of the price above 22098$ cancels this scenario.
#Bitcoin under Pressure, BTC May Drop To As Low as $18kPast Performance of Bitcoin
The bitcoin price is lower at spot rates, down five percent in the last trading week. From the daily chart, BTC remains within a bearish breakout formation, below the bull flag. On February 13, prices edged lower as the bar aligned with the lower BB, signaling broader weakness across the board. Presently, sellers remain in control, a preview that is valid as long as BTC is trading below $22.5k.
#Bitcoin Technical Analysis
Sellers are in control as per the current price action. As aforementioned, traders can search for entries as long as prices are below $22.5k. The immediate support line lies at $21.5k and last week's lows. There will be more opportunities for traders should BTC prices slip below this line. In that eventuality, traders can double down, aligning with the bear bar of February 9 as they target $20k and $18k in the days ahead.
What to Expect from #BTC?
The path of least resistance is southwards. This development is primarily because of the deteriorating macro factors. Any dip below $21.5k may fast-track the sell-off that may see BTC dip to as low as $18k, the 78.6 percent Fibonacci retracement line of the November to February trade range.
Resistance level to watch out for: $22.5k
Support level to watch out for: $21.5k
Disclaimer: Opinions expressed are not investment advice. Do your research.

Price action Showing Massive Bulish signs Forming Expanding Triangle In 3 day timeframe Counter trendline Has Already broken Retesting In Process Incase Of successful Retest expecting More Towards 95k In Next few months

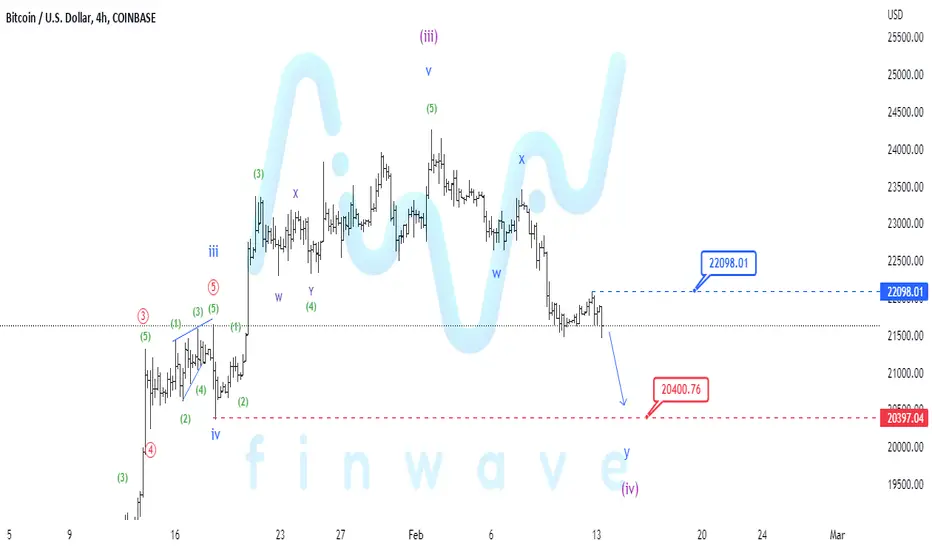
Financial Wave. BTCOur priority scenario in BTC is a continuation of the decline in wave iv towards $20,400. An increase in the price of Bitcoin above $22,098 cancels this scenario.
#Bitcoin Sideways Movement, BTC Is Bearish Below $22.5kPast Performance of Bitcoin
Bitcoin is down from recent highs and steady when writing. From the daily chart, prices remain in a tight consolidation, marking the general state of affairs over the weekend. As it is, the failure of buyers to reverse losses and push higher indicates that bears are still in control. Most importantly for traders, the February 9 bear breakout bar validates the short-term trend.
#Bitcoin Technical Analysis
BTC is within a bear breakout formation following last week's slip below the bull flag and support line, now resistance, at $22.5k. Though there are higher highs relative to the lower BB, the February 9 bearish engulfing bar sets the pace. From an effort versus result perspective, traders can still find shorting opportunities below the resistance line at $22.5k. However, losses below last week's lows at around $21.5k may see BTC drop toward $20k in a bear-trend continuation formation.
What to Expect from #BTC?
Traders remain confident from a top-down preview. In the near term, how prices react at $22.5k on the upper end and $21.5k would shape BTC going forward. Technically, Bitcoin sellers are in a commanding position, and prices may drop to new February lows in sessions ahead.
Resistance level to watch out for: $22.5k
Support level to watch out for: $21.5k
Disclaimer: Opinions expressed are not investment advice. Do your research.
#Bitcoin Breaks Out Below the Bull Flag, Back to $21.5k?Past Performance of Bitcoin
Bitcoin prices fell on February 9, candlestick arrangement reveals. The coin is down three percent in the last trading day and eight percent in the previous week. The trend is shifting, favoring sellers after a strong performance from mid-December 2022.
#Bitcoin Technical Analysis
Bitcoin prices fell yesterday, dropping below the middle BB and the support line of the bull flag. Since the breakout is with rising trading volumes, traders might find entries to short the emerging trend. Every high towards the former support line at $22.5k presents trading opportunities for traders to short. The first bear target, emerging from this formation, will be previous resistance, now support at $21.5k. Further losses may see BTC slip to the 50 percent Fibonacci retracement level of the December to February peaks trade range at $20k.
What to Expect from #BTC?
The cool-off was expected after the past few weeks' surge. The path of least resistance, following the breakout, is southwards. Unless otherwise there is a strong surge, reversing yesterday's losses, traders can set their targets at $1.5k in the near term.
Resistance level to watch out for: $22.5k
Support level to watch out for: $21.5k
Disclaimer: Opinions expressed are not investment advice. Do your research.

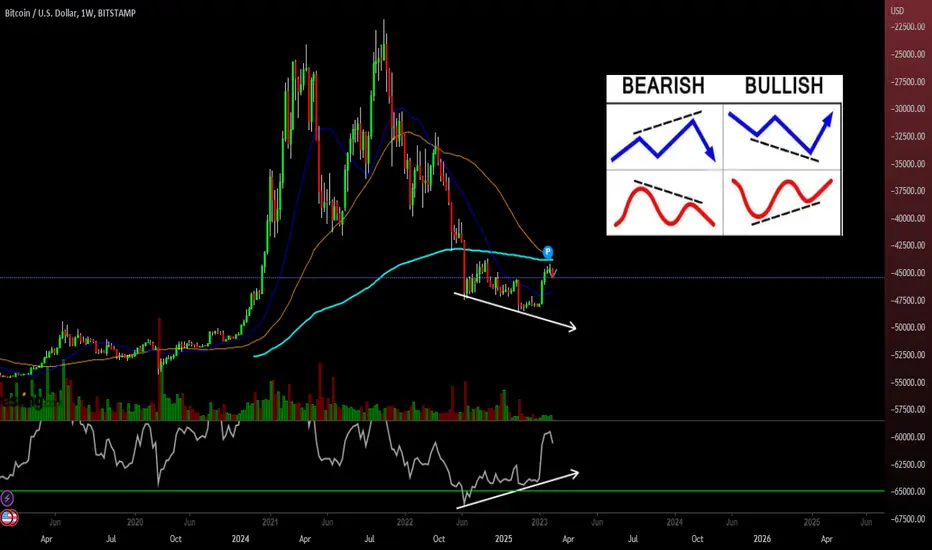
Bitcoin analysis per week ( Divergence ) 📉📈Divergence is one of the well-known and widely used methods for determining price reversal areas, whether positive or negative, and thus helps to determine entry or exit areas 📉📈
Divergence can be used with momentum indicators in general like: '' MACD ''-'' RSI ''-'' Stochastic oscillator ''.
We notice in the picture a difference between the price on the chart and the '' RSI '' indicator,
So now the price is in a downward trend opposite the indicator that is in an upward direction, and this indicates an upcoming positivity.📉
Divergence is one of the many trading methods that we use to build an integrated strategy, and of course, we can use it in any time frame we want ✍️
⚠ You must wait for a signal or entry sign in order to buy bitcoins.
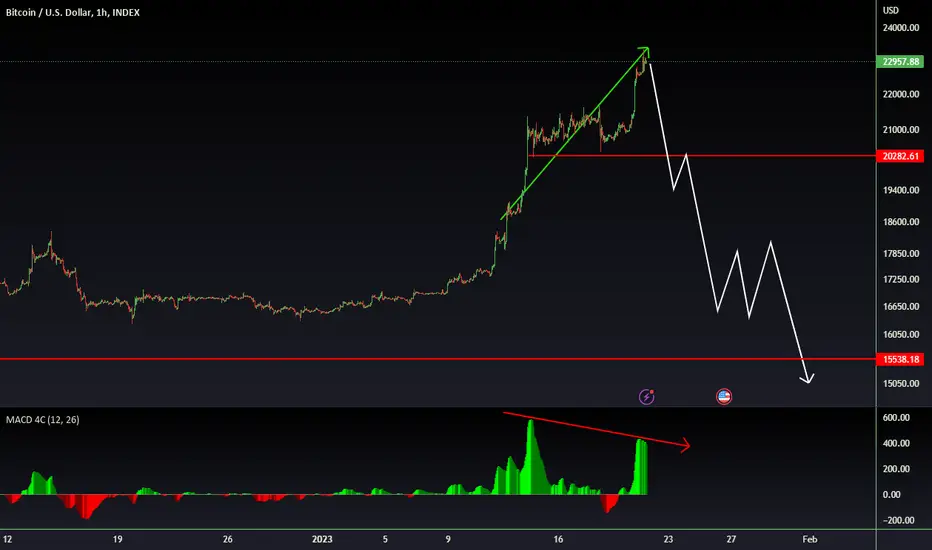
BTCUSD💥1H-TIMEFRAME ANALYSISBTCUSD💥1H-TIMEFRAME ANALYSIS
💗Hello ladies and gentlemen
This is my new idea for 💥BITCOIN
I hope my idea is clear
Support me by like and share thank you
Stay Safe💯💲💲💲
Good luck💰😍
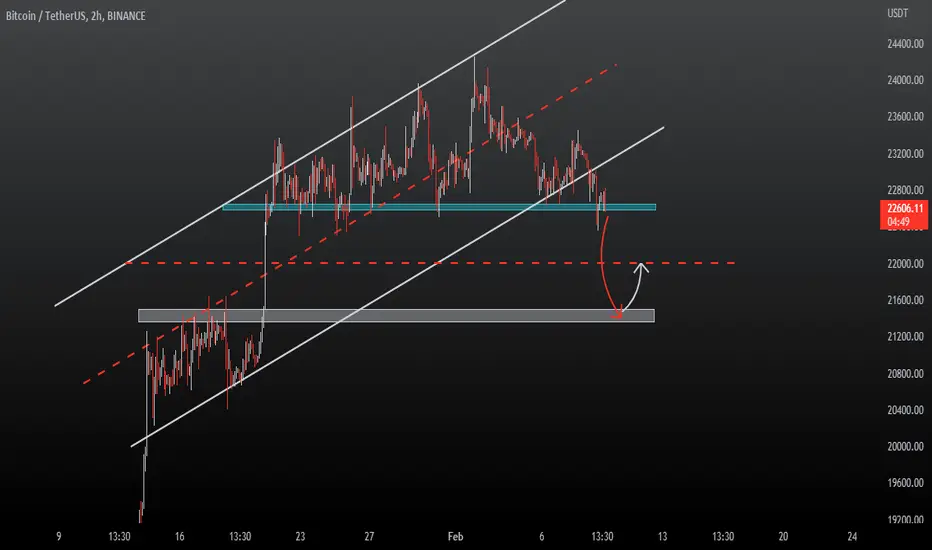
Bitcoin will fall to a historic price!Bitcoin | BTCUSD | Bitcoin vs US Dollar | Bitcoin vs Tether | BTCUSDT
This idea for Feb 8, isn't right and cannot happen
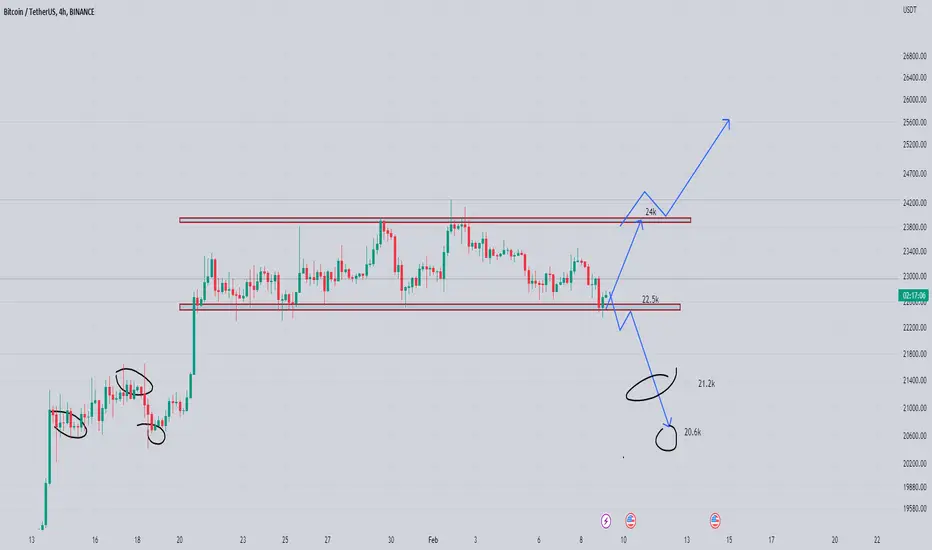
Btc Moving In RangeCurrently Ranging Incase of bounce from lower support Expecting 1 More Test Towards Resistance 24k
Incase Of Downside Breakout Expecting Test Of Support As A First Stop 21.2k & 2nd 20.6k
Incase Of Upside Breakout Expecting Massive Bounce In Coming Days
BTC major move to the downside imminent In this video I've analysed BTC and its price action then I analysed liquidation cluster of bitocin and where the liquidity is after that I analysed SPX since its connedted to btc and at the end short DXY review
IMO btc will go up around 23600 or 23200 before going downwards and a slow bleed has been started , there is a head and shoulder play that Ive discussed in the video
Please Boost and comment as it motivates me for more videos
Also is video better or picture ?
Thanks for watching

#Bitcoin Consolidates inside a $1.5k Range, Bulls Retain ControlPast Performance of Bitcoin
Bitcoin prices are volatile at spot rates, reading from the performance in the daily chart. Prices edged lower yesterday, only for bullish pressure to develop during the New York session. Overall, buyers stand a chance, provided prices are inside the bull flag. In the days ahead, traders can watch how prices react either above$24k or below $22.5k support.
#Bitcoin Technical Analysis
As mentioned earlier, BTC prices have support at around $22.5k. This is a critical level, also flashing with the base of the flag. As prices consolidate between $24k and the support, swing traders might take their profits on every attempt higher. Meanwhile, conservative traders might wait for entries on breakout in either direction. Any surge above $24k may trigger demand, lifting the coin towards $25k or better. Conversely, losses may see BTC slip to $21.5k in a retest. Ideally, any breakout must be with rising trading volumes above the recent averages.
What to Expect from #BTC?
Bulls are in control despite the recent lower lows from the upper BB. This indicates that upside momentum is waning. Nonetheless, buyers remain in control unless there is a definitive close in either direction.
Resistance level to watch out for: $24k
Support level to watch out for: $22.5k
Disclaimer: Opinions expressed are not investment advice. Do your research.

#Bitcoin - thoughts out loud #2 Good afternoon, dear colleagues!
Dear colleagues, I sincerely thank you all for your attention and wish success to everyone!
And remember one thing:
"sometimes you win/sometimes you learn"
#Bitcoin Prices Inside A Bull Flag, Will Buyers Succeed?Past Performance of Bitcoin
Bitcoin prices are stable at spot rates, steady inside a bull flag as demand for the coin during the New York session supported prices. With the dynamic support line by the middle BB still vital in shaping BTC's short to medium-term formation, traders may look for entries on break out. Any surge above the bull flag may see the coin rallying above $25k.
#Bitcoin Technical Analysis
BTC remains in a tight range, fluctuating inside a bull flag as traders search for entries. As it is, buyers are in control, a net positive for optimistic traders. There will be clarity once BTC breaks out, either above $24k or $22.5k. Ideally, this liquidation should be with rising trading volumes, indicating participation. For buyers, any surge above $24k may lift BTC towards $25k or better. Conversely, losses below the base of the flag might see BTC slide to $21k and January 20 lows of $21k.
What to Expect from #BTC?
The primary trend remains northwards. Nonetheless, there are attempts to slow down the upside. This is expected considering the welcomed expansion from mid-January. Conservative traders can still wait for a clear trend definition before committing, targeting $25k, or $21k, depending on the eventual breakout direction.
Resistance level to watch out for: $24k
Support level to watch out for: $21.5k
Disclaimer: Opinions expressed are not investment advice. Do your research.
