This Is How Professional Traders Figures Out BTCs Next Move!The title is misleading - I am not a professional trader BUT I know how professional traders act.
TL;DR - Bitcoin is at a range low with the break of 30k potentially being a fakeout. Probability still favours bullish extraction of the range especially if the weekly candle closes as a hammer candle. The three patterns (marked 1 / 2 / 3) are potentially patterns that may emerge which will give more probability towards certain paths for future price action.
Probability is the priority of the professional trader. They will NEVER care about catching the "top" or the "bottom" of a move or getting a x100000 home run if it was not done with an understanding of the probability (and risk) behind your trade. Translating this to laymen terms - if you are buying when bitcoin is in the process of selling off and UST is blowing everything up without more thought than "It can't sell off much more!" you are not trading you are gambling and you WILL lose more money than you earn over the course of your life. That is not an opinion - it is a statistical fact.
Professional traders are professional because over the course of their lifetime/thousands of trades, they are able to consistently win. Just like a casino, it doesn't matter how much they win in each trade but if they are consistent in returning profits and can make a regular income from trading. That is it. There is no difference between you and them other than their understanding of when to take a trade because the probability is on their side and when to not get involved. (and ofcourse thier understanding of risk but I will touch on that in a post about risk in the future).
But how do they figure out probability?
A mix of experience, technical analysis and macro-economic sense all combined under the roof of emotional control. So lets work through these factors in relation to Bitcoin above.
1: We are in a range (when price oscillates between two distinct areas - with the range highs being set in January 2021 & Oct/Nov 2021 (60k), and range lows set in June/July 2021 & now (30k)) that has followed a bullish range (when price oscillates upwards, with pronounced higher lows and higher highs). With experience, you learn that more often than not trends continue - I am sure you have heard the term "the trend is your friend". Because of this statistical fact, if you trade on the side of a trend you have a higher probability of winning than losing. As we trended bullish prior to this range forming, regardless of what shape this range takes we already know that there is a statistical probability in favour of the range being broken to the upside. This flavours our buying within the range, favouring buying opportunities rather than shorting.
2: Looking at the pattern of the range we can see an important element that weights bullish probability - a slight break of the all-time high in Oct/Nov. This adds more weight to the probability of bullish extraction because it simply means there were more buyers than sells EVEN AFTER 6 months of Bitcoin "crashing". Ontop of this, sellers took longer to gain control of price than back in January 2021. As time has passed, bullishness has remained or even grown. This tells us value is increasing over time.
3: While the most probable outcome following the break of the all-time-high was a test of a minor pullback support (47k/41k/37k) followed by a reactivation of bullish price action and a break up of the range, we are now back at the range low. This is where emotion comes in. How scary was that sell off?! The whole crypto space died! Yet we are set to close the weekly candle above 30k and that wick below doesn't actually seem too bad when looking at it from such a large timeframe (weekly - ignore the 15min/1h/4h/1D - those timeframes are much more chaotic/random and are superseded by the superiority of weekly and monthly trends (macro-trends)).
Given all of the above the professional trader is able to understand the wider picture and look beyond the emotions and news of the last few days. There is a statistical probability of us breaking the range to the upside AND we are sat in a buy area (as we are at the range low). Despite the massive sell off, we are failing to make significant candle closes below range supports and so now the professional trader (having established the overall theme/context they are trading in (bullish tainTed range with bullish elements and a potential range fakeout / stoploss hunt) will zoom in and look at candlestick patterns to determine probability further:
Check out the "Area of Interest". We are about to close the weekly candle in a shape that is referred to as "A Hammer Candle". Understanding what happened during the course of this candle lets us understand how probable future price action is as a point of entry rather than in the wider bullish range context.
A Hammer candle is formed when the candle opens high, sellers push price lower, buyers step in and push price back up, and then the candle closes near its opening price. When this candlestick appears around a support area, it means that buyers have bought the support, fending off a bearish attack where sellers were too weak to break down the support. While it does not tell us the future, it does give us an understanding of price action and a favourable probability to buy as it is evidence that buyers are active and the support has a strong chance of not breaking.
A hammer candle is nothing without a confirmation candle. This is needed to either undermine the bullish argument or confirm it as we can not trade simply on the hammer candle (it alone is not enough information to accurately gauge probability).
I have listed 3 potential candles that might emerge next week and listed them in terms of what probability they will apply to the bullish/neutral/bearish arguments (NOTE there can be an infinite number of candles following this weeks close - while many people think trading strategies are extremely complex, they can be just as simple as identifying a favourable context and waiting for one of these very simple patterns to emerge).
1: Bullish - This artistically drawn picture of a candle following our hammer is called 'A bullish engulfing candle'. Here, price opening low and closing above the head of the hammer candlestick gives more weight to further bullish price action. It shows that sellers were unable to take over price again, and bulls were able to push price higher than that of the "sell-off" candle and retain price up there. Combined with a hammer AND the bullish nature of this range we would be able to understand that there is a pretty significant probability of ATLEAST the middle of the range if not range highs being tested.
2: Neutral - Doji / Spinning Top. This candlestick shows us that at some point during the candlestick, buyers tried to push price higher and sellers beat them back, but also sellers tried to push price lower and buyers bought them out. Buyers and sellers are evenly matched and so price is hesitating. While this is neutral, price should not linger too long at supports (ideally you want to see lots of buyers coming in and pushing price away quickly) and so a neutral candle here would have a slightly bearish taint to it. If this appears, it is likely that price will continue to hesitate around the 30k mark, with a small but favourable probability of further selling. Try and spot the Doji candlesticks in the consolidation back in May/June 2021.
NOTE: I have specifically drawn this candle with a wick that goes ABOVE the high of the hammer candlestick. A common trading strategy for a hammer is to wait for the high to be broken by the next candle, then enter long as a breakout trade (in the hopes that a bullish engulfing will emerge). This is correct BUT an emotional mature trader often waits (especially when macro-economic risk is so high as it is right now), for the candle to close as a failed break out above the hammer high can often occur before sellers come down and push price down nearer the close of the candle. When that happenes, we wick above the high and then close in something like this doji, trapping all those breakout traders in their long positions and adding more weight to any selling pressure if the support were to then be broken and they needed to close thier long.
3: Bearish - Reverse hammer. This says it on the tin - it is the opposite of a hammer candlestick. Buyers tried to push price higher but sellers took over, closing the candle at the lows. This would tell us that there is still lots of sellers keep to get out and undermine the bullishness that the hammer candlestick presents. Notice how one appeared back in May/June 2021 (the week of the 24th of May)? This shows us that after the big drop, buyers tried to catch the bounce but sellers were still present. This indicates sustained selling pressure is more likely to continue, and so there is a statistical probability of further attempts at the lows made over the next few weeks.
Lastly - let's pull EVERYTHING together.
1: We are in a range with a bullish trend beforehand, tainting the range to the bull side.
2: We have a bullish element within the range of a slightly higher high.
This means that any attempt at the range low has a statistical probability of being bought, and the range has a statistical probability of the bullish trend seen prior to the range re-emerging.
This then means any time we are at the range low, it should be seen as a buying opportunity.
1: Wait for appropriate support (30k is extremely strong major support and prior range low).
2: Wait for an appropriate candlestick pattern (hammer in this case)
3: Wait for confirmation to favour bullish price action.
That's it. It's that simple - This is an opportunity for inventory add or a swing trade with a stop below the wick of the hammer candle, and take profit targets at 37k, 47k & between 51-56k.
Trading strategies do not need to be complex (in fact the simpler the better). When I first learnt this I looked down on the lack of complexity - I thought trading was extremely hard and you needed as much information and indicators and colours as possible to eliminate all doubt!
But truth is: That market will go where it wants to. You can not know where that is. You are not an all-knowing being and sadly - all your information is information everyone else knows. Your ego and sense of needing to control are exactly the reason why most people can not trade. The market is the collective knowledge of all participants. Understanding it is akin to understanding the complexity of the human condition (as ultimately participants' wants, fears, greed, knowledge is baked into where they think price should be bought or sold.) Letting go allows you to see the simplicity in chaos, objectively plan for the most probable course of action, then sit back and watch the fireworks!
P.
Bitcoinbullish
THE Bullish Bitcoin Scenario!Welcome Traders, Investors & Gamblers 😃
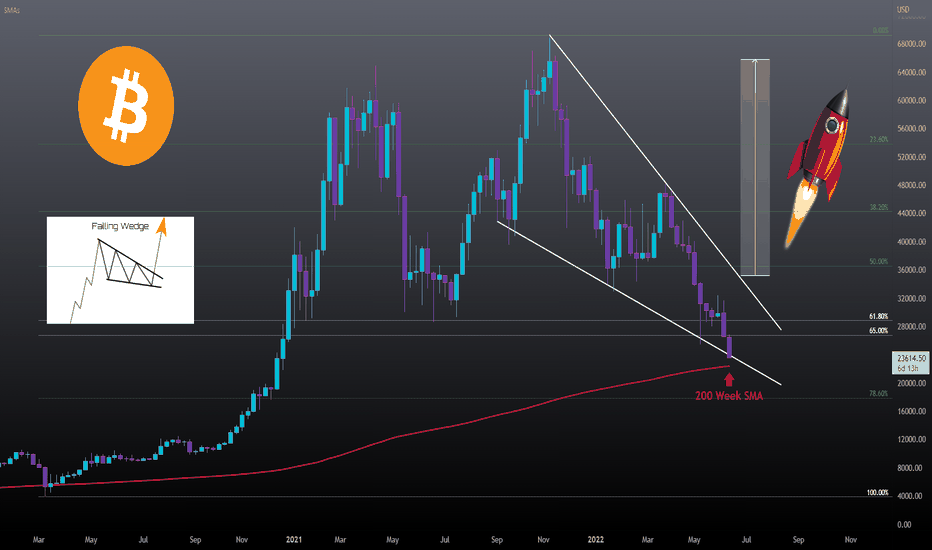
The 200 week SMA the most logical target for Bitcoin on a weekly closing basis all along. I've been talking about it here on @TradingView since at least February.
Now we have perfect alignement with this falling wedge and the 200 week SMA.
Im looking for a wick down to about 20k or even aslow as 17-18k (see 78.6 of Fibonacci Retracement) and then a weekly close above the 200 week SMA and the support of the falling wedge .
The technical breakout target of the bullish pattern would be right around 66k !
I would like to add that this is only for educational purpose and in no way a guarantee that it will play out this way, nor is this or are any of my posts financial advise.
As always, A BIG THANK YOU for stopping by, I hope you liked my post! If you did, please take a second to drop a like or comment, every engagement puts a smile on my face, but also helps me to get my ideas out to many more of you guys! 😃🙏
Happy Trading ✌♥📈
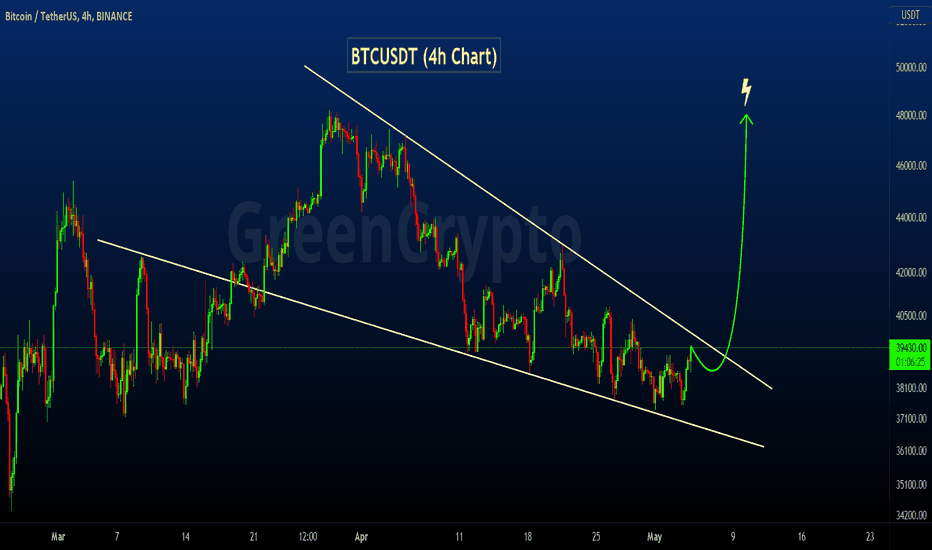
BTCUSDT - Falling Wedge Pattern!!BTCUSDT (4h Chart) Technical analysis
BTCUSDT (4h Chart) Currently trading at $38916
Buy level: Above $39600 (Buy after breakout)
Stop loss: Below $37300
Target 1: $40400
Target 2: $42500
Target 3: $45000
Target 4: $48000
Max Leverage 3x
Always keep Stop loss
Follow Our Tradingview Account for More Technical Analysis Updates, | Like, Share and Comment Your thoughts
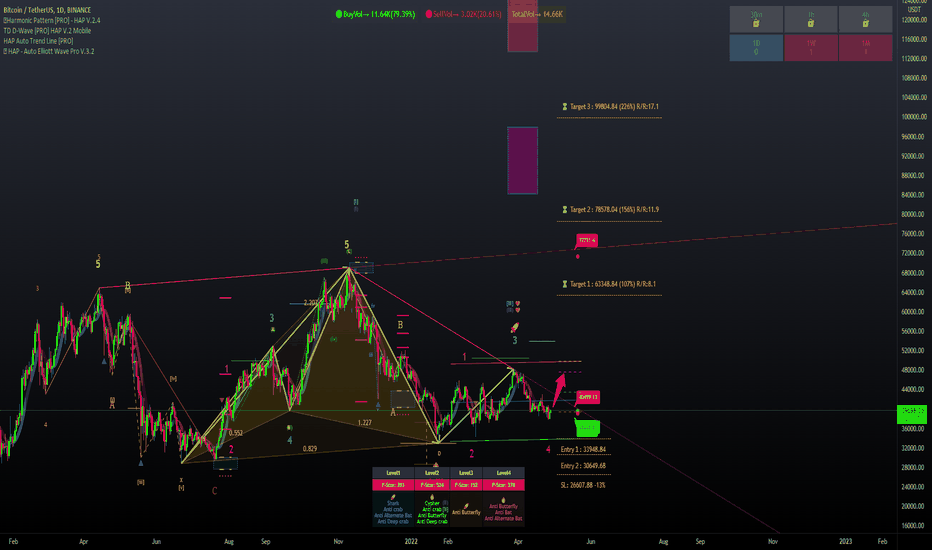
The overview of Bitcoin nowThe overview of BINANCE:BTCUSDT now, when tools are put together, the 37k-39k area seems to be pretty strong support. If so, we are hopeful that the price will move up to the first target, which is expected to be around 63k-72k, while in the short term, there is a chance to be around 47k-49k. Let's wait and see what happens next.
BITCOIN when do the BEARS WIN?What's up everyone! 😃
The answer depends on many factors and we will be looking at a couple of different ones in the form of price acion patterns, indicators and reracements.
------------------------------------
Part 1:
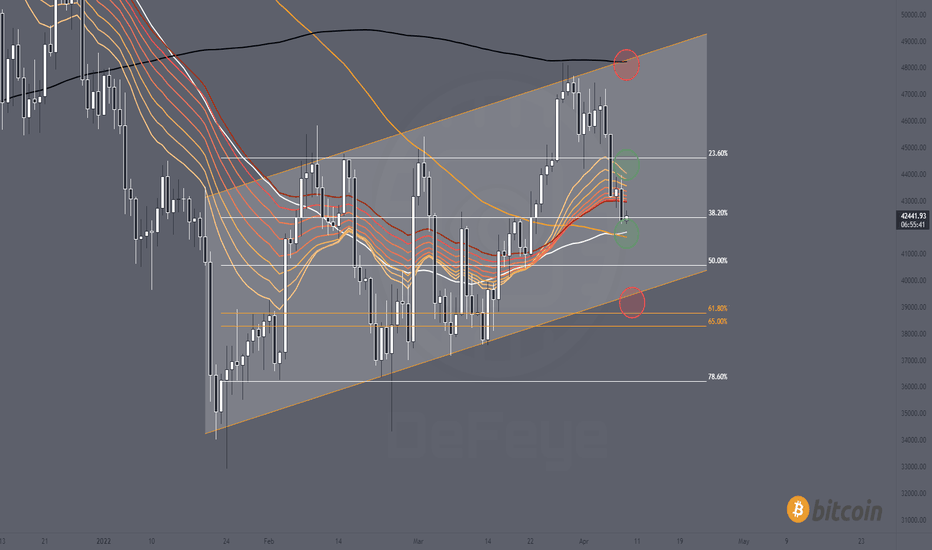
The Daily Chart; Channel life, the daily SMAs/EMAs and the trend's Fibonacci levels.
- The Daily SMAs
50: 41.8k
100: 41.6k
200: 48.2
- The EMA Ribbon
20 Day EMA to Day 60 EMa
44k-43kk
- The ascending channel
Top: 48.300-48.600
Bottom: 38.400-38.800
- The trend's (32.9k-48.2k) Fibonacci retracement
23.6: 44.6k
38.2: 42.4k
50.0: 40.6k
61.8: 38.7k
65.0 38.3k
78.6: 36.2k
-------------------------------------
Next Strong Support (lower green circle):
- 50&100 day SMAs
- The 38.2 level on the trend's Fibonacci retracement
= 42.4k-41.6k
Next Strong Resistance (upper green circle):
- Daily EMA 20
- 23.6 Fibonacci level
= 44k-44.6k
-------------------------------------
Trend support (lower red circle):
To stay in this trend that we are in since January now in form of this ascending channe, we need to hold the bottom of the channel as a worst case scenario.
The good news is that there is more support in that area:
- Ascending Channel support
- 61.8 & 65 Fibonacci levels
= 38.3k-38.7k
Trend Resistance (upper red circle):
(confirmation to the upside with daily close above)
- Ascending channel resistance
- 200 day SMA
= 48.2k - 48.6k
-------------------------------------
Conclusion:
- The bears start winning if we fall below 41.6k and they officially start to take control below 38.3k
- The bulls start seeing a reversal to the upside above 44k and start to take full control above 48.2k
-------------------------------------
I would like to add that this post is meant exclusively for educational purpose and that non of my posts are financial advise.
As always, A BIG THANK YOU for stopping by, I
hope you liked my post! If you did, please take a second to drop a like or comment, every engagement puts a smile on my face, but also helps me to get my ideas out to many more of you guys! 😃🙏
Happy Trading ✌♥📈
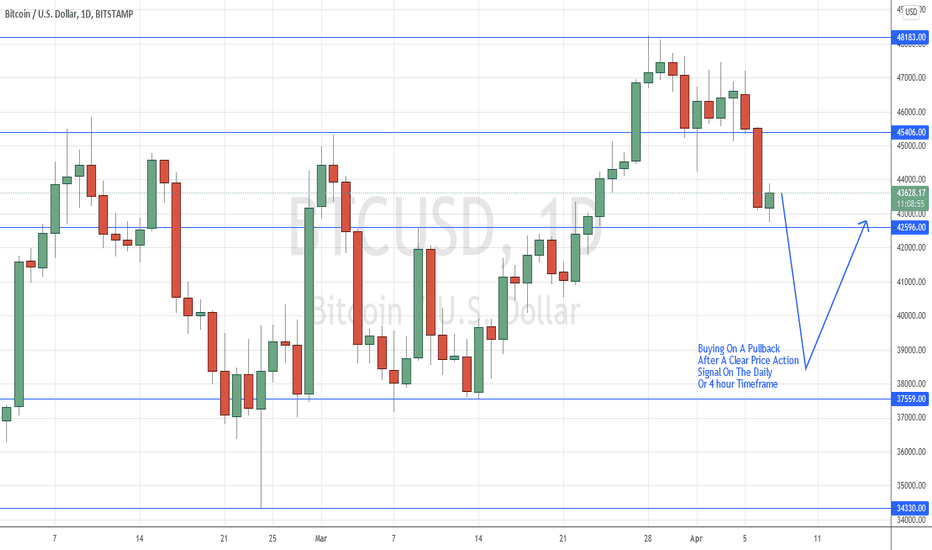
BITCOIN (BTCUSD) – CASH: Buying After A Pullback To Support AreaBITCOIN (BTCUSD) – CASH: Buying After A Pullback To Support Area
(NOTE: As Bitcoin doesn’t form perfectly clean signals most of the time, and as this market has random levels of liquidity and can be very volatile, we will only annotate the clearest and well-pronounced signals that form at confluent areas of the chart. TRADING BITCOIN AND CRYPTO IS HIGH RISK, USE A REDUCED POSITION SIZE UNTIL YOU ARE FAMILIAR WITH THIS MARKET).
Price Action: There is no new price action signal to note at this time.
The prior Bullish Pin Bar Signal from late last week has now failed (We did not consider trading this signal, nor did we mention it).
Potential Trade Idea: We are considering buying on a deeper retracement lower and after a price action buy signal on the daily or 4 hourly chart time frame, at or just above the 37559 short-term support level.
BITCOIN 360k+ Update!Happy Saturday Everyone! 😃
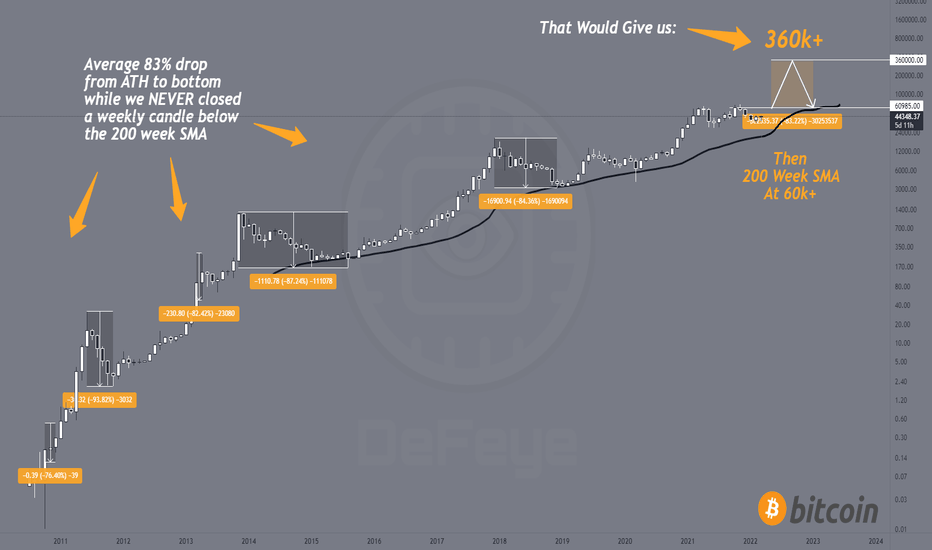
It's been a little over two weeks since my "crazy" post and video where I spoke about why I think that Bitcoin could reach 165k to 360k before we break the uptrend on the larger time frames and fall into a full on bear market.
The original Idea and the follow up video got a lot of traffic and I want to thank all my new followers and @tradingview for the support! 😃🙏
I decided to post an update here on the Monthly BTCUSDT chart for better visibility.
Original Idea:
"...The Idea is simple, as you can see BTC has never fallen below the 200 Week SMA (black line), not even during black swan events like the start of the pandemic in 2020
... Bitcoin hasn't found the top yet as an 85% correction from the current 69k top would take us to about 10k and we would have to break the 200 week SMA which as previously mentioned, has never been broken.
Hence a result, to imitate the behaviour of Bitcoin during and after the ATH's in 2013 and 2017, BTC would have to rally to about 165k before dropping back down to the 200 week SMA..."
Update:
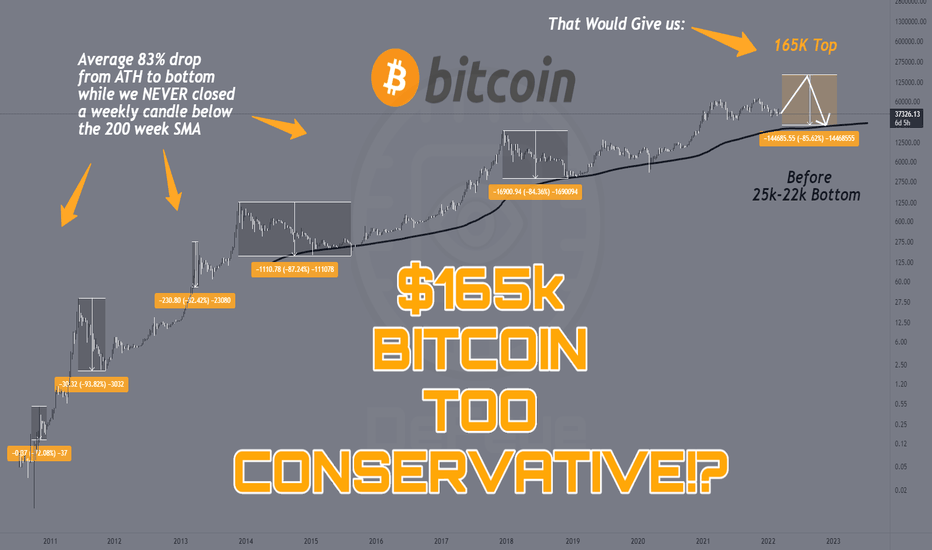
- The average correction after reaching a new ATH was 83% from top to bottom since 2010.
- 360k+ is more likely than 165k top since the weekly 200 SMA reaches 60k+ (rough estimate) after BTC reaches a top of 360k+..
- All ATH's since 2010 are taken into consideration.
Stay tuned for my Bitcoin update video 🎬, where I will discuss the most bullish path to reach those targets of 360k+ ! 📈
I would like to add that this post is meant exclusively for educational purpose and that non of my posts are financial advise.
As always, A BIG THANK YOU for stopping by, I hope you liked my post! If you did, please take a second to drop a like or comment, every engagement puts a smile on my face, but also helps me to get my ideas out to many more of you guys! 😃🙏
Happy Trading ✌♥📈
Bitcoin's Stock to flow and Log Growth Curve suggest upside 30xBitcoin has been boring the last couple of months and has roughly gone sideways in a rather long range for the last year. The price action has been sideways some of the longer term indicators have been priming and suggest that the next move is to the upside.
The stock to flow model comes and goes in popularity with the volatility of bitcoin. When bitcoin is impulsing to the upside people pay a lot of attention to the indicator. Then there are times like we are in right now, when the stock to flow has moved but price action is still roughly sideways. I myself historically have always doubted the stock to flow but it is putting more history behind it and so it seems to be more reliable than I have previously thought.
There are several different versions of log growth curves and I find this one useful. It is subdivided into sectors and I have elected to simplify the curve by showing the top and bottom 14.59% as well as the middle portion of the band. For the last two pumps on the stock to flow bitcoin moved roughly sideways around one of the log growth bands for quite a while before pumping to target or beyond. For the last couple of months price has hopped on top of the lower band I defined and so far has done a good job of finding support.
The Log MACD histogram is beginning to approach zero and the Log MACD is turning up. The hidden bullish divergence increases the probability that we will see a sustained move to the upside. If the last two trend pumps of the stock to flow are suggestive of this next uptrend we will still have to be patience for this move to slowly pick up steam. Hopefully we will see that strength pick up over the next two-six weeks. If the stock to flow ends up being accurate will will have to get a new log growth curve.
First things first will be to see how this weekly pattern resolves. But I have seen plenty of TA around that so I won't replicate it here except to say a move to the top of the weekly keltner is likely, then retesting the horizontal level of the ascending triangle.
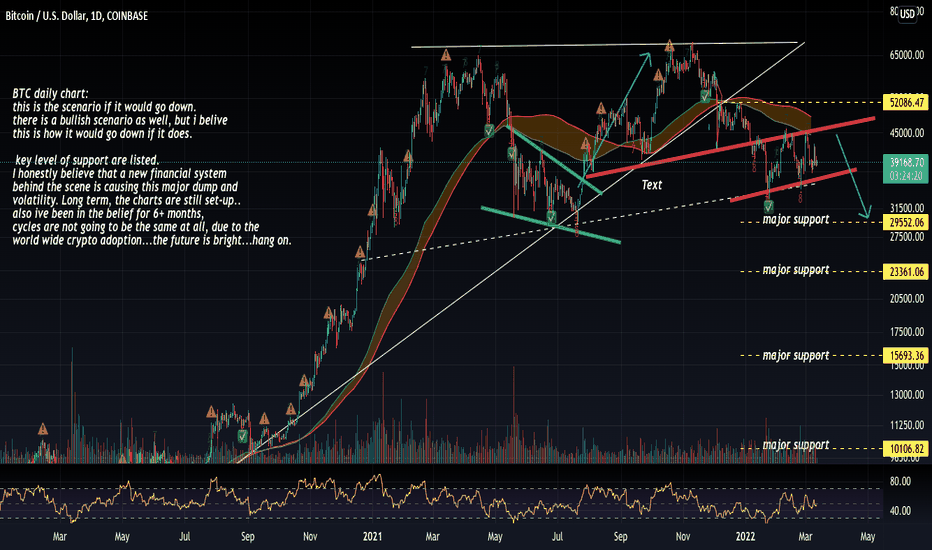
BTC daily bearish scenario, if it were to happen.BTC daily chart:
this is the scenario if it would go down.
there is a bullish scenario as well, but i belive
this is how it would go down if it does.
key level of support are listed.
I honestly believe that a new financial system
behind the scene is causing this major dump and
volatility. Long term, the charts are still set-up..
also ive been in the belief for 6+ months,
cycles are not going to be the same at all, due to the
world wide crypto adoption...the future is bright...hang on.
rememeber, my previous charts show if it brreak the bullish trendline, it would look to go to $52K+...also TESLA and MICRO STRATEGY has there billions of dollars of BTC at $29-32,000 so my opinion, they dont want to lose there money, they would buy it all up at those levels.
BITCOIN 165k before 22k!Happy Sunday Everyone! 😃
This is a mid to long-term bullish scenario for Bitcoin.
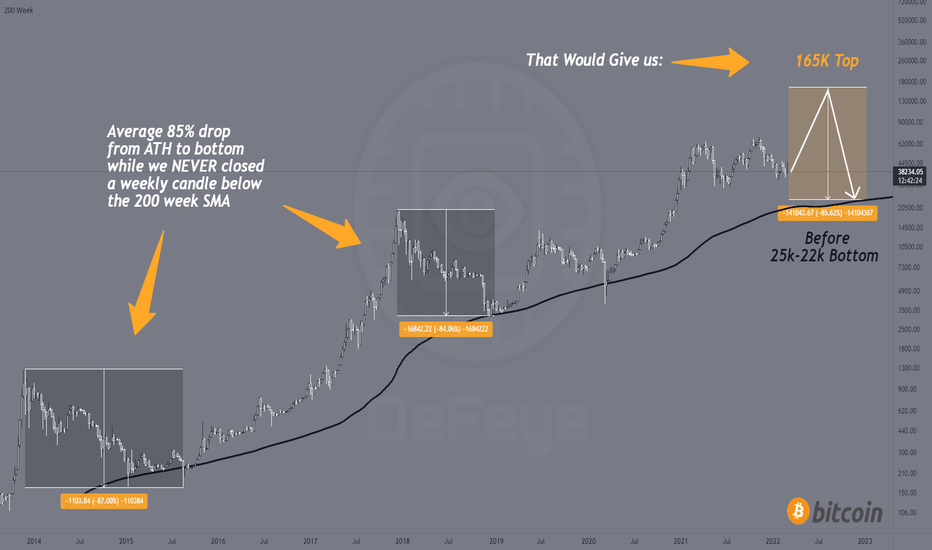
The Idea is simple, as you can see BTC has never fallen below the 200 Week SMA (black line), not even during black swan events like the start of the pandemic in 2020.
We can also see that after the previous ATH's in 2013 and in 2017 , the price dropped roughly by an average of 85% .
The conclusion of this idea is that Bitcoin hasn't found the top yet as an 85% correction from the current 69k top would take us to about 10k and we would have to break the 200 week SMA which as previously mentioned, has never been broken.
Hence a result, to imitate the behaviour of Bitcoin during and after the ATH's in 2013 and 2017, BTC would have to rally to about 165k before dropping back down to the 200 week SMA roughly between 25k and 22k .
I would like to add that this post is meant exclusively for educational purpose and that non of my posts are financial advise.
As always, A BIG THANK YOU for stopping by, I hope you liked my post! If you did, please take a second to drop a like or comment, every engagement puts a smile on my face, but also helps me to get my ideas out to many more of you guys! 😃🙏
Happy Trading ✌♥📈
165k BITCOIN Prediction Too CONSERVATIVE?!Happy Monday Everyone! 😃
The title says it all, I'm going over my very controversial chart from yesterday where I predicted a 165k top for BTC .
I will post an updated more detailed version of the chart in the coming days.
Please make sure to check out my other posts too if you liked this one!
And finally a massive THANK YOU to all of you new followers and THANK YOU to @TradingView for publishing my post on to the front page of the website! 🙏🚀😃📈
I would like to add that this post is meant exclusively for educational purpose and that non of my posts are financial advise.
As always, A BIG THANK YOU for stopping by, I hope you liked my post! If you did, please take a second to drop a like or comment, every engagement puts a smile on my face, but also helps me to get my ideas out to many more of you guys! 😃🙏
Happy Trading ✌♥📈
Bitcoin (btc) set to Start New Trend starting from WEEKLY chart
10 decemeber 2018 considering 12345 waves it ended on 08 nov 2021 considering it as impulse waves
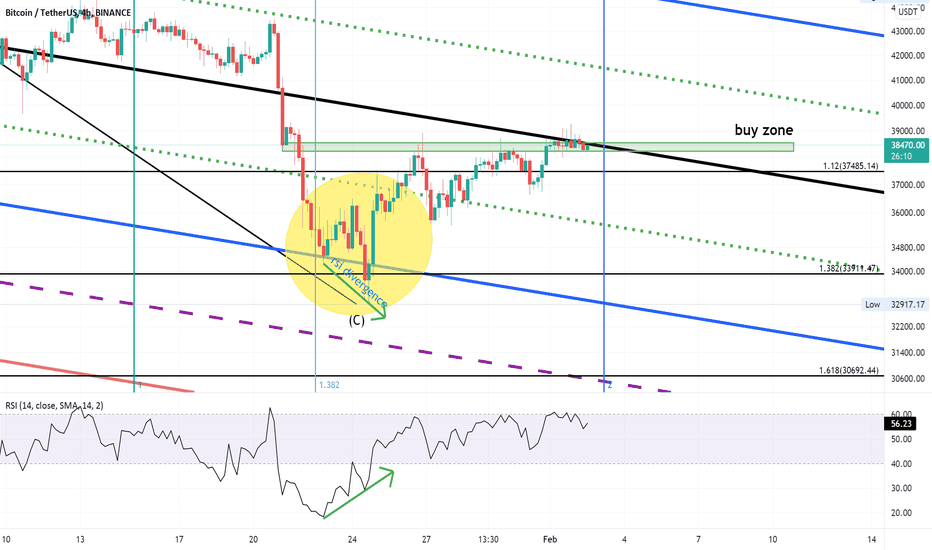
and with that consideration and watching price action CORRECTIVE ABC was formed and connecting fib retracement from A to B, C wave was ended on 1.6 retracement which is a textbook projection
on DAILY chart
marking shicff pitchfork from starting point of ABC wave to AB (0-AB)
found that C wave has halted on lower median on pitchfork we plotted (((confluence 1)))
with the help of trend based fib extension, marking it with same point of pitchfork and connected the remain two points with median of pitchfork
considering ((1.382)) lvl as my golden zone for the price rejection was occurred (((confluence 2)))
as bear market condition are fast and furious the bull markets are big and slow, using TREND BASED FIB TIME, again the ((1.382)) levels were syncing with {MEDIAN + TREND BASED FIB EXT + TREND BASED FIB TIME} (((confluence 3)))
on 4HR chart
the yellow mark price action had bullish RSI divergence
THIS ANALYSIS IS PRE ENTERING THE TRADE
HOW TO TRADE? ? ? ? ?
the green buying zone, as price breakout and retest the zone specifically = 38200 to 38550 (((ENTER)))
it has mostly POSISTIONAL trade the Target has no limit instead using TSL will be great for maximising our profit
will update accordingly ...
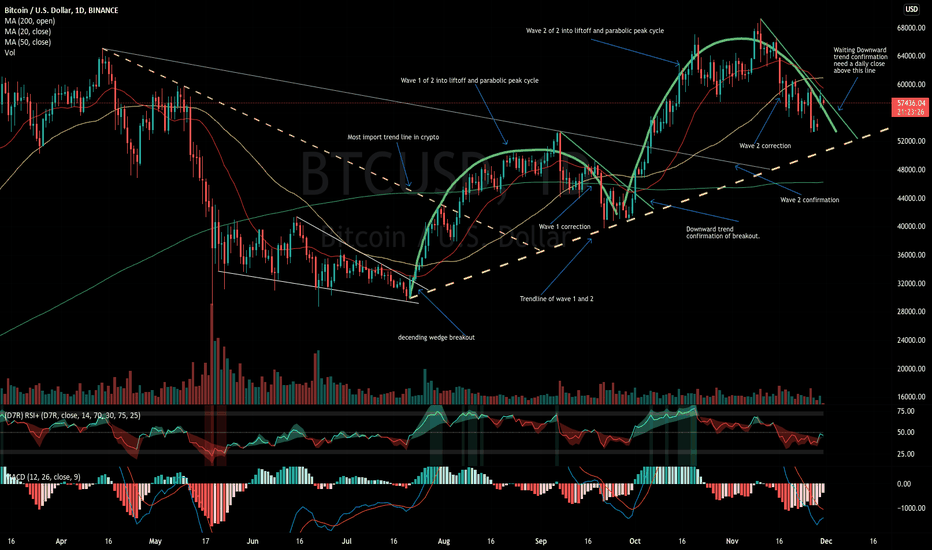
Bitcoin breakout incomingBitcoin has broken away from its mid cycle pullback aka shakeout in its 2021 bull market run. High probability mid cycle low is established now that mid cycle breakout has occurred. 2nd phase of bull market in play. Double wave into liftoff. Cycle peak approximately 150 days from mid cycle low. Price peaks in 2021 assuming low is in.
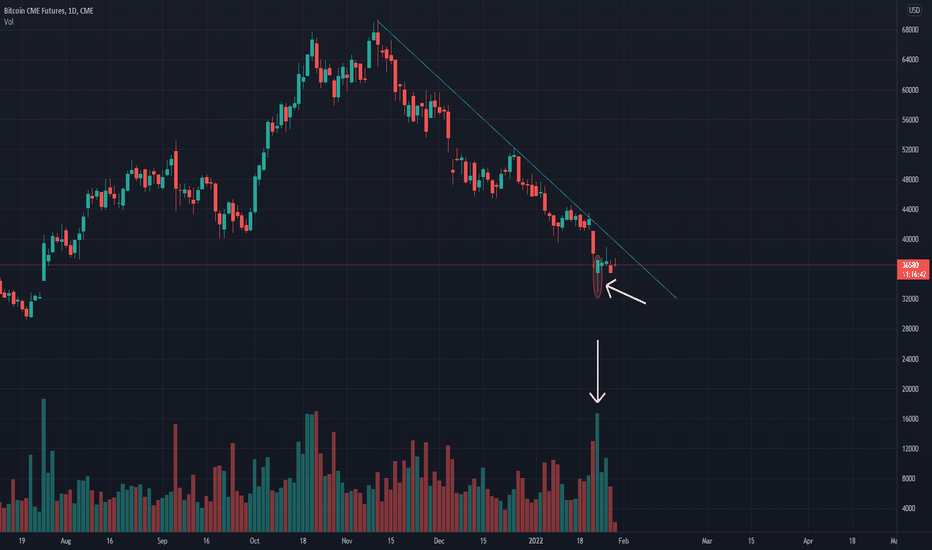
The BTC may be resume it up trend !!as we see in my chart, there is an important candle with a wick, not only that but this candle came with an imprtant volume we didn't see like it since October.
So all of that indicate that there is a big probability of trend reversal, but!! we are not sure until BTC will break the down trend line that I traced in my chart then the probability of trend reversal will be 80%
We will see what BTC will do in the upcoming days.
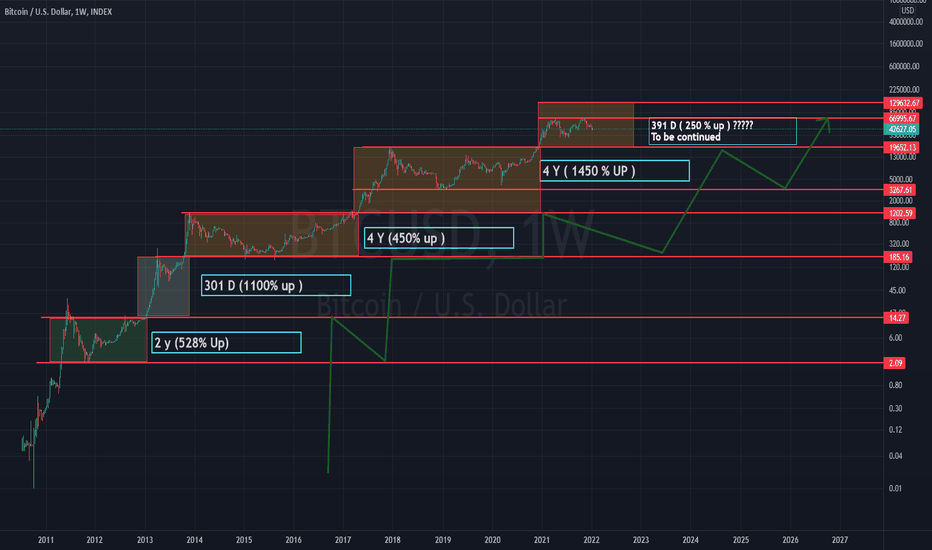
#Bitcoin cycleBitcoin habits
In this analysis, I noticed the behavior of bitcoin
It is quite clear that every time an important level was broken and a new ceiling was hit, bitcoins hit the broken level.
Growth cycles are usually four years
It usually grew by more than 450% in each cycle
In this chart we see that we have not yet reached the middle of the road
I expect bitcoin to grow to $ 140,000.
The lowest possible price is $ 18,900.
If Bitcoin falls below $ 18,900, I think a bearish market has begun
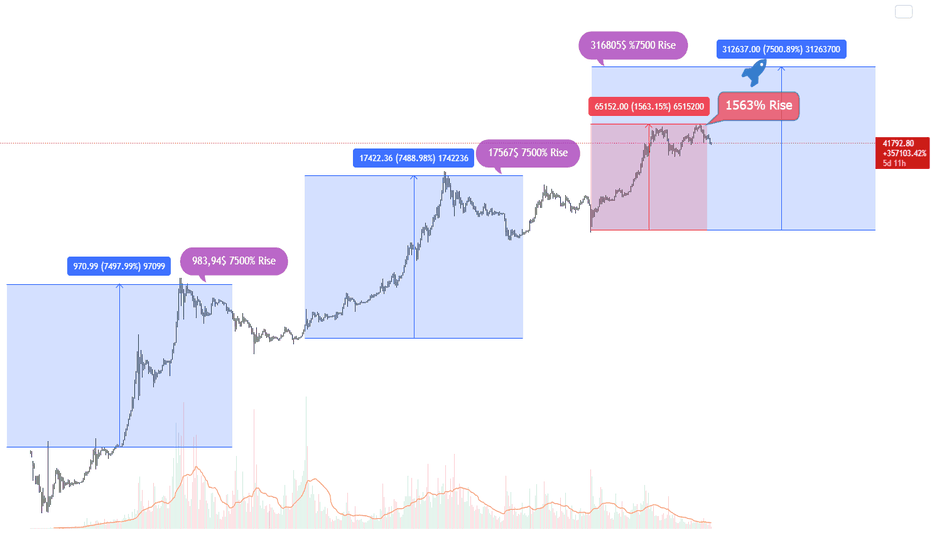
BTC Market Cycle Top 316805Do not get fooled #Bitcoin hodlers this bull market is far from over I am calling it! This cycle will end at 316805$ Probably end of 2022. Every cycle hit with 7500% Rise and now we are sitting at 1563% Rise why do you think its gonna be diffrent this time ? Its always same!!!
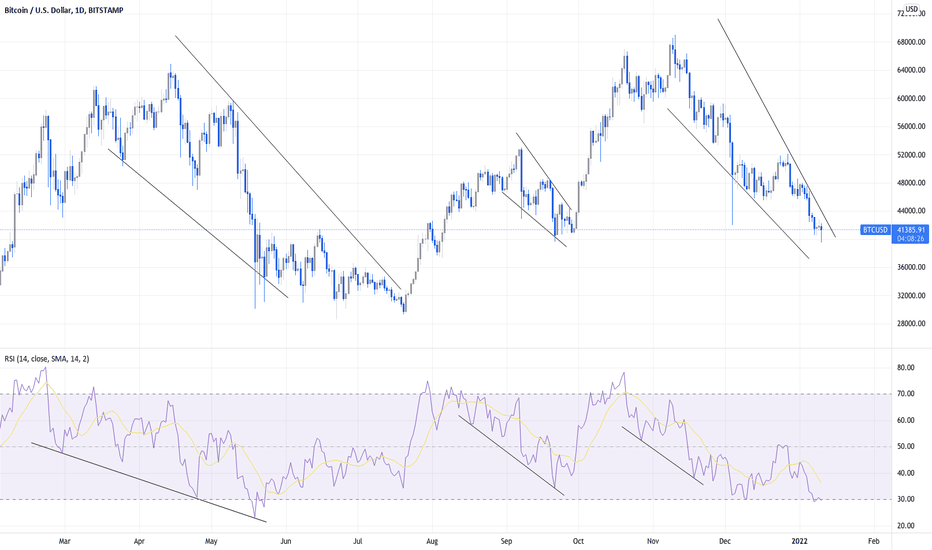
Bitcoin's Tendencies, Zoomed OutBitcoin shows correlation with descending wedges.
- Bitcoin usually has a huge move upward after this pattern is confirmed
- RSI shows bullish div
- RSI drops below middle channel signaling a bottom
Nothing more. Charts are boring today. Price keeps dipping... "worst case scenario" coming shortly
Good Luck,
- Mr. Bitcoin Baron
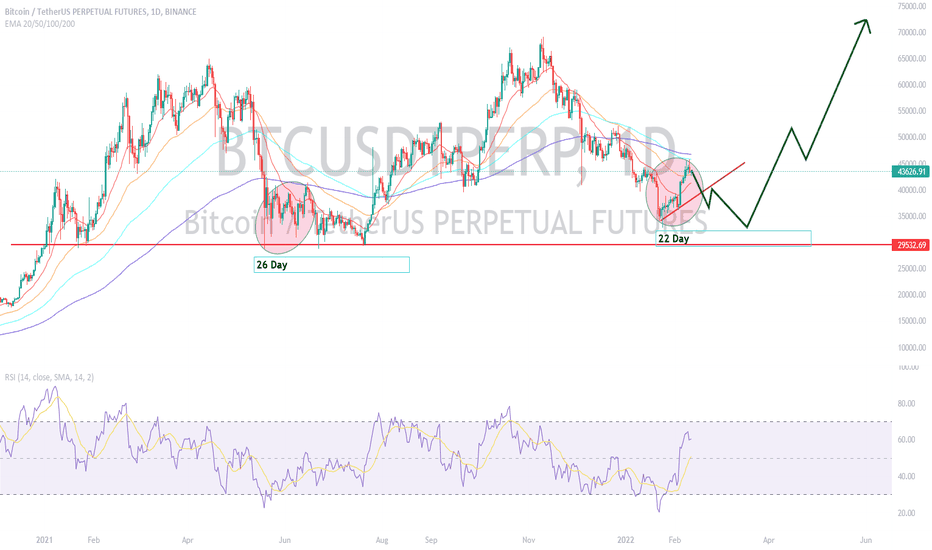
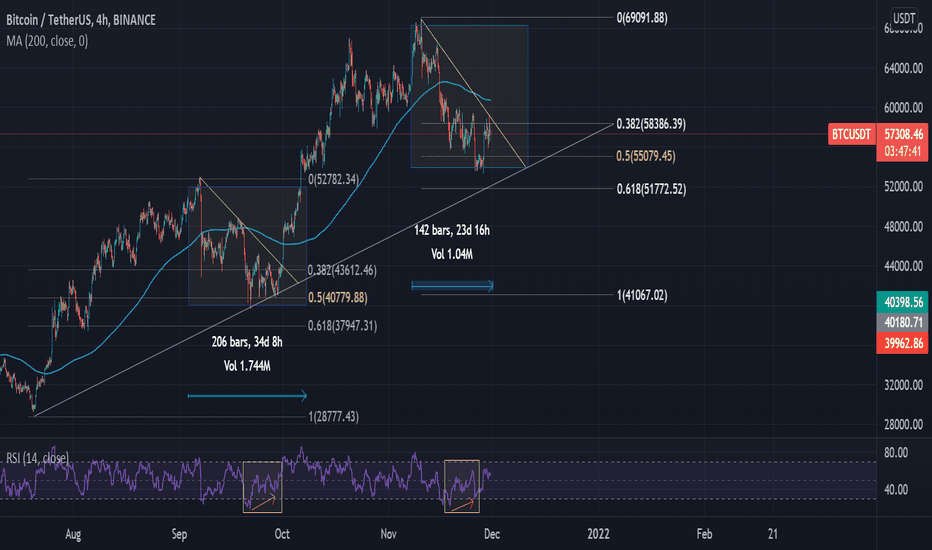
BTC/USD - Fractal PatternsBTC looking pretty bullish right now. If fractal patter completes itself, we have at least +20% upside potential. Almost a month left before it happens.
Similar bullish divergences emerged on RSI too.
Price might test trendline again before breakout. So, buy signal should be after MA200 its crossed.
Bitcoin ---> Pump incoming! Pay attention to the chart pattern and the oscillators. When the stochastic, RSI and Money Flow Index, all reach their lows, it typically indicates a pump for Bitcoin. And when this occurs on the daily, it usually means a pump that lasts for many days (even a couple of weeks). Given the chart pattern (an ascending triangle), the target is $100K but... don't let that fool you. I predict an EPIC struggle to cross $100K, so take profits before then my friends as whales will send the price DDDD OOO WWWW NNN the throat of thirsty buyers who believe in $100K+ Bitcoin! Happy Trading y'all :-)

