Bitcoin Rally IncomingBitcoin has been retracing from 26700 levels where the Fresh Left Shoulder of this entire bull run was located.
1. If 26260 was broken, the fall would have continued.
2. Another Important zone was the Left shoulder of this reaction from 26700, located at 28275-28675.
3. This zone successfully defended the price and now price is going to test the decision point 31400.
4. If 32067 is broken convincingly, we are in a short term rally to 44200 levels.
Bitcoincrash

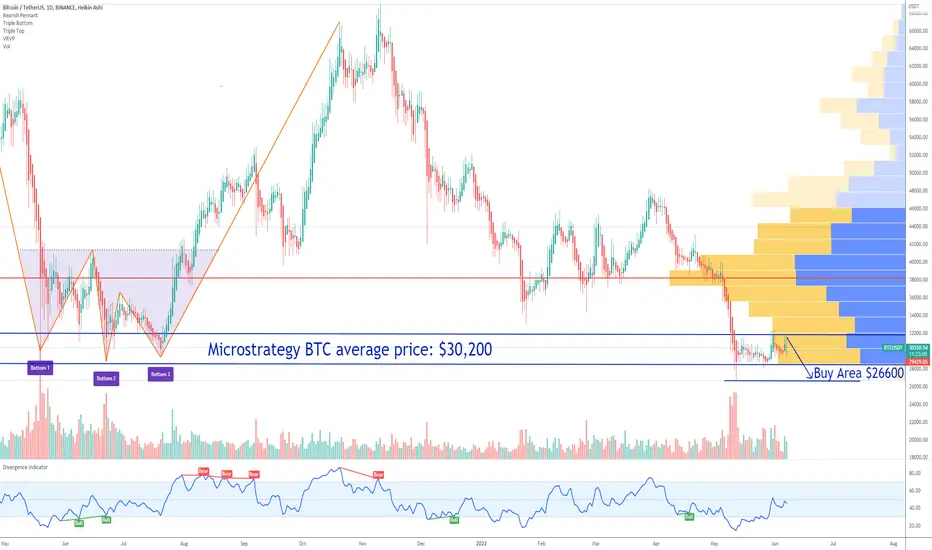
Bitcoin Buy Area updatedI think many of the Binance IPO whales will cash out some BTC and and BNB after the news that the Securities and Exchange Commission (SEC) is investigating Binance for the issuance of its cryptocurrency token Binance Coin.
A report from Reuters agency says that Binance unknowingly processed billions in illicit transactions, including illegal drug sales, hacks, and investment fraud totaling $2.35 billion!
I think this could lead to sell-off in the crypto market if it proves to be true.
My new Buy area for BTC Bitcoin is around 26K.
Looking forward to read your opinion about it.
Bitcoin BTC short Entry Range, Take Profits and Stop LossBTC/USDT short
Entry Range: $29375 - 30712
Take Profit 1: $28625
Take Profit 2: $27955
Take Profit 3: $36500
Stop Loss: $31714

Trading plan and review of Key Levels for major marketsReview of the key levels in the major markets as the US continues to edge lower.
US share market staged a late rally to fend off the bears which has led to a strong Asian market open as traders go bargain hunting. The general trend remains down with the USD, Inflation and Interest Rate Rises in focus.
BITCOIN and ETHEREUM took a beating as BTC spiked below $30k to take out some stops. Crypto enthusiasts will be hoping to see BTC back above the $30K area to fend off more selling pressure.
Markets covered
US - DOW, Nasdaq and SP500
Europe - DAX and FTSE100
Asia - Hang Seng, ASX200 and Nikkei
FX - Dollar Index (USD), EURUSD , GBPUSD , AUDUSD and USDJPY
Commodities - GOLD , Oil and Copper
Crypto - Bitcoin and Ethereum

FUTURE OF BITCOIN , Everyone should see this CHART !This is so interesting chart , i ve never seen this chart before. We should pay attention to this, share it because everyone needs to look at this chart.

Don't trust hopium sellersIt is a good thing to learn caution from the misfortunes of others. What's not as often discussed by all those crypto promoters (Youtube, Twitter, Telegram ...etc) is the great number of people who have lost significant sums trying to become rich by investing in crypto.
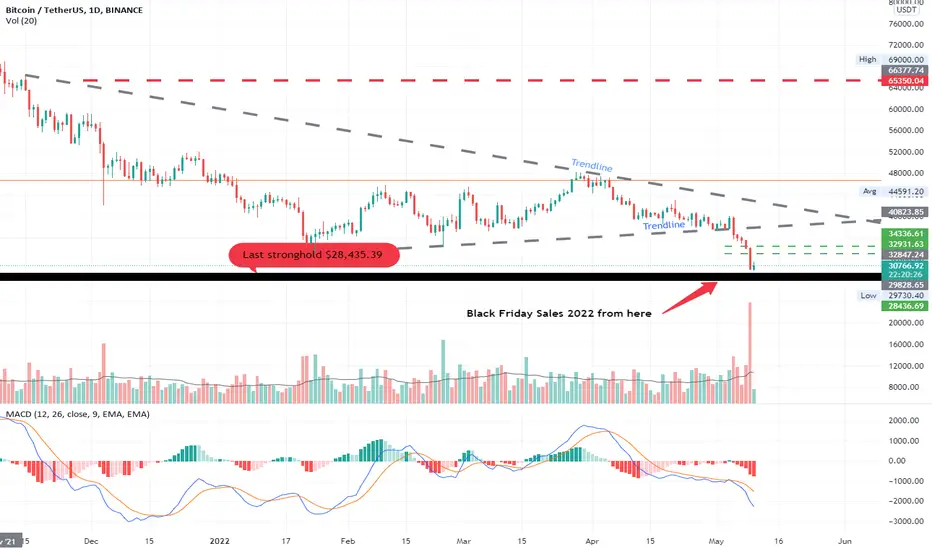
I hope everything is going well for you or at least you have some spare cash for the black Friday sales.
Bitcoin - Where is the BOTTOM? Watch $34,700 Weekly SupportWe have a major weekly support trend line to be watching on Bitcoin. It as held since the pullback to 28K. By this logic we could drop to about $34,700 on bitcoin here during this weekly consolidation. We are still in a weekly uptrend as well just looking for a weekly higher low. No major red flags and definitely a buying opportunity especially with alt coins IMO. Not financial advice :)

18th April 2022- Bitcoin Road To $20,000Kuala Lumpur, Malaysia: Bitcoin will be going to lose some interest over time and the distributions are on the way.
Meeting with the crypto whales today, they agreed to release their holding. Thy are not going to bet the system.
Mining difficulties are showing stress level. No sign of recovery over next 2 months. It is better to release than holding.
This decision will eventually send the bitcoin tumble to $20,000 for next consecutive season.
As trader and retails digest the information and the news, they found that the market of cryptocurrency has changed.
The environment is just not the same back last year.
Tips: It is better to release for profit and buy it on much more cheaper price. Since there is no buy the dip quote and such quote did not exist.
We will see some environmental change by next week.
This could be the rise of altcoin season.
April 10th 2022: Bitcoin prediction $15,000. $38K next.Kuala Lumpur, Malaysia: Bitcoin will be the next move towards the $38K towards the $15,000 price prophecy.
We have seen Bitcoin in a bull run and we enjoy the uptrend and sentiments hypes towards the $100K as many analyst bombarded with the demands towards 2 million left to mine.
What we see in actually a reverse.
What if anything we projected like the analyst told to be $100K is just another sentiment to create hype and it will never happen to make retails traders believe?
Our team of crypto whales had a meeting.
The actual plan is going to be reverse. We sell the gossip and buy the facts.
World is now changing. Trading changing with times. The change is so fast. Nothing in trading is fixed.
Our trading environment and style has been change before the pandemic. Now after the pandemic, it change significantly.
In cryptocurrency, the system is important. We cant defeat the system. We should follow the system.
On the other hand, people rushing and deposit the crypto while the reality is system inside the crypto is going to determine all of works.
The system push down so hard in the mining sector. Thus, it makes others deposit become negligible.
Next week people will convert their bitcoin into stable coins.
We are in the pursuit to stable the crypto system and energy mechanic.
In my webinar, I saw lots of people asking to me why the crypto in not like old days. Why the crypto is not hype back then like last year or 2021?
They do not understand the system. They do not understand the environment. They do not understand the maximalist (right now silence as they planned something).
What they know is deposit- at the end, the system goes down and the price went down. It makes retails trader baffled.
I will make a webinar meeting session to explain this in 8 hours session to cover this topic and to reveal what is behind the agenda.
Thanks!

BTC?USDT 4 HOUR CHART hi my dear trader
check my analysis
and comment
share other traders
support & rasistance
Follow me
@cryptotradingpk
Expect the unexpected: My Bitcoin forecast for 2022Good luck! Because you will need it.
blablablabblabla

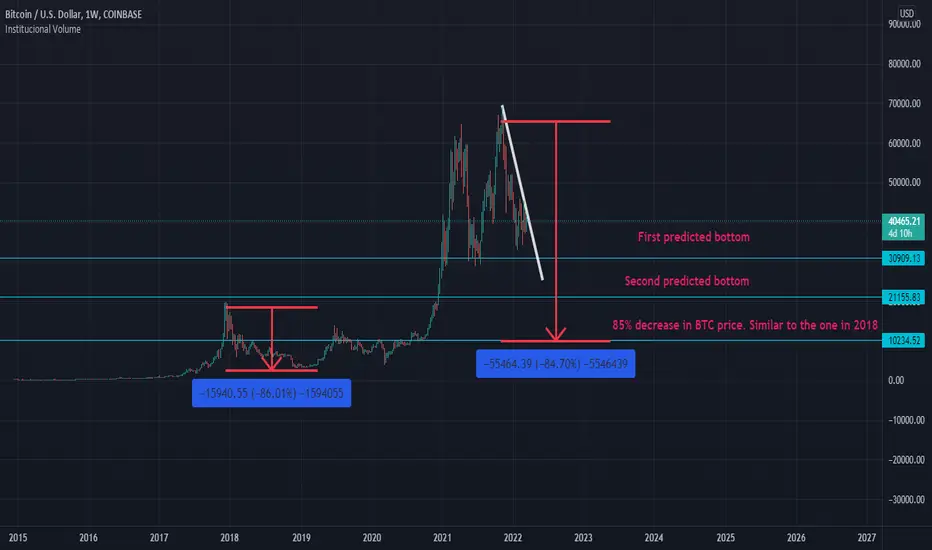
Bitcoin crash? Recession prediction:
The first predicted bottom would likely be at the 30k range. The price may in the weeks to come go through this support line but in an evidential recession would the first likely bottom be at 30k. This bottom would likely be formed after the war in Ukraine as more people are selling Bitcoin in exchange for Hryvnia or Rubel.
The second likely bottom would be predicted to be 20k as the past support/resistance zone is at this level. This second level is likely caused by the FED www.federalreserve.gov increasing the interest rate and pulling back on the free money given by the pandemic.
The third bottom and the absolute bottom may be seen at 10k range, as this is similar to the 85% decrease in Bitcoin price seen in the 2018 Bitcoin crash. This bottom is likely caused by the supply chain issues, the higher interest rate as well as the energy prices rising. Energy prices tend to be rising (seen in a graph created from www.bloombergquint.com ) which tells us that high energy prices are correlated to recession.
On Chain data:
There may be strong indications to trade Bitcoin in the short term but in the long term would the fundamentals of Bitcoin suggest the different as the Exchange netflow is negative (see in chart below) and this would predict that traders are send Bitcoin to cold storages to proof for a predicted recession. People then believe in Bitcoin long term but in the short term is their Bitcoin safer in a cold storage.
In the case of the Bitcoin miners are they not mining Bitcoin and they are also waiting on a more profitable position to mine Bitcoin. This can be seen in the Miners Reserve Chart and this decrease in mining is caused by the energy prices rising.
paste.pics
paste.pics
paste.pics
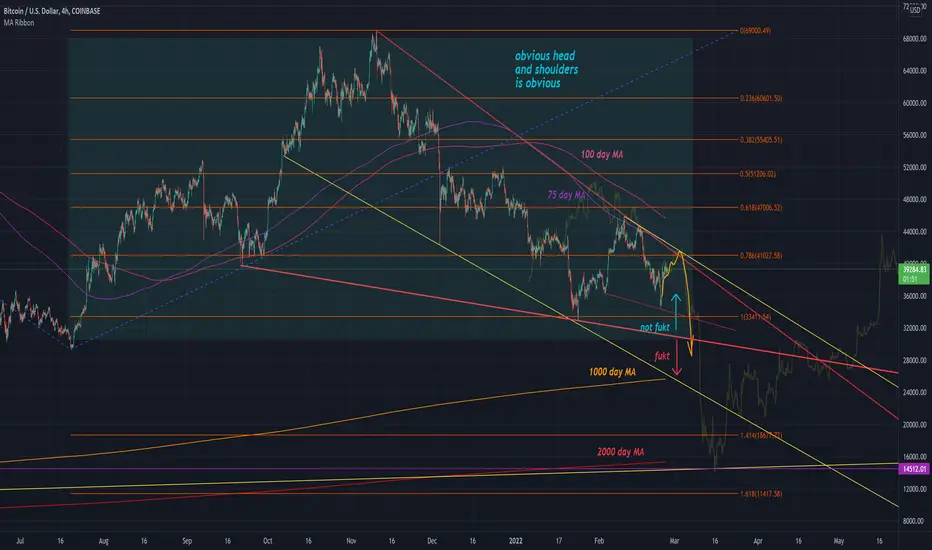
BITCOIN CRASH ?Now Bitcoin has violated its head and shoulder's neck line and in case of closing a daily candle below 46000 range , it can crash and go for MA 100 in weekly timeframe for first step. But be aware of the bottom of bullish channel , it can act like a support or even changing the trend !
To be said , MA 200 in weekly timeframe is calculated by a few logical numbers for next weeks , as you know , this moving average is really heavy to be moved rapidly , so in this case it is calculated for next weeks.
good luck and support me by your likes and follows .

Bitcoin targeting $15,000 after peaking in the next few months?I am about 90% convinced that the stock market will peak and so will bitcoin between now and APRIL/MAY then we see alt coins go crazy and then we will more than likely see the bear market confirm around AUG of this year in both stocks and crypto.
Lots of confluence and technical analysis pointing to this happening using the dot com bubble bursting fractal and also a previous fractal from bitcoins 2018 bear market. I believe SPY will be targeting 250 into the first quarter of 2023. I believe Bitcoin will be testing the 15K area by that time as well. We should have some time to prepare our portfolios over the next couple of months. I will be planning to add to my longer term SPY short once we get closer to 450s. I am being extremely selective with my long positions these days and I am also 110% hedging those positions. Now is the time to start making a plan if you do not already have one:
You will call me NostradamusMade one last tweak before I step away from it indicating where I am going to short. Good luck all.
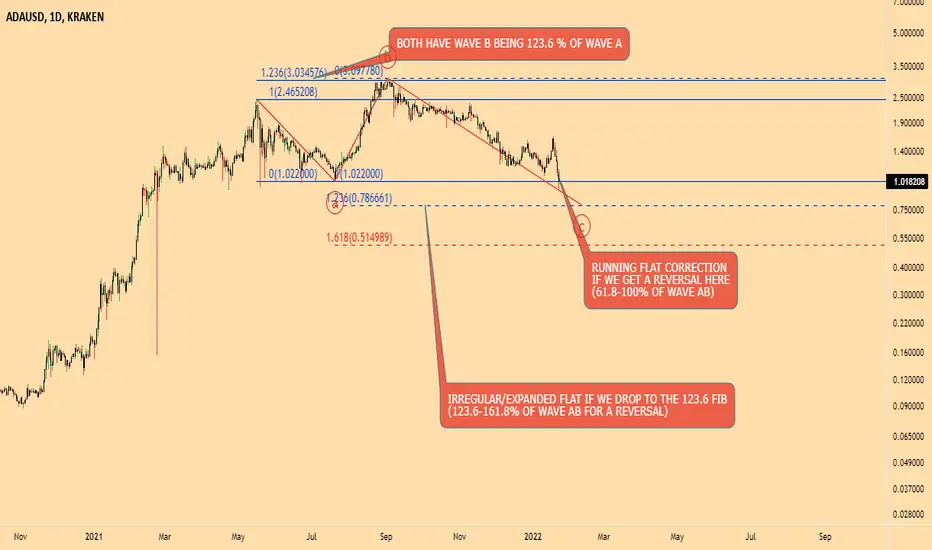
HOW LOW CAN CARDANO GOThe favourite coin of majority in the crypto space looks to be having a hard time.
Here is What you need to know for a reversal to take place.
We either have a Running flat correction or a Expanded Flat correction in play.
Depending on which fib level we get that reversal, it's uncertain to say where the bottom is for now.
However, we know that if price fails to get a bounce here, we have the 123.6 fib region next to find support, and if that fails we have the 161.8 fib support to get a reversal next.
Worst case scenario is the 1.618 fib support.
Pls like and share your thoughts in the comments section.
Check out similar ideas below.
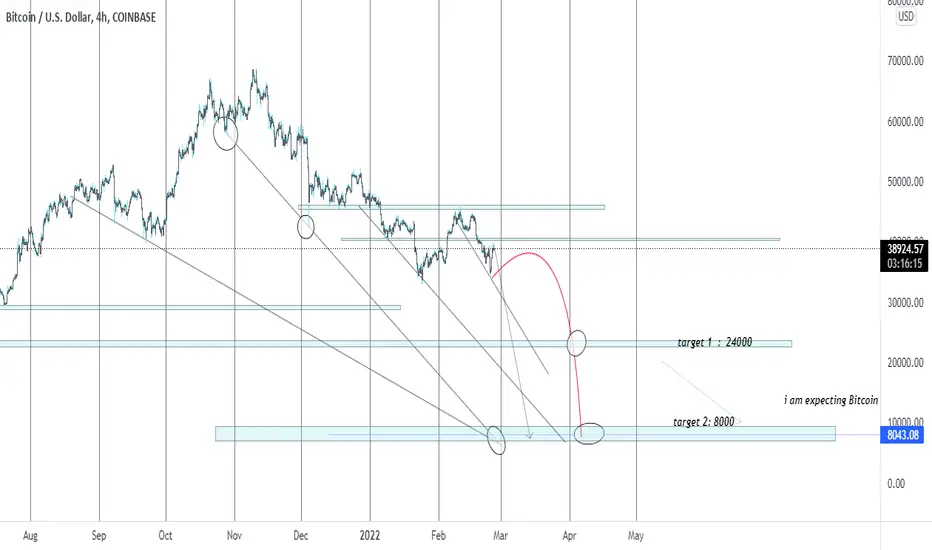
BITCOIN BET I am ON SELL 8000 TARGETLooking SELL on BITCOIN EXPECTING an Drop,, as per my Plan. I am Ready to RISK 1%.
TWO SENARIOS - UNDERSTAND THESE SCENARIOSSome $ Dollars $ Are Hiding Here
1) We have a Cup pattern which is a bullish signal.
2) But i have a really bad news : ( If Russia and Ukraine ' s Conflict remains continue we all gonna see a crash in Crypto market, Due to the conflict if market get bearish you will see a rejection at 42800$.

BTC Bitcoin Review: March 2020 to NowHello friends, today you can review the technical analysis idea on a 1D linear scale chart for Bitcoin (BTCUSD).
The chart is self-explanatory. I am reviewing the Bitcoin price using Fibonacci Retracement from March 2020 to now. The price has the potential to get supported at the $30K range or $20K range if price falls. There is a CME gap around $18.5K-$19K to keep in mind. If price stays below $20K for multiple days, it's going to be concerning.
Included in the chart: Trend line, Support and Resistance Lines, RSI, MFI (Money Flow Index), Fibonacci Retracement, Volume.
If you enjoy my ideas, feel free to like it and drop in a comment. I love reading your comments below.
I have a bunch of additional recent charts below on cryptocurrencies to review. Check them out!
Disclosure: This is just my opinion and not any type of financial advice. I enjoy charting and discussing technical analysis. Don't trade based on my advice. Do your own research! #cryptopickk

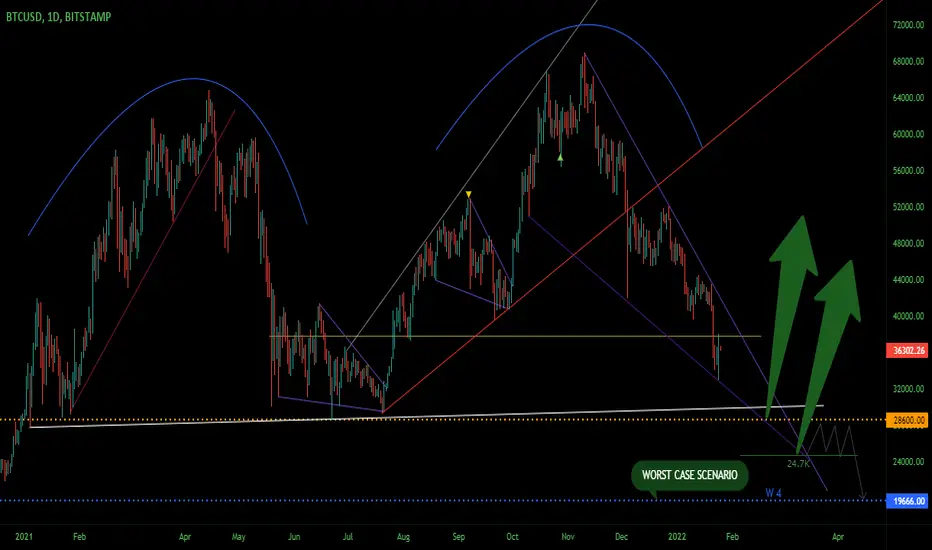
BITCOIN: Here's What You Need To KnowBelieve the chart above is very much self-explanatory
Bitcoin in trapped within a channel and nearing it's apex with an eventual price target of at least 30-27k which coincides with our horizontal support & area of interest and could also play out as a triple bottom which i think is more likely tbh.
Should we fail to hold that then 24.7k could be a possible reversal zone.
Worst case scenario 20k for 1 Bitcoin.
No I dont see bitcoin going below 20k and doesn't seem logical to me.
If you agree leave a like and share your thoughts and ideas in the comments.
BITCOIN - Short idea - Inverse Cu and Handle TRADE ALERT: BITCOIN
IDEA: SELL (GO SHORT)
Would you BUY or SELL and WHY?
PRICE ACTION: (BREAKOUT of an Inverse Cup and Handle into a downtrend (bear market)
1st Price Target = $20,000
TIME FRAME: DAILY
FUNDAMENTALS:
Omicron variant has spooked the market at the time Bitcoin fell. But we’ve seen major selling volume from investors, institutions and traders out of financial and crypto markets.
BITCOIN FLASH CRASH Basically, we saw Bitcoin’s price drop in a matter of hours by more than $16,000.
That was in one day.
This flash crash has created lingering effects of uncertainty, fear and high volatility in the market… And because, it happened once, it can happen again.
Here’s where it gets interesting.
Even though crypto has a market cap of $1.9 trillion (which was $3 trillion in November 2021), it is still considered quite illiquid compared to US stocks which have a market cap of around $50 trillion.
**DO YOU AGREE with the analysis? **
