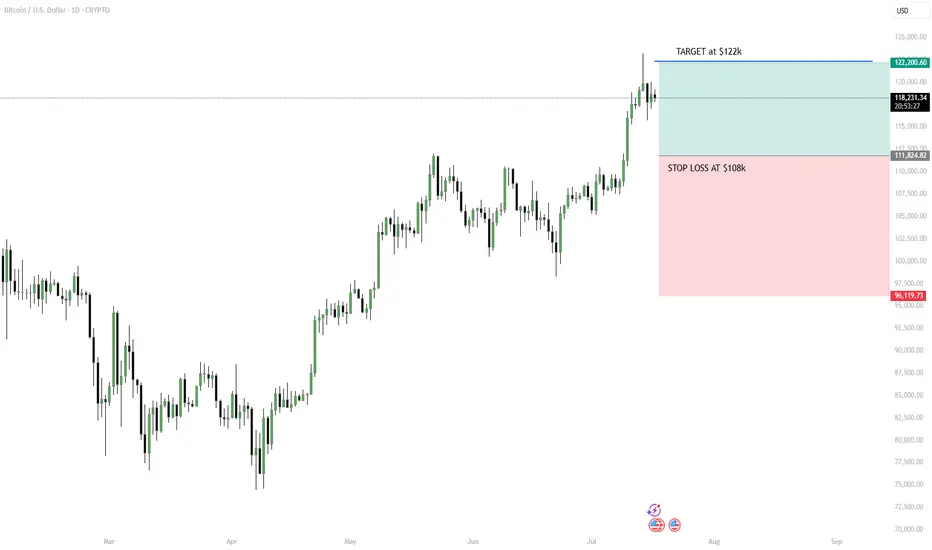
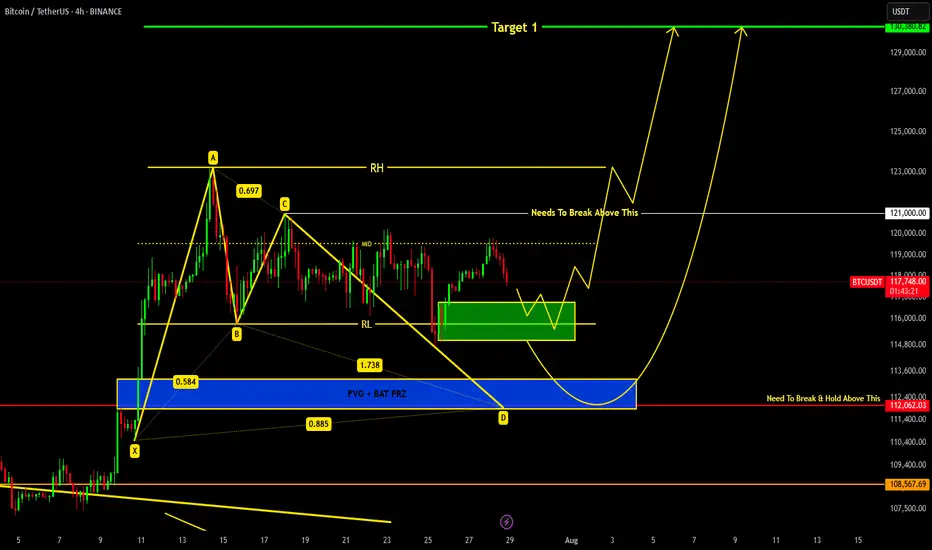
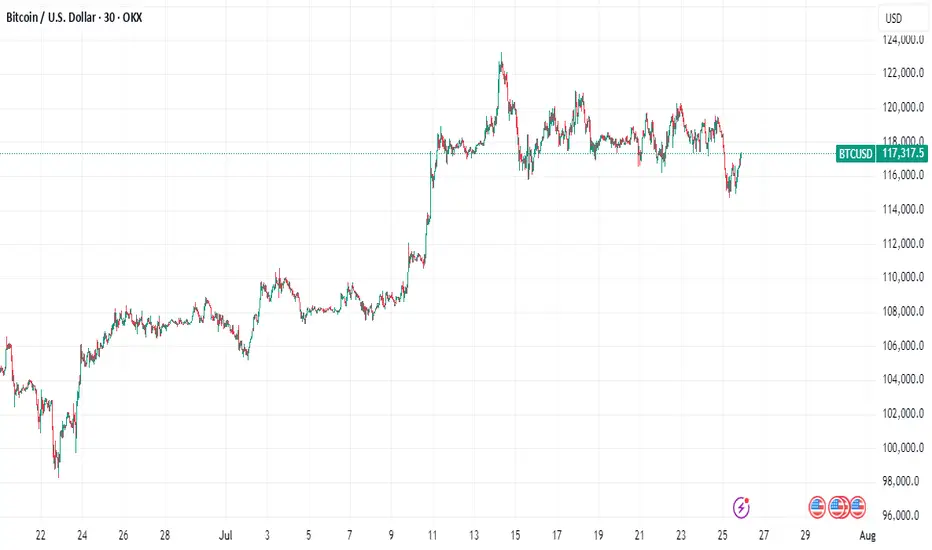
Strategy: “Breakout Bounce” – Buy the Retest, Ride the WaveHello Traders! BTC has broken out above $118K–$120K after a strong uptrend. Now it’s pausing, and a short-term pullback looks likely. Instead of buying the top, we wait for the price to retest previous resistance (around $112K–$114K), which could turn into support.
MY PLAN:
Wait for pullback to $112K–$114K zone.
Look for a bullish candle (daily or 4H) to confirm entry.
Target: $122K short-term or trail stop if trend continues.
Stop loss: Below $108K to manage risk.
Tip: Don’t chase. Be patient, follow the setup, and use proper risk management.
Please leave a comment and don't forget to support a fellow trader! Also, you can leave in the comments your target and plan ideas!
Have a great day y'all!
-Neo
Bitcoinidea
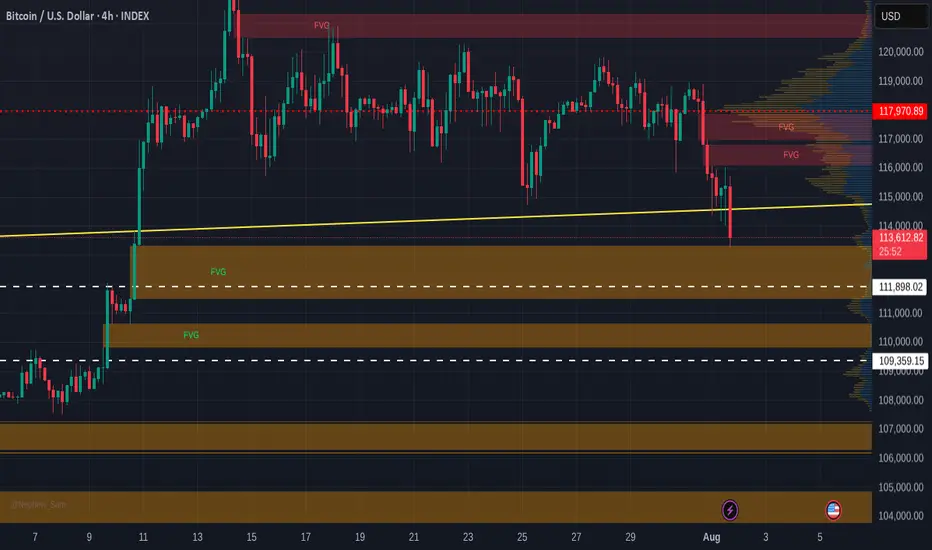
Bitcoin Free Value Gaps getting filled - 109 K target >
If you look back at the last time I posted a chart with Free Value Gaps ( FVG ) you will see an orange bar where PA currently sits...The reason it is no longer there is because it ogt "Filled"
It is much the sameidea as CME Gaps. Thay also get filled very often/
So, we can see 2 more FVG before 107K line and so, in the current market state and with the knowledge that in August, Markets often Dip, we may well see PA retreat to the Gap at 109K
What a superb buying oppertunity
End of post as I am enjoying an evening in the south of France, with wine and Fun..
What it stopping you ?
BTCUSD Short Setup – 4H Bitcoin has broken below a key dynamic support zone, and current price action signals a potential continuation to the downside. This short entry is supported by multiple technical confluences:
🔻 Bearish Confluences:
Fibonacci Retracement Rejection: Price rejected the 61.8% Fib retracement zone near $114,978, confirming a potential local top.
Trend Structure: Clear lower high, lower low structure forming on 4H – momentum favors sellers.
EMA Cloud Pressure: Price is decisively below the multi-band EMA cloud, showing sustained bearish pressure and trend bias.
Volume Profile Gap: Price is entering a low-volume node between $113.8k and $112k, increasing likelihood of a sharp move down.
Bearish Candlestick Pattern: A strong bearish engulfing candle formed after the retracement – a classic reversal confirmation.
🎯 Fibonacci-Based Targets:
TP1 – $11205 (38.2%): Initial demand zone and minor support.
TP2 – $11024 (61.8%): Mid-extension level, aligns with prior consolidation.
TP3 – $10731 (100%): Full measured move target if the downtrend accelerates.
SL: Placed just above the recent swing high at $11678, protecting against false breakouts.

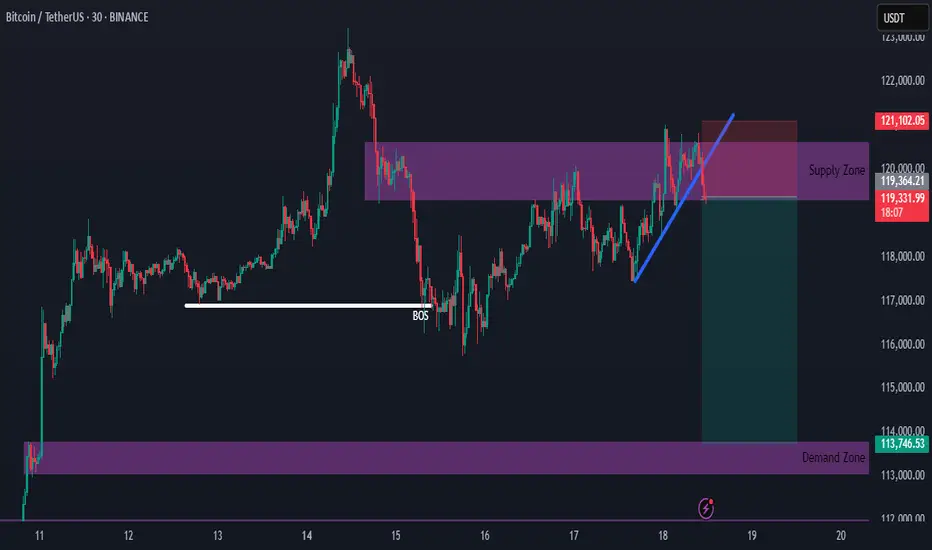
Bitcoin Supply Zone Intact — New Short Setup DevelopingHello everybody!
The supply zone we discussed in the previous idea is still holding.
We have a new opportunity to go short upon the break of the upward trendline.
The most likely target is around 114,000.
BTC; Heikin Ashi Trade IdeaAfter a correction, price may have a good reaction from first demand area I have marked.
Lower demand zone is even more valid, since we see manipulation and then impulsive move to the oposite side.

BTC/USD – 4H Short Setup AnalysisBitcoin is currently trading within a defined range under macro resistance. The chart shows price stalling below a key supply zone, with rejection from the upper Keltner Channel and diagonal resistance (yellow trendline). A local bearish divergence appears to be playing out as momentum fades.
📉 Short Position Setup:
Entry: $119,275 (supply retest)
Stop Loss: Above local high / top channel boundary
Targets:
TP1: $117,163 (38.2% Fib)
TP2: $115,858 (61.8% Fib)
TP3: $113,746 (full measured move)
Confluence:
Bearish rejection near multi-touch trendline resistance
Lower high formation after extended consolidation
Heikin Ashi candles showing loss of bullish momentum
Watch for: Breakdown of the white trendline support to confirm momentum shift. Invalidation if BTC closes strongly above $120,000.
Timeframe: 4H | Strategy: Range Reversal + Fib Confluence

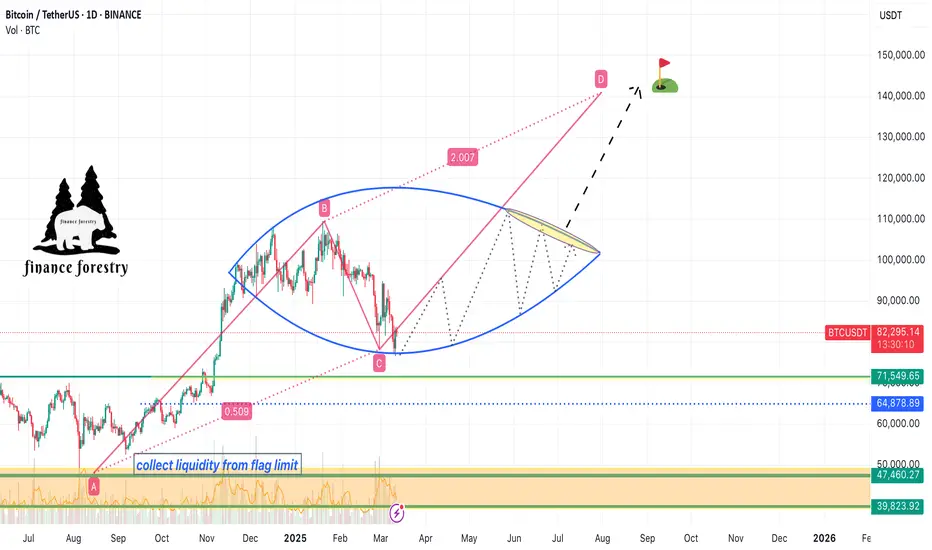
Bitcoin's Natural Correction and the $141K Target Based on Fibonhello dear trader and investors
The cryptocurrency market is always accompanied by strong fluctuations and natural corrections. Bitcoin, as the market leader, requires corrections and liquidity accumulation after each significant rally to pave the way for higher price targets. In this article, we analyze Fibonacci structures and harmonic patterns to demonstrate that Bitcoin's next target could be $141K.
1. Bitcoin Corrections: A Natural Part of an Uptrend
Price corrections in bullish trends are a normal phenomenon that helps shake out weak hands and allows major players to accumulate liquidity. Historically, Bitcoin has experienced 20-30% corrections before resuming its upward trajectory. The current correction is no different and may serve as a base for the next strong move toward higher targets.
2. The $141K Target Based on Fibonacci
Fibonacci levels are among the most reliable tools for predicting price targets. Assuming Bitcoin's recent high was around FWB:73K and the ongoing pullback is a healthy retracement, we can use harmonic AB=CD pattern to project potential upside targets. Based on these levels, Bitcoin could reach $141K in the next bullish phase.
Confirmation Through Harmonic Patterns
Harmonic patterns like Butterfly and Gartley suggest that the current correction is forming a potential reversal structure. If this correction completes within the PRZ (Potential Reversal Zone), Bitcoin could see a strong continuation of its uptrend. The Fibonacci ratios in these harmonic structures indicate that the final price target for this bullish wave could be around $141K.
Volume and Liquidity: Key Drivers for the Rally
Bitcoin needs increased volume and liquidity inflows to reach higher levels. On-chain data shows that trading volumes are rising and large investors (whales) are accumulating rather than selling. This behavior typically precedes a strong bullish move.
Bitcoin's current correction is entirely natural, and technical structures suggest that it could be laying the foundation for a new bullish wave. Based on Fibonacci and harmonic pattern analysis, Bitcoin's next major target is around $141K. Traders and investors should consider these levels in their analysis and avoid emotional decisions during market corrections
good luck
mehdi
Bitcoin Are We Heading to 140K or 80K ??? Here is the Analysis Based on what is happening here is what we currently see with Bitcoin
Idea 1: If we can break 119K then here are the following levels Bitcoin can go to :
122K
126K
135K
140K
Idea 2: If we continue and break further bearish here are the levels BTC can go to
115,600
114,500
112,800
If we go below this level then a larger correction thesis would point us with a deeper bearish level
Happy Trading
Trade Smarter Live Better
Mindbloome Exchange
Kris

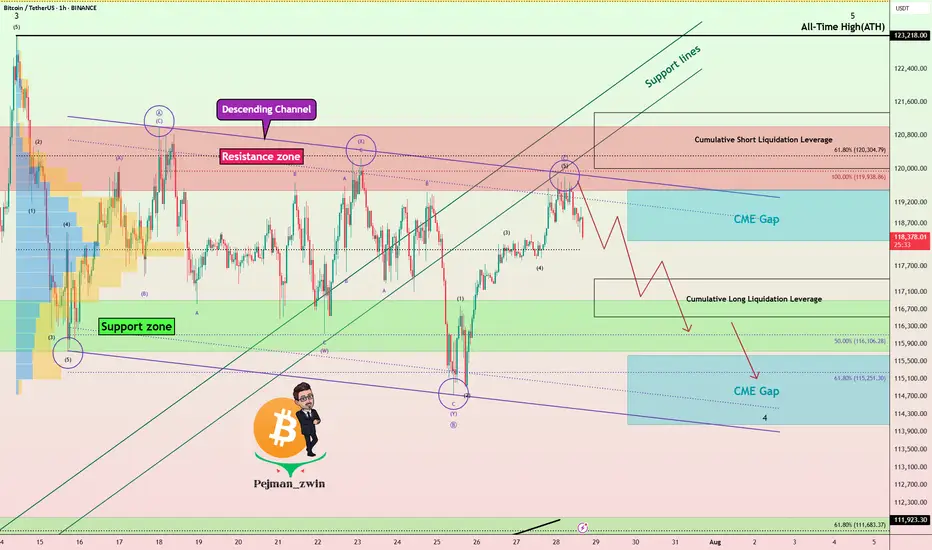
Bitcoin Rejected Near $120K – Bears Wake Up!First of all, I have to say that Bitcoin’s movements over the last 12 days have been a bit difficult to trade , generally, the hardest market to make a profit in is the range market with a swing movement .
Bitcoin( BINANCE:BTCUSDT ) is currently trading near the Resistance zone($121,000-$119,500) , Cumulative Short Liquidation Leverage($121,336-$120,000) , and the upper line of the descending channel .
Since Bitcoin has lost support lines , we can consider this increase in Bitcoin over the last two days as a pullback to the support lines(broken) . Do you agree with me!?
In terms of Elliott Wave theory , it appears that Bitcoin is still completing the main wave B. The main wave B is a Regular Flat(ABC/3-3-5) . The structure of the microwave B of the main wave B was a Double Three Correction(WXY) .
Additionally, the SPX 500 index ( SP:SPX ), which Bitcoin is correlated with , is poised for a correction in my opinion, which could also impact Bitcoin .
Also, unlike previous Mondays, MicroStrategy has NOT purchased Bitcoin , and the company currently holds 607,770 BTC .
Old Bitcoin wallets also seem to be waking up to the fact that they can create movements in the crypto market . " In recent days, 471,867.8 BTC worth $56.39 million have been transferred from old wallets from 2012 to 2017 . ".
I expect Bitcoin to decline to at least the Support zone($116,900-$115,730) and fill the CME Gaps in the coming hours .
New CME Gap: $119,500-$118,295
CME Gap: $115,060-$114,947
Cumulative Long Liquidation Leverage: $117,401-$116,615
Please respect each other's ideas and express them politely if you agree or disagree.
Bitcoin Analyze (BTCUSDT), 1-hour time frame.
Be sure to follow the updated ideas.
Do not forget to put a Stop loss for your positions (For every position you want to open).
Please follow your strategy and updates; this is just my Idea, and I will gladly see your ideas in this post.
Please do not forget the ✅' like '✅ button 🙏😊 & Share it with your friends; thanks, and Trade safe.
BTC/USDT Analysis — Potential Sideways Range
Hello everyone! This is the daily analysis from the CryptoRobotics trading analyst.
Yesterday, Bitcoin experienced a local reversal. At this point, two zones previously marked by us have been worked out:
Buy zone — $118,300–$117,300
Sell zone — $119,500–$119,000
We now expect continued rotation within the $117,400–$119,800 range, with potential expansion in both directions. The overall context remains positive, so a full breakout to the upside could occur in the near future.
Buy zones:
$116,200–$115,000 (volume anomalies)
$110,000–$107,000 (accumulated volume)
This publication is not financial advice.

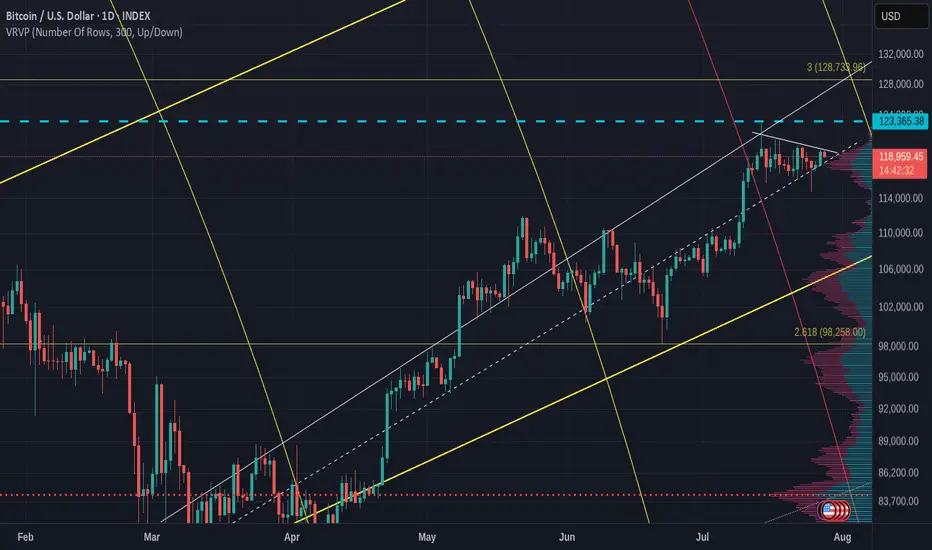
BTC- Following the TrendLine since YEARS, ExactlyYear on Year , each cycle BTC is adhering to this trend line, and also hit the 2 FIB EXACTLY for now - rejected there. It must cross this to test higher levels, but that may need a few weeks more of sideways moves. Keep a watch cause another rejection at this trend line will probably indicate we are not going higher.

BITCOIN Current Update !!!we are heading towards support region around 116.8k-115k from where we can expect a reversal.
If price breaks down 115k level then a bat harmonic pattern is also forming which indicates it's PRZ at 113-112k region...
Remember 121k is key level which needs to be broken in order to remain bullish !!!
Bitcoin Versus ETH daily charts- one is VERY BULLISH
No Guesses which one.
Bitcoin printing a Bullish pennant on the daily with the Apex late this Wednesday, After the FED tell us what they are doing with interest rates
PA always reacts before the Apex.
ETh on the other hand, is under a Huge area of long therm resistance and running out of steam
If we zoom out to the weekly, we can see how long this line has rejected PA
My money remains in Bitcoin, whihc has also made gains over the weekend.
And is highly likley to remain there
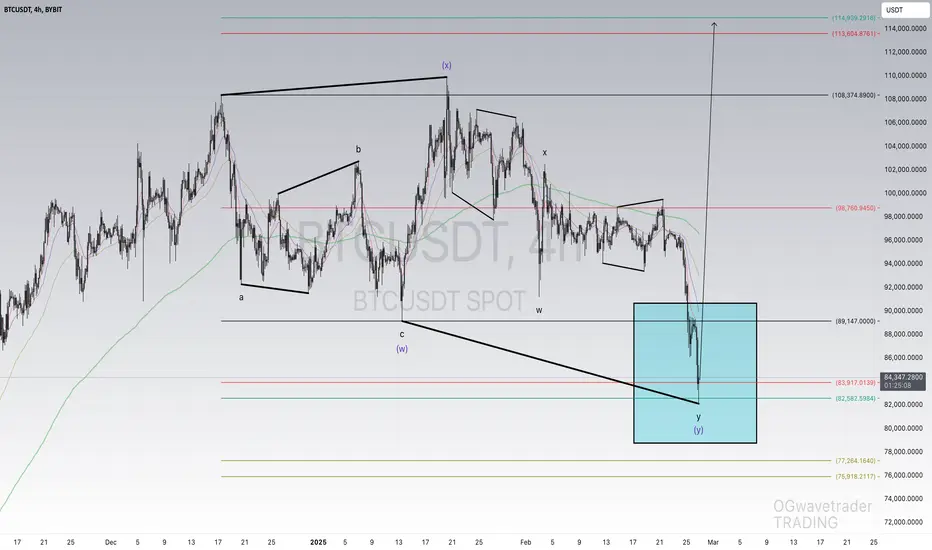
BTCUSDT NEXT Impulse !Hi fellow traders, BTCUSD will be ready to make a move higher from the blue box after it completes the expanding flat pattern in a WXY formation. Target will be 113604.87 USD. Good luck and trade safe!
Why Bitcoin's Bull Run Hits a WallBitcoin's Bull Run Hits a Wall: A Deep Dive into the $115K Correction, Record Leverage, and the Battle for Market Control
A sudden and violent tremor has shaken the cryptocurrency market to its core. After a period of quiet range-bound trading, Bitcoin has decisively moved from consolidation to a sharp correction, plunging below the critical $116,000 support level and briefly touching $115,000. The abrupt downturn triggered a "bloodbath for crypto longs," liquidating hundreds of thousands of traders and wiping out nearly $600 million in leveraged positions. Yet, as the dust settles, a complex and contradictory picture emerges. While institutional sell-offs and cascading liquidations paint a grim short-term picture, record-high open interest, significant liquidity grabs, and bullish on-chain signals suggest the long-term uptrend may be far from over. This article delves into the anatomy of the crash, the forces that fueled it, and the fierce battle between bearish catalysts and bullish undercurrents that will define Bitcoin's next move.
Part 1: The Anatomy of the Correction - From Sideways to Sell-Off
For weeks, Bitcoin's price action was characterized by consolidation, a phase where an asset trades within a defined range, reflecting market indecisiveness. After a strong upward trend that pushed Bitcoin to new highs above $120,000, this period of sideways movement was seen by many as a healthy pause before the next leg up. However, this placid surface masked building pressure. The transition from this consolidation phase to a full-blown correction was swift and brutal.
A market correction is defined as a rapid price change, often a decline of at least 10% but less severe than a crash, that disrupts an asset's prevailing trend. The recent tumble below $116,000 fits this description perfectly. The sell-off was not a gradual slide but a violent dislocation, breaking through established support levels and triggering a wave of panic.
This dramatic shift was exacerbated by several key factors. On-chain data revealed that a significant institutional player, Galaxy Digital, unleashed a massive sell-off, reportedly moving billions in Bitcoin to exchanges. This sudden injection of supply into the market acted as a powerful catalyst, overwhelming buy-side pressure and initiating the downward price spiral. The market's reaction was immediate, with the price slicing through the psychological support at $116,000 and heading towards the next major liquidity zone around $115,000.
Part 2: The Cascade - A $600 Million Bloodbath for Leveraged Traders
The speed of the price drop had a devastating impact on the derivatives market, a space where traders use borrowed funds to amplify their bets on price movements. The sudden downturn resulted in one of the most significant liquidation events in recent memory, with 213,729 traders liquidated for a total of nearly $600 million over a 24-hour period.
What is a Liquidation?
In crypto futures trading, liquidation is the forced closure of a trader's position by an exchange. This happens when a trader can no longer meet the margin requirements for their leveraged position, meaning their collateral is insufficient to cover their mounting losses. For example, a trader using 20x leverage on a $1,000 position controls $20,000 worth of Bitcoin. However, a mere 5% price move against them can wipe out their entire initial capital, triggering a liquidation.
The recent event was a "bloodbath for crypto longs," meaning traders who had bet on the price of Bitcoin increasing were the primary victims. As the price fell, these long positions became unprofitable, and once they crossed their liquidation price, exchanges automatically sold the collateral on the open market to cover the losses.
This process created a deadly feedback loop known as a liquidation cascade. The first wave of forced selling from liquidated longs added more downward pressure on the price. This, in turn, pushed the price down further, triggering the liquidation of another set of long positions whose liquidation prices were slightly lower. This domino effect—where liquidations cause lower prices, which in turn cause more liquidations—is what transforms a standard price dip into a violent market crash. This automated, rapid chain reaction is a hallmark of the highly leveraged and volatile crypto markets.
Part 3: The Fuel for the Fire - Open Interest Reaches a Record $44 Billion
Underpinning this massive liquidation event was an unprecedented buildup of leverage in the market, best measured by a metric called Open Interest (OI). Open Interest represents the total number of active or unsettled futures contracts in the market. It’s a measure of the total capital and number of positions committed to the derivatives market, distinct from trading volume, which counts both opened and closed positions. An increase in OI signifies that new money and new positions are entering the market, often leading to higher volatility.
In a stunning development, as Bitcoin's price began to plunge, the total Open Interest surged to a new all-time high of $44 billion. This unusual divergence—where price falls while open interest rises—suggested that a significant number of new short positions were being opened to bet against the market, while many longs remained trapped, hoping for a reversal. This created a powder keg of leverage.
Further fueling this was a notable surge on the world's largest crypto exchange. On-chain data showed that traders added 10,000 Bitcoin worth of open interest to the BTCUSDT perpetual contract on Binance alone. This single-day surge in open interest on a key trading pair signaled a massive influx of speculative capital.
High open interest acts as fuel for volatility. With so many leveraged contracts open, any sharp price movement can trigger the kind of cascading liquidations that were just witnessed. The record-breaking $44 billion in open positions meant the market was more susceptible than ever to a violent deleveraging event.
Part 4: The Big Players - A Tale of Two Whales
The recent market turmoil cannot be fully understood without examining the actions of its largest participants: the whales and institutions. Their movements often create the initial waves that retail traders are forced to navigate.
On the bearish side, the primary catalyst for the sell-off appears to be Galaxy Digital. The digital asset financial services firm was observed moving tens of thousands of Bitcoin, worth billions of dollars, to centralized exchanges. These flows were reportedly part of a larger liquidation of holdings from a dormant "Satoshi-era" whale, with Galaxy acting as the intermediary to facilitate the sale. By strategically offloading such a massive amount, even if through over-the-counter (OTC) desks to minimize initial impact, the sheer volume of sell pressure eventually spilled into the public markets, triggering the correction. The firm's subsequent withdrawal of over a billion dollars in stablecoins from exchanges further suggests a large-scale profit-taking or strategic de-risking maneuver.
However, this institutional selling pressure is contrasted by a powerful bullish undercurrent. Even as the market reeled, other large players were making bold, long-term bets. Reports surfaced of a significant whale bet on Bitcoin reaching a staggering $200,000 by the end of the year. This dichotomy highlights the deep division in market sentiment. While some large entities are taking profits or repositioning, others view this correction as a prime accumulation opportunity, demonstrating unwavering conviction in Bitcoin's long-term trajectory.
This clash of titans—the institutional seller and the long-term bullish whale—defines the current market structure. The price is caught in a tug-of-war between immediate, heavy supply and deep-pocketed, long-term demand.
Part 5: Reading the Tea Leaves - A Healthy Reset or the Start of a Bear Market?
While the headlines scream "bloodbath" and "crash," a deeper analysis of market mechanics and on-chain data offers a more nuanced perspective. Several key indicators suggest that this brutal pullback, while painful, may be a healthy reset rather than the beginning of a sustained bear market.
Argument 1: The Pullback Remains Within Normal Volatility Range
Bitcoin is notoriously volatile, and sharp corrections are a historical feature of its bull markets. Drawdowns of 30-40% have been common pit stops during previous bull runs. While a drop from over $120,000 to $115,000 is significant, analysts point out that such moves are not out of character for the asset. Historically, major cycle-ending bear markets have seen drawdowns exceeding 75-80%. In contrast, mid-cycle corrections serve to wipe out excess leverage, shake out weak hands, and build a more sustainable foundation for future growth. This event, though severe for leveraged traders, may fall into the category of a standard, albeit sharp, bull market correction.
Argument 2: A Necessary Liquidity Grab
Sophisticated market analysis suggests the plunge below $115,000 was a textbook liquidity grab. This is a maneuver, often initiated by large players or "smart money," where the price is intentionally pushed to a level where a high concentration of stop-loss and liquidation orders are known to exist. By triggering these sell orders, large buyers can absorb the resulting liquidity to fill their own large positions at more favorable prices before reversing the market direction. The area just below a key psychological level like $115,000 is a prime location for such a maneuver. The rapid dip followed by a stabilization could indicate that this was not a panic-driven crash, but a calculated move to hunt liquidity before the next leg up.
Argument 3: Bullish Signals from Spot Markets and On-Chain Data
While the derivatives market was in turmoil, other indicators flashed bullish signals. One analyst pointed to a strong correlation between surges in Binance's spot trading volume and subsequent price upswings. Recently, Binance's share of the spot market volume surged significantly, a move that has historically preceded rallies. High spot volume indicates genuine buying and selling activity, as opposed to the paper bets of the futures market, and can signal strong underlying demand.
Furthermore, key on-chain metrics suggest the long-term bullish scenario remains intact. Analysts highlighted that Bitcoin's price found support near the "Realized Price" for short-term holders, indicating that recent buyers were not panic-selling in large numbers. Other metrics, such as those showing that major long-term holders are retaining their assets despite record prices, paint a picture of underlying market strength that contrasts with the short-term speculative chaos.
Conclusion: A Market at a Crossroads
The dramatic plunge to $115,000 was a multifaceted event, a perfect storm of institutional profit-taking, extreme leverage, and the brutal mechanics of the crypto derivatives market. For the over-leveraged trader, it was a catastrophe. For the long-term investor, it may have been a fleeting opportunity.
The market now stands at a critical juncture, defined by conflicting forces. On one hand, the specter of institutional selling, exemplified by the Galaxy Digital offload, looms large. The record-high open interest, though slightly diminished after the liquidations, still represents a significant amount of leverage that could fuel further volatility.
On the other hand, the arguments for a bullish continuation are compelling. The idea that the crash was a calculated liquidity grab, the historical precedent for sharp bull market corrections, the strength in spot market volumes, and the conviction of long-term holders all suggest that the core uptrend is resilient. The whale betting on a $200,000 price by year-end serves as a potent symbol of this underlying confidence.
The coming weeks will be crucial in determining which of these forces will prevail. The battle between the short-term pressures of deleveraging and the long-term thesis of accumulation will be fought in the charts and on the blockchain. While the bloodbath for longs served as a stark reminder of the perils of leverage, it may have also been the violent, necessary purge required to cleanse the market and pave the way for a more sustainable ascent.
SAHARAUSDT Forming Bullish PennantSAHARAUSDT is currently forming a bullish pennant pattern, a continuation pattern that often signals the resumption of an upward trend after a brief consolidation. This pattern, combined with strong volume support, is a positive technical indicator suggesting the potential for a significant breakout. Traders are now watching for a confirmed move above the pennant resistance, which could propel the price to new short-term highs. Based on the pattern’s breakout projection, an 80% to 90%+ gain seems realistic in the coming sessions.
SAHARA has been gaining traction among investors due to its unique ecosystem and expanding real-world applications. With increased social media buzz and rising transaction volumes, sentiment around the project appears to be shifting toward the bullish side. This renewed investor interest could act as a fundamental catalyst to support the anticipated technical breakout.
Furthermore, the overall structure of SAHARAUSDT shows consistent higher lows forming into the apex of the pennant, reflecting growing buying pressure. The breakout from this structure, especially with increasing volume, typically indicates a strong follow-through move. With broader market momentum aligning and attention turning back to micro-cap altcoins, SAHARA may stand to benefit from speculative capital rotation.
With the chart structure supporting bullish continuation and volume confirming underlying demand, SAHARAUSDT is shaping up to be a strong candidate for aggressive upside potential. It's a setup that technical traders and short-term swing investors may want to keep close on their radar.
✅ Show your support by hitting the like button and
✅ Leaving a comment below! (What is You opinion about this Coin)
Your feedback and engagement keep me inspired to share more insightful market analysis with you!

BITCOIN IS CREATING A SECRET PATTERN! (Huge move incoming?!)Yello paradisers! I'm describing to you what's going on with Bitcoin right now. We are creating a secret pattern that is forming, and once its neckline is reclaimed, we are going to have a huge movement.
In this video, I'm sharing with you the most important support and resistances on multiple time frames. We are describing Elliott wave theory wave count, and taking a look at candlestick patterns. We are talking about confirmations necessary for bullish and bearish cases. I'm explaining to you what the professional trading signals need for long-term profitability.
Some of the points are great risk-reward ratios. I'm talking about that in the video. One of them is taking only the highest probability trade setups, and having the patience and discipline to wait for them.
I'm talking about proper strategy which is needed, and systemology in your overall trading and how important it is. Here on TradingView, I'm describing to you the overall bias I have on Bitcoin right now.
Don't be a gambler. Don't try to get rich quick. Make sure that your trading is professionally based on proper strategies and trade tactics.

Revsiting $150k - $200k Bitcoin (AND Next Bear Market Bottom)In this video I revisit my 2-year old study showing the potential path for Bitcoin to $150k to $200k and not only how we might get there, but the 11 reasons WHY we can this cycle.
This is the same Fibonacci series that predicted the 2021 cycle high at the 3.618 (Log chart) and used the same way this cycle, with some interesting 2025 forecasts of:
1.618 - $100k
2.618 - $150k
3.618 - $200k
There are quite a few confluences that we get to $150k like the measured moves from both the recent mini bull flag, but also the larger one from earlier this year.
** Also I touch on revisiting my study from 2 years ago where I may have discovered the retracemebnt multiple that correctlty predicted and held the 2022 lowes around $16k. **
It's a VERY interesting number you all will recognize (buy may not agree with).
Let me know what you think.

My thoughts on Bitcoin.. ABC -> 129K Top?I think we correct down to 112K area to fill the FVG and CME then we Turn up, topping at 129K and then the rest of the Alts blow off top from there..
Thoughts?

BTC/USDT LONG SET UP (BITCOIN)Entry Price 1: $118,000
Entry Price 2: $116,500
Stop Loss: $115,000
Take Profit 1: $121,000 (Close 25%)
Take Profit 2: $124,000 (Close 50%)
Take Profit 3: $127,000 (Close 75%)
Take Profit 4: $130,000 (Close 100%)

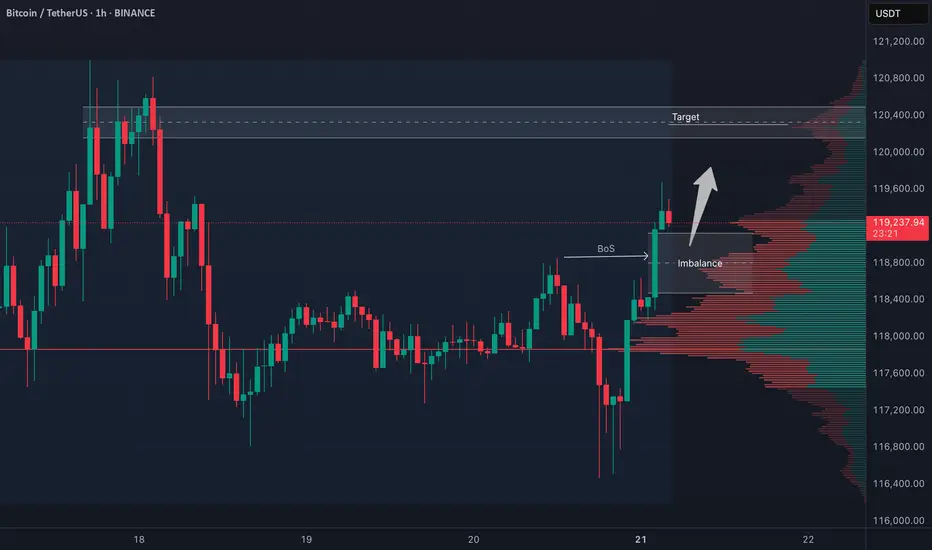
BTC 4H Structure Break – Long Bias with Conditions🚀 BTC (Bitcoin) has clearly broken bullish market structure on the 4-hour timeframe.
📈 My bias is to ride the momentum and look for a pullback to enter long.
✅ I follow a specific entry criteria — price must pull back into the imbalance, find support, and then form a bullish break of structure on a 15m chart to trigger an entry.
❌ If that setup doesn't play out, we simply abandon the idea.
⚠️ This is not financial advice.
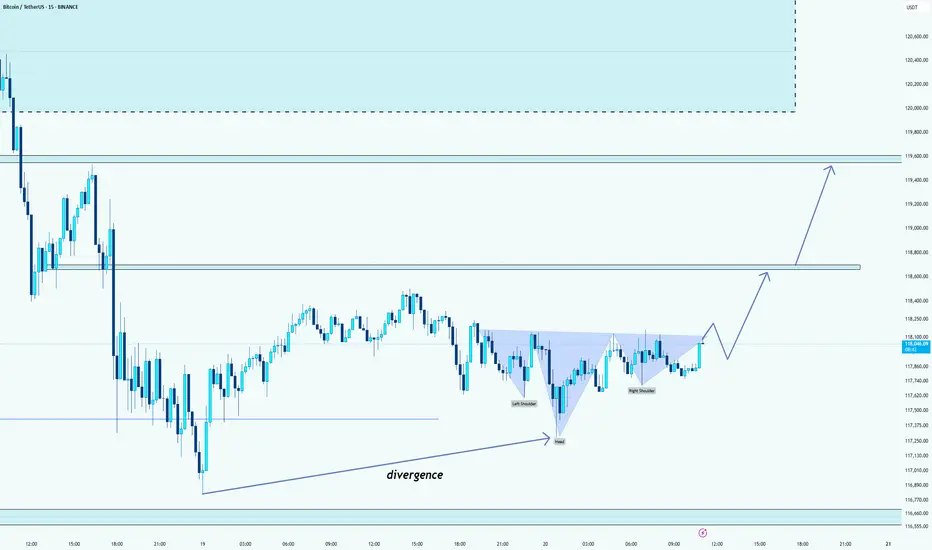
BTC: a Head and shoulders patternHello guys!
As you can see, a Head and shoulders and a divergence formed!
We can expect the price to rise until those two levels that I pointed out!
If the neckline breakout gets a long in retracements!
Capital Doesnt Lie - The Energy ProblemPart 1: THE ENERGY PROBLEM
Everything we do produces energy, even prayer. If you have ever felt tired after praying for someone, that's because you spent energy and made an effort; let's call that energy 'capital' . Capital begins with effort, whether you see it or not.
The problem is: how do we use it or store it?
Imagine that energy as an invisible ball growing in front of your head. Every time you work and think, you're growing that invisible energy ball of capital. So, how do you get it in your hands? You can plant a cucumber, craft a chair, or clean your house. It's your order, attention, time- all energy made visible in the house, stored in the cucumber or the chair.
Genesis 3:19
'By the sweat of your face you shall eat bread…'
Verse Comment: It doesn't say 'by luck' or 'by inheritance.' It says by sweat. That's energy. That's effort. That's the value produced.
Proverbs 14:23
'All hard work brings a profit, but mere talk leads only to poverty.'
Verse Comment: Effort always creates something. Even spiritual labor, such as intercession, leadership, and parenting, is a form of value creation.
But here's the issue. That cucumber plant? It goes bad. That chair? It breaks. That clean house? Dirty again in 24 hours."
Everything we do has a cost; it's not free. Energy fades unless you can find a way to store it longer than the life of the thing you created.
So if everything fades, the big question becomes: How do you store the surplus of your energy, (the part you don't need today) so it doesn't fade by tomorrow?"
That's the foundation of all capital. Of all value. And of all wealth. And it starts with understanding where your energy is going, and what it's pouring into.
