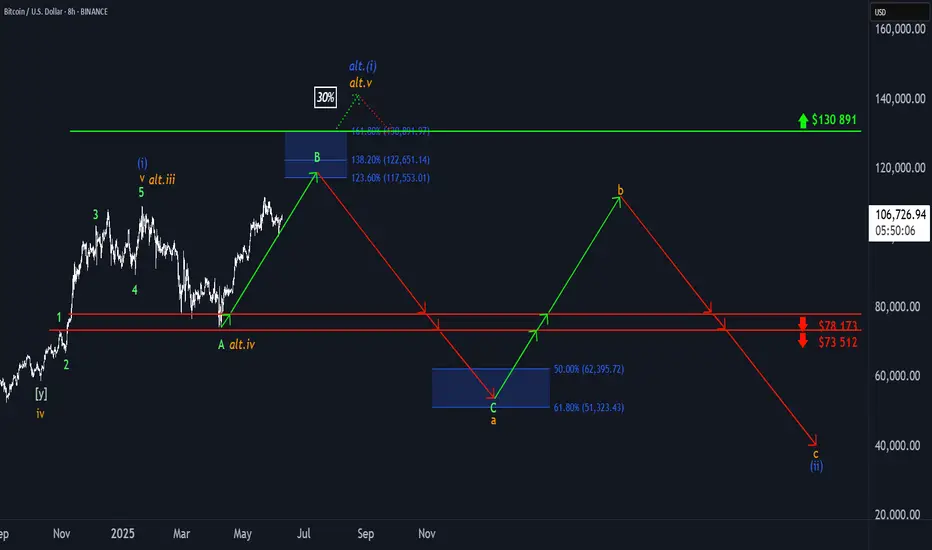
₿ BTC: Upside Potential Remains IntactBTC posted modest gains over the weekend, but more upside is expected in our primary scenario. We continue to track a corrective advance in green wave B, with the potential to extend into the upper blue Target Zone between $117,553 and $130,891. From that top, wave C should initiate a downward move into the lower blue zone between $62,395 and $51,323—completing orange wave a. Subsequently, we anticipate a bounce in wave b, followed by another decline in wave c, which should conclude the larger correction of blue wave (ii). There is still a 30% chance that blue wave alt.(i) could make a new high, extending beyond the Target Zone and delaying the broader corrective sequence.
📈 Over 190 precise analyses, clear entry points, and defined Target Zones - that's what we do.
Bitcoinidea
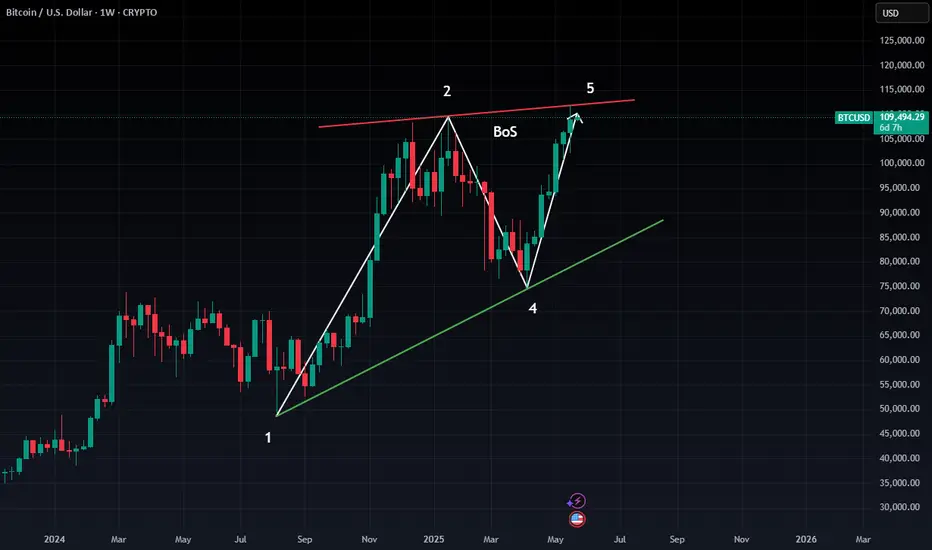
Bitcoin: Weekly Bullish Continuation🟠 The weekly divergence between the March 2024 and January 2025 peaks has driven the recent 3-month decline.
🔴 BTC is expected to make a weekly move higher, creating another divergence in the way.
🔵 BTC held above the 2024 peak range 73K without overlap, while the Stock RSI has completed a full reset, reinforcing the bullish momentum.
🟢 Outlook: Over the next 6 months, Bitcoin CRYPTO:BTCUSD is expected to rally into new ATH, with a potential target around 127K by October 2025.
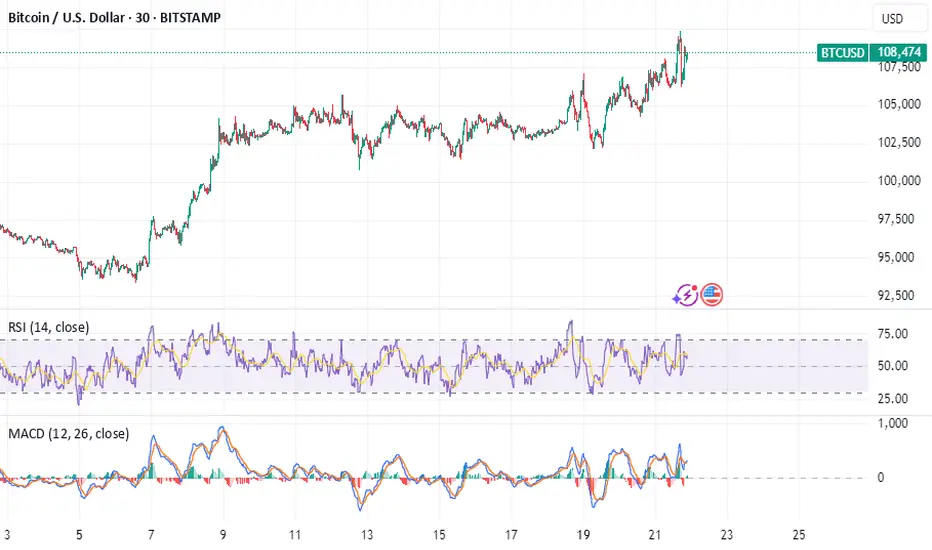
#BTC/USD Close Fight but bulls win! $117K Still in sight!CRYPTOCAP:BTC Weekly Update:
BTC closed the week up by just 0.08%, leaving behind a long wick and a tiny body, forming a Dragonfly Doji, one of the strongest candlestick patterns, signalling a fierce battle between bulls and bears.
✅ This time, the bulls won by a small margin, but a win is a win.
✅ BTC successfully held its key support.
✅ The CC is green, which is a positive sign.
The price action remains choppy, but the trend is still pushing upward from here.
Invalidation:- Weekly Close below $100k
What do you think?
Do let me know in the comments section. And please hit the like button.
Thank you
#PEACE
Bitcoin to 120k or 150k next?The last setup on BITSTAMP:BTCUSD played out exactly as predicted. ()
As of today, June 8, 2025, Bitcoin is trading around $105,000 - $106,000 USD.
And it's been retesting the zone for quite a long time and it's time it broke out! It's less likely to reverse now (Still a possibility tho).
Predictions for Bitcoin's future price is wide, as many analysts are quite bullish:
Year-End 2025: Some experts are eyeing $150,000 USD and more by the end of 2025, citing factors like global liquidity expansion and continued institutional interest.
Do you think it's a possibility?

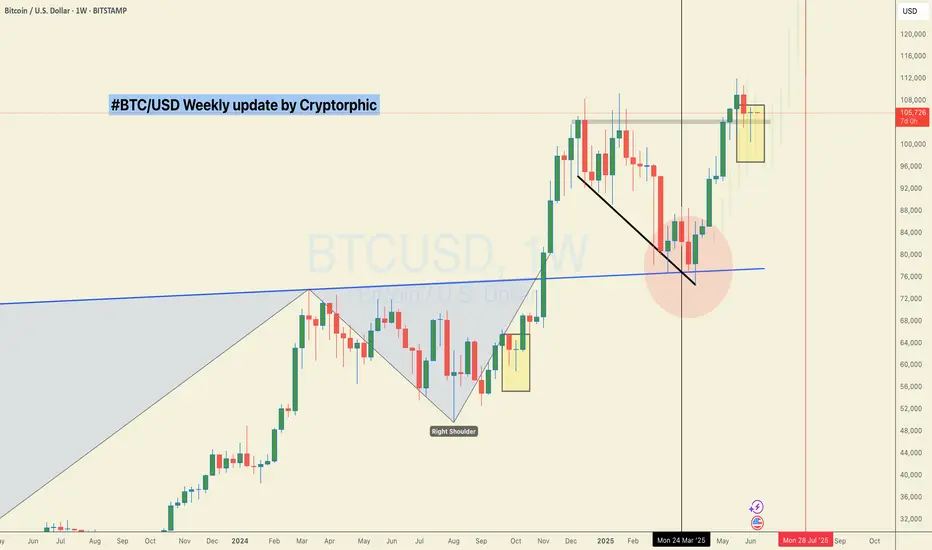
Time to go to the moon againRecent price action as retraced into the weekly level which is now the key level that Bitcoin can bounce off. once the week closes above, the next objective is price will rally and hunt the all time high. Grab your popcorn and lets watch the next move
BITCOIN REVERSAL INCOMING !!!! BUT WHEN????Currently we have seen a great move from 75k to new ATH 112k BUT now whole bullish momentum seems to be fading.
If we see charts, we clearly see ranges and recently Bitcoin has swept range high & reclaimed back into range, which indicates lose momentum. We may see BTC tapping 90K even 80'sK for next bullish move.
For all to maintain it's bullish momentum, Bitcoin have to stay above 74.5k and needs to break and hold above 109.5K.
Breaking below 74.5k would push BTC as low as 60-55k
STAY CAUTIOUS !!!!

RSI suggesting a bear market comingThis is BTC and it's RSI. Bellow you can see LMACD applied on the RSI indicator to see the trend more clearly. We might be on the stage that we can see higher prices like in 2021, but the bear trend is already printed. Sell some now and buy back at 40k next year. Cheers

Bitcoin Prediction - WARNING - Short Set-up Looming? We are spectating something serious on Bitcoin looming right now! Confirmations explained in the video!

BTC: Slowing DownBitcoin managed to stabilize over the weekend after its recent slide, nudging slightly higher from local lows. We continue to expect the current rebound—interpreted as wave B—to stretch into the blue Target Zone between $117,553 and $130,891. Once that move tops out, the next leg lower should follow, with wave C driving the price into the lower blue zone between $62,395 and $51,323. That would likely complete wave a in orange and pave the way for a temporary recovery before wave b rolls over into the final drop of wave (ii). The alternative scenario, which we’re still assigning a 30% probability, assumes Bitcoin is already in wave alt.(i) in blue—a more bullish path that would extend the rally well beyond $130,891 without another major correction first.
📈 Over 190 precise analyses, clear entry points, and defined Target Zones - that's what we do.

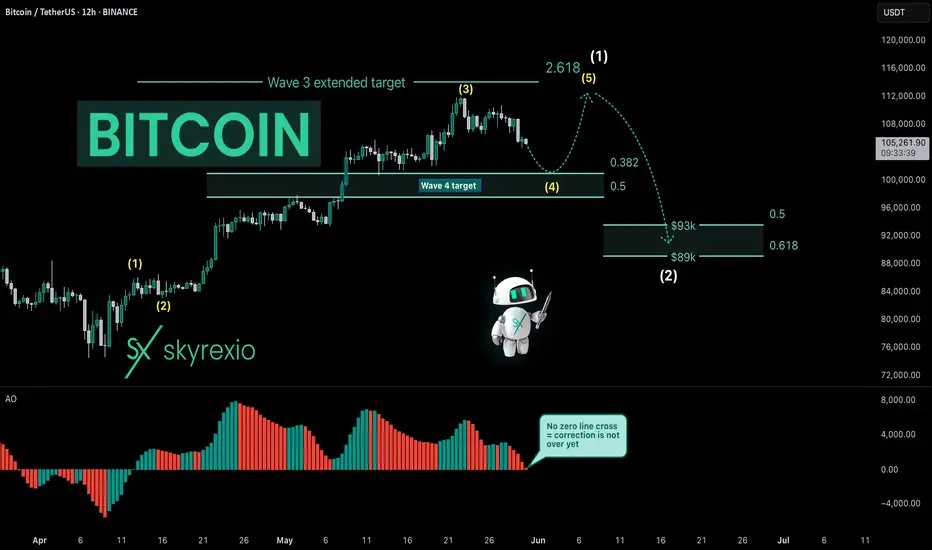
Bitcoin Is Entering Into Very Difficult TimesHello, Skyrexians!
I have been thinking what will happen next with BINANCE:BTCUSDT and it was obvious that correction has been started, you can easily find my recent update on Bitcoin and check it, but what will happen after. Today I decided that the first impulse has not been finessed yet and we need one more small leg up to complete this growth before significant correction.
Let's take a look at the yellow Elliott waves cycle. Awesome Oscillator gave me an idea that only wave 3 has been finished above $110k. Now price is printing wave 4. Wave 4 has a target between 0.38 and 0.5 Fibonacci, but this time it will be definitely 0.38 at $101k. Here was the smaller degree wave's 4 bottom. Wave 5 will be shortened because wave 3 was extended, it's very logically. After $111k retest the major wave 2 will go to $90k approximately. Difficult times ahead for crypto, I think this period will be finished only at the end of June.
Best regards,
Ivan Skyrexio
___________________________________________________________
Please, boost this article and subscribe our page if you like analysis!
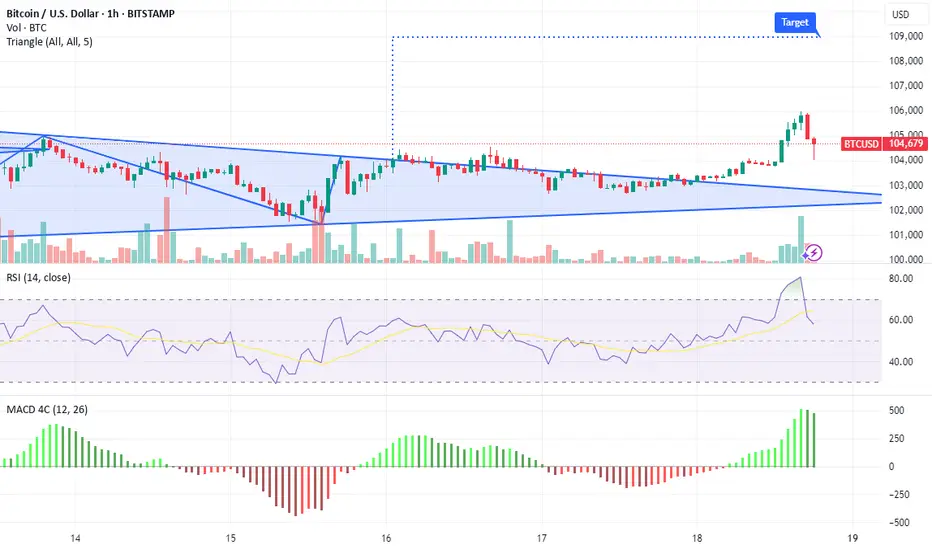
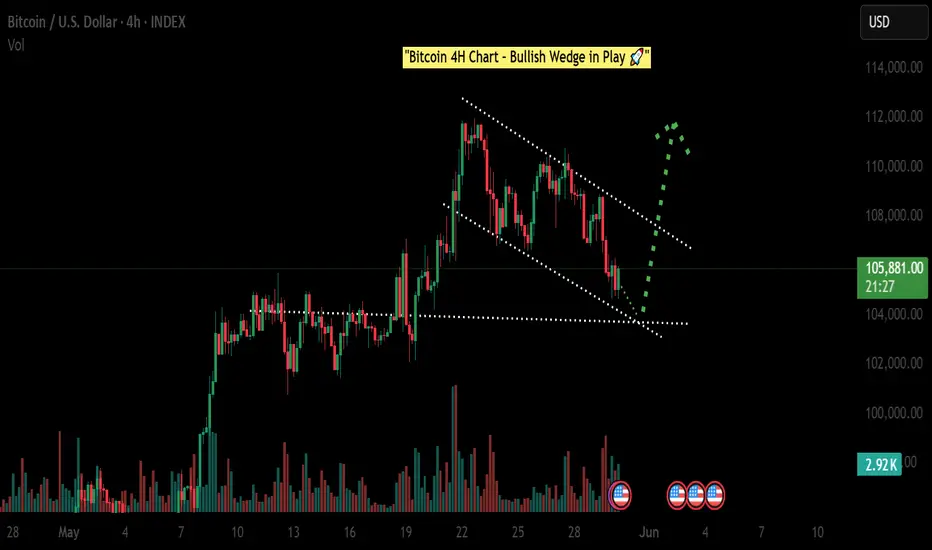
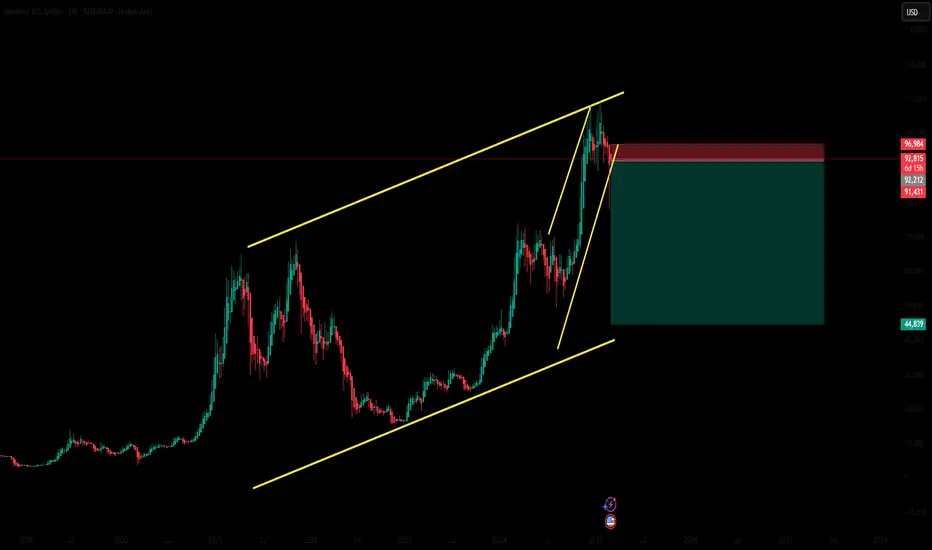
"BTC at Key Support – Watching for Bounce"🔍 BTC/USD 4H Chart Analysis – Falling Wedge Setup
Bitcoin is currently trading inside a falling wedge pattern, which historically tends to resolve to the upside. The price is approaching a key support area near the wedge's lower boundary, with decreasing volume indicating a possible shift in momentum.
We are now watching for a potential bullish reaction from this level. A breakout above the wedge resistance may open the door for a move toward the 110K region.
📌 Key Levels:
- Wedge Support: ~104K
- Resistance Breakout Zone: ~107K–108K
- Upside Target if breakout confirms: ~110K+
⚠️ This is not financial advice. This is a technical analysis idea based on historical chart patterns and market structure.
Let me know your thoughts in the comments. Do you think BTC will bounce here?
#Bitcoin #BTCUSD #Crypto #TechnicalAnalysis #FallingWedge
BTC/USDT Technical Analysis and Trade Idea📉 BTC Pullback or Full Reversal? Let's Break It Down 🔍
Looking at the Bitcoin chart right now, we’re seeing more than just a minor pullback. On the 30-minute timeframe, there’s a clear bearish market structure shift setting in. In my opinion, this isn't a quick dip before continuation — we may be in for a deeper retracement. 🧐
When we overlay NASDAQ (which Bitcoin is often closely correlated with), it becomes even clearer — tech stocks look overextended and are showing signs of a potential pullback. 📉
So here’s the plan:
If BTC pulls back into my point of interest, I’ll be watching for a bullish break of structure to consider a long position. Simple, structured, and in line with what the charts are telling us. 🔁💹
⚠️ As always, this is not financial advice — just sharing how I'm reading the market right now.
💬 What are your thoughts? Are you watching the same levels? Drop a comment below 👇 and let’s talk trade setups! 🚀

Bitcoin & Stock Market Rally Together .. My Trade Plan!🚨 Bitcoin Update! 🚨
Taking a look at the BTC chart 🧠📈 — we saw a sharp retracement followed by a strong rally 💥🔥, likely driven by recent tariff policy shifts 🌍📊.
Right now, I’m leaning bullish 🐂 — especially with the stock markets also pushing higher 📈💹. But let’s be clear: my bullish bias depends on the stock market holding strong 🛡️📊.
I’m keeping an eye out for a pullback to the 61.8% Fibonacci level 🌀 for a potential buy opportunity 💸🚀.
⚠️ This is not financial advice — just sharing my outlook!
👇 Let me know what you think in the comments!

#BTC/USD The Uptrend is still intact! Here's Why!BTC Daily Close Update
Bitcoin closed at $108,951, marking another failed attempt to break through the $111K resistance.
It’s been nearly 8 days of consolidation just below this level. That’s not ideal, and it signals we may need a fresh catalyst to push higher.
Not bearish, just cautious.
As long as the blue EMA holds on the daily, the uptrend remains intact.
Still watching for a move toward $117K.
DYOR, NFA
Please show your support with your likes.
Thank you
#PEACE
$BTC – Breaking Out of the Pattern?📈 Bitcoin ( CRYPTOCAP:BTC ) is testing the upper resistance zone of a multi-month structure.
✅ Break of Structure (BOS) has already occurred, adding fuel to the bullish case.
🚀 Just a bit more upside and CRYPTOCAP:BTC could escape this consolidation pattern completely.
Key levels to watch:
Break above ~$110K area
Green trendline remains strong support
Eyes on higher timeframe close to confirm breakout
This could be a pivot point for Bitcoin’s next leg higher — or a trap if sellers step in hard.
BItcoin; Heikin Ashi Trade IdeaCOINBASE:BTCUSD
Picture tells more than 1000 words!
Thank you for checking out!
RIP Bitcoin Sell to 45K ?Bitcoin broke the weekly channel last week. I expect a decline to 45K
Stop loss: 97600
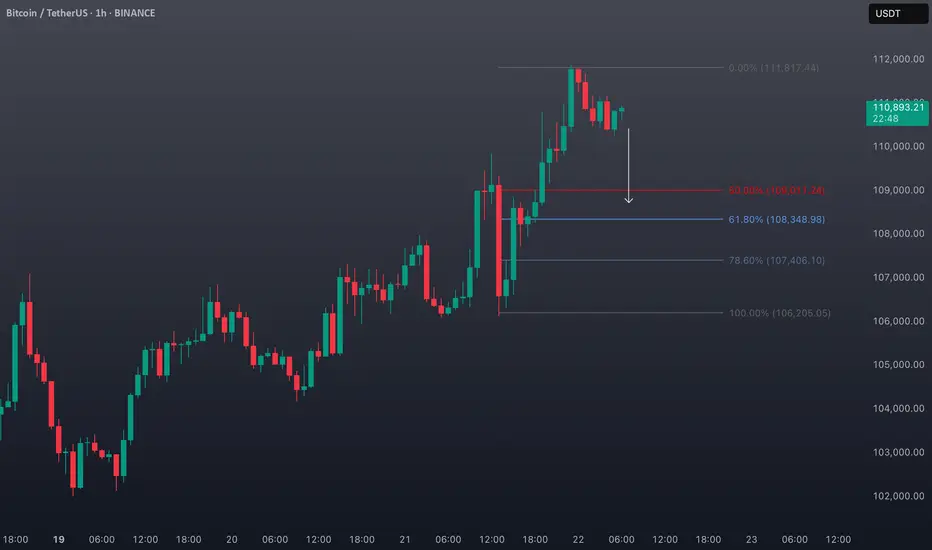
Bitcoin Overextended? Watch These Key Levels for the Next Move!BTC/USDT 1H – Retrace Before the Next Leg? 🚦
Bitcoin has shown impressive strength recently. On the 1-hour chart the current price action looks overextended 📈. After a strong impulsive move up, we’re seeing signs of exhaustion, with price stalling near the $111,800 region. Liquidity appears thin on the buy side, and there’s a cluster of potential sell stops resting below the current high in the form of sell stop.
I’m anticipating a retrace into the Fibonacci zone, with key levels at the 50% - 61.8% retracement. This area aligns with previous consolidation and could act as a magnet for price, especially as liquidity is swept from late long positions. If we see price rotate and break structure bullishly at my point of interest, I’ll be looking for a long entry opportunity. 🔄
Fundamentals & Macro Backdrop 🌍
On the fundamental side, Bitcoin remains sensitive to macroeconomic and geopolitical developments. Ongoing uncertainty in global politics and central bank policy continues to drive volatility across risk assets. Bitcoin’s correlation with tech stocks and the NASDAQ remains significant—recent data shows that when the NASDAQ pulls back, Bitcoin often follows suit. If we see a correction in tech stocks, be prepared for a retrace in BTC as well. 📉
Institutional interest is still strong, but short-term sentiment is cautious as traders await clarity on inflation, interest rates, and regulatory news. Keep an eye on U.S. economic data releases and any major headlines out of Washington or global hotspots, as these can quickly shift risk appetite.
Fundamentals and macro news remain key drivers—stay nimble!
Let’s see if BTC can reload for another leg up, or if broader market weakness drags it lower. Trade safe! 🚀
BTC Hits New All-Time High: Is a $128K Blow-Off Top Next?Bitcoin's Meteoric Ascent: New All-Time Highs Fuel $128K "Blow-Off Top" Predictions Amidst Unprecedented Adoption
The digital gold rush of the 21st century is reaching a fever pitch. Bitcoin (BTC), the pioneering cryptocurrency, has not only shattered previous records but is now tantalizingly close to new, stratospheric all-time highs, with analysts eyeing a potential "blow-off top" as high as $128,000. This electrifying surge, which saw BTC climb to within 1.5% of new peaks as bullish sentiment decisively overcame final resistance, is underpinned by a confluence of factors: soaring institutional and retail adoption, particularly in the United States, booming ETF inflows, growing political and regulatory support, and a shifting macroeconomic landscape that increasingly favors non-traditional assets. As of May 21, 2025, Bitcoin has firmly established itself above the $109,000 mark, a testament to its resilience and burgeoning mainstream acceptance.
The recent price action has been nothing short of spectacular. Bitcoin bulls have been relentlessly "grilling sellers," pushing the price to historic milestones. On May 21, 2025, Bitcoin etched a new all-time high (ATH) above $109,000, a landmark achievement that notably placed 100% of BTC holders into profit. This surge saw Bitcoin's market capitalization briefly surpass that of e-commerce giant Amazon, a symbolic victory highlighting its growing financial clout. Specific figures around this period include a climb to a record $109,302, and another peak at a historic $109,500, demonstrating the intense buying pressure and bullish conviction in the market. Analysts are now recalibrating their upside targets, with many calling for $116,000 as the next significant milestone on the path to even loftier valuations.
This bullish momentum isn't occurring in a vacuum. It's the culmination of years of development, increasing understanding, and a series of pivotal events that have collectively propelled Bitcoin into the financial limelight.
The American Bitcoin Boom: Adoption Surpasses Gold, Institutions Dive In
One of the most compelling narratives driving Bitcoin's current rally is its explosive growth in the United States. A staggering 50 million Americans now own Bitcoin, a figure that notably surpasses the 37 million gold holders in the country. This demographic shift signifies a profound change in investment preferences, particularly among younger generations who are increasingly comfortable with digital assets. Bitcoin is no longer a niche interest for tech enthusiasts; it's becoming a recognized component of diversified investment portfolios across a broad swathe of the American population.
The institutional embrace within the US is equally, if not more, impactful. US firms now hold an astonishing 94.8% of the Bitcoin reserves held by publicly traded companies globally. This concentration underscores the confidence American corporations have in Bitcoin as a treasury reserve asset, a hedge against inflation, and a potential source of significant returns. Furthermore, the United States is solidifying its position as the global epicenter of the Bitcoin industry, with 40% of all Bitcoin companies headquartered domestically. This robust ecosystem of miners, exchanges, wallet providers, and ancillary service companies fosters innovation and provides a strong foundation for continued growth.
The advent and subsequent success of Bitcoin Exchange Traded Funds (ETFs) have been a game-changer. These regulated financial products have opened the floodgates for a new wave of capital, allowing retail and institutional investors to gain exposure to Bitcoin through traditional brokerage accounts without the complexities of direct ownership and custody. The "booming ETF inflows" are a direct contributor to the recent price surge, creating sustained buying pressure and signaling widespread market acceptance.
Macroeconomic Tailwinds and Regulatory Optimism
Beyond direct adoption, broader economic and political factors are playing a crucial role. The recent new all-time high of $109,000 was notably set just nine days after the US and China closed a 90-day trade agreement. This resolution eased economic uncertainty and market jitters that had previously weighed on global markets. In such an environment, assets perceived as hedges against traditional market volatility or fiat currency devaluation, like Bitcoin and gold, often thrive. Indeed, concurrent with Bitcoin's rise, concerns such as Japan's debt woes have contributed to gold surpassing the $3,300 mark, indicating a broader flight to alternative stores of value.
Furthermore, there's growing optimism around US regulations concerning cryptocurrencies. While the regulatory landscape is still evolving, recent pronouncements and actions suggest a move towards greater clarity and a more accommodative stance, rather than outright prohibition. This "growing political support" is crucial for long-term institutional commitment, as regulatory uncertainty has historically been a significant barrier to entry for larger, more conservative investors. The fact that Bitcoin climbed to a record of $109,302, breaching a previous high set around the time of a major political event like a presidential inauguration (specifically referenced as Trump's inauguration on Jan. 20 in a historical context for a previous ATH), often correlates with market sentiment interpreting political or regulatory shifts as favorable.
The "Bitcoin Strategic Reserve" (BSR): A Paradigm Shift for National Economies?
An intriguing, albeit more speculative, concept gaining traction is the idea of a "Bitcoin Strategic Reserve" (BSR). While not yet a formal policy in any major nation, the discussion itself highlights Bitcoin's evolving perception from a purely speculative asset to one with potential strategic geopolitical and economic importance.
A BSR would involve a nation-state, such as the United States, acquiring and holding Bitcoin as part of its national reserves, much like it currently holds gold or foreign currencies. The rationale behind such a move could be multifaceted:
1. Hedging Against Fiat Devaluation: As central banks globally continue to engage in monetary expansion, concerns about the long-term purchasing power of fiat currencies persist. Bitcoin, with its fixed supply, offers a potential hedge against this inflation.
2. Participating in a New Financial System: If Bitcoin continues its trajectory towards becoming a globally recognized store of value or even a medium of exchange for certain international transactions, holding it in reserve would position a nation to participate actively in this emerging financial infrastructure.
3. Technological Leadership: For a country like the US, which already leads in Bitcoin company headquarters and corporate holdings, establishing a BSR could further cement its leadership in the digital asset space, attracting talent and capital.
4. Economic Resilience: In a future where digital currencies play a more significant role, a BSR could offer a degree of economic resilience and autonomy, reducing reliance on traditional financial systems or the currencies of other nations.
The implications of a major economic power like the US even seriously considering, let alone implementing, a BSR would be monumental for Bitcoin's legitimacy and price. It would signal ultimate institutional acceptance and could trigger a wave of similar considerations by other nations, creating immense demand for a limited supply of BTC. While the "Bitcoin Strategic Reserve Explained and What BSR Means for the US Economy" remains a topic of forward-looking discussion, its emergence in financial discourse is a testament to how far Bitcoin has come.
The Path to $128K: Understanding the "Blow-Off Top"
With Bitcoin having decisively broken past $109,000 and upside targets of $116,000 now in common parlance, the ultimate bull-case scenario being discussed is a "blow-off top" potentially reaching $128,000 or even higher.
A "blow-off top" is a chart pattern that signifies a steep and rapid price increase in an asset, often on high volume, followed by an equally sharp reversal. It typically occurs at the end of a prolonged bull market or a parabolic advance. The psychology behind it involves:
1. Euphoria and FOMO (Fear Of Missing Out): As prices accelerate, media attention intensifies, and stories of quick riches abound. This draws in a flood of retail investors who don't want to miss out on the gains.
2. Exhaustion of Buyers: The parabolic rise eventually becomes unsustainable. The last wave of enthusiastic buyers enters at or near the peak.
3. Smart Money Distribution: Experienced traders and institutions, who may have accumulated positions much lower, begin to sell into this heightened demand, taking profits.
4. Sharp Reversal: Once buying pressure is exhausted and selling pressure mounts, the price can fall dramatically as latecomers panic-sell and stop-losses are triggered.
Predicting the exact peak of a blow-off top is notoriously difficult. However, analysts use a combination of technical analysis (chart patterns, momentum indicators, Fibonacci extensions), on-chain data (network activity, holder behavior), and market sentiment to identify potential price targets and warning signs. The $128,000 figure is likely derived from such analyses, representing a significant psychological level or a projection based on previous market cycle behavior.
Navigating the Bull Market: Indicators for Identifying a Cycle Top
While the current sentiment is overwhelmingly bullish, savvy Bitcoin traders and investors are always mindful of market cycles and the potential for corrections or trend reversals. The question, "Is Bitcoin price close to a cycle top?" is one that prudent market participants constantly evaluate. Several indicators can help traders gauge whether a market might be overheating:
1. Moving Average Convergence Divergence (MACD): This trend-following momentum indicator can show bearish divergences, where the price makes new highs, but the MACD fails to do so, signaling weakening momentum.
2. Relative Strength Index (RSI): An RSI reading above 70 is generally considered overbought, and readings above 80 or 90 in a strong bull market can signal extreme conditions, though Bitcoin can remain overbought for extended periods. Bearish divergences on the RSI are also key.
3. On-Chain Metrics (e.g., MVRV Z-Score, Puell Multiple, SOPR):
o MVRV Z-Score (Market Value to Realized Value): Compares Bitcoin's market cap to its realized cap (the price at which each coin last moved). High Z-scores indicate the market cap is significantly higher than the average cost basis, suggesting the asset is overvalued and potentially near a top.
o Puell Multiple: Looks at the supply side of Bitcoin's economy – miners and their revenue. It divides the daily issuance value of bitcoins (in USD) by the 365-day moving average of daily issuance value. High values suggest miner profitability is high compared to historical norms, which has sometimes coincided with market tops.
o Spent Output Profit Ratio (SOPR): This indicates if holders are, on average, selling in profit or loss. Values significantly above 1 suggest holders are realizing substantial profits, which can increase sell pressure. A sustained drop below 1 after a peak can signal a shift in trend.
4. Logarithmic Growth Curves: Bitcoin's long-term price action has often respected logarithmic growth channels. When the price reaches the upper band of these channels, it has historically indicated a market top.
5. Funding Rates and Open Interest in Derivatives Markets: Extremely high positive funding rates on perpetual swaps indicate that an overwhelming number of traders are long and paying a premium to maintain those positions. This can signal excessive bullishness and a crowded trade, making the market vulnerable to a long squeeze if prices reverse. High open interest can also exacerbate volatility.
While Bitcoin is currently refusing to give up on its quest to revisit $108,000 (a level now surpassed) and beyond, concerns over a trend change, though perhaps quieter amidst the euphoria, are always present in the minds of seasoned investors. These indicators provide a more objective lens through which to assess the sustainability of the current rally.
The Road Ahead: Uncharted Territory with Immense Potential
As Bitcoin forges new all-time highs, it enters uncharted territory. The confluence of unprecedented US adoption, robust institutional investment via ETFs, a more favorable regulatory outlook, and supportive macroeconomic conditions has created a potent cocktail for price appreciation. The surpassing of Amazon's market cap, even if temporary, and the fact that 100% of BTC holders are in profit, are powerful psychological milestones that can fuel further confidence.
The predictions of a $116,000 interim target and a potential $128,000 blow-off top are no longer fringe theories but are being seriously discussed by mainstream analysts. The narrative of Bitcoin as "digital gold" is gaining more traction than ever, especially as traditional safe havens like gold also see increased interest amidst global economic uncertainties like Japan's debt situation.
However, the path is unlikely to be linear. Bitcoin's inherent volatility means that sharp corrections can and will occur, even within a broader uptrend. The "concerns over a trend change" will likely grow louder as prices reach more extreme levels, and profit-taking becomes more tempting. Investors should remain vigilant, utilize the available indicators to assess market conditions, and practice sound risk management.
In conclusion, May 2025 has marked a historic period for Bitcoin. Its surge above $109,000, driven by a powerful combination of fundamental adoption and favorable market dynamics, has set the stage for potentially even more dramatic price action. Whether the ultimate peak of this cycle is $116,000, $128,000, or another figure entirely, one thing is clear: Bitcoin has firmly cemented its place in the global financial landscape, and its journey is far from over. The coming weeks and months will be closely watched by investors worldwide as the world's preeminent cryptocurrency continues to redefine the boundaries of financial assets.
________________________________________
Disclaimer: This article is for informational purposes only, based on the provided snippets, and should not be considered financial advice. Investing in Bitcoin and other cryptocurrencies is highly speculative and carries a significant risk of loss. Past performance is not indicative of future results. Always conduct your own thorough research and consult with a qualified financial advisor before making any investment decisions.
Bitcoin BTC Bullish Setup: Here’s What I’m Watching Next!Bitcoin (BTC) is looking incredibly strong right now on the higher timeframes 🔥. We’re seeing a clear bullish trend with consistent higher highs and higher lows, which keeps my bias firmly to the upside 🚀...
In this video, I take you through my full multi-timeframe analysis, breaking down:
- The macro bullish structure unfolding on the daily chart 🗓️
- My key levels of interest for a potential pullback entry 🎯
- What I’m watching for on the 4H and 1H charts to confirm continuation setups ⏱️
- My target zones, including recent swing highs and areas of liquidity 📍
If Bitcoin gives us a healthy retrace, I’ll be watching closely for a bullish break of structure to confirm a high-probability buy opportunity 🟢.
⚠️ Reminder: This is not financial advice — always do your own research and manage your risk appropriately. 🛡️💼

#BTC/USDT Highest Daily Close! What it Means? $117k on cards?Bitcoin Daily Update – Bulls Take the Lead
Bitcoin just recorded its highest daily close in history at $106,849.99 (Binance), surpassing the previous record of $106,143.82 set on January 21st. While the difference is minor in percentage terms, it's still a meaningful win for the bulls.
The next key level to watch is $113k to $117k, based on the Fibonacci extension target.
For confirmation, we need another solid daily candle close above the current range. The $106K resistance has already been broken, and BTC is holding above it, indicating strong bullish momentum.
To avoid getting trapped in a fakeout, consider adding the 14 EMA to your chart. As long as BTC holds above this EMA, the uptrend is likely to continue.
Once BTC's show is over, Altcoins will likely follow suit.
INVALIDATION OF THIS CHART: A close below $102k in confluence with 14EMA in Daily.
I hope this update gives you actionable insight. If it did, feel free to follow and like. Let me know your thoughts or questions in the comments, I read every one.
Thank you
#PEACE

$108K BTC ATH in Sight Despite ETF & Moody's HeadwindsBitcoin's Turbulent Ascent: Charting a Course Through Volatility, Institutional Embrace, and the $108,000 Horizon Amid Shifting Economic Sands
The world of cryptocurrency is once again fixated on its undisputed leader, Bitcoin (BTC). The digital behemoth is currently navigating a period of intense market activity, marked by dramatic price swings, a nuanced evolution in institutional engagement, and a striking resilience in the face of macroeconomic tremors. As Bitcoin flirts with the $102,900 threshold and repeatedly tests the crucial $104,000 psychological barrier, the air is thick with anticipation. Market analysts and enthusiasts alike are closely watching for a potential surge that could propel Bitcoin beyond its previous all-time high (ATH) to an ambitious $108,000 within the current month. This intricate dance unfolds against a complex global backdrop: a recent downgrade of US debt by Moody's, significant and strategic Bitcoin accumulation by institutional players like Japan's Metaplanet, and observable shifts in the open interest of Bitcoin Exchange Traded Funds (ETFs).
The narrative for Bitcoin in May 2025 is one of inherent strength and heightened expectation. While a recent, sharp pullback from the $107,000 mark was widely attributed to investors capitalizing on recent gains—a classic profit-taking maneuver—rather than a panicked reaction to Moody's revised outlook on US debt, the digital asset staged a swift and impressive recovery, climbing back towards the $105,000 level. This rapid rebound underscores a complex interplay of market forces, investor sentiment, and perhaps a growing perception of Bitcoin as an asset with unique characteristics. This resilience, buttressed by robust underlying network fundamentals and an increasingly confident institutional presence, paints a compelling and multifaceted picture of Bitcoin's current trajectory and its potential future.
Navigating Price Swings: Profit-Taking, Market Maturity, and a Dismissal of Moody's Downgrade
Bitcoin's recent price journey has been nothing short of a rollercoaster, a testament to its well-documented volatility. However, these fluctuations also hint at a market that is gradually maturing in its response to external economic shocks. The digital currency experienced a notable dip, with some initial commentary linking it to a broader "risk-off" sentiment ostensibly triggered by Moody's downgrade of US sovereign debt. Indeed, Moody's Investors Service adjusted the U.S. government's long-term issuer and senior unsecured ratings from the pristine AAA to Aa1. The agency cited mounting concerns over the nation's escalating debt burden and the sustainability of its interest payments, a move that traditionally sends ripples of caution through global financial markets, often prompting investors to reduce exposure to assets perceived as higher risk.
However, the narrative surrounding Bitcoin's reaction quickly evolved. The sharp sell-off from its recent high near $107,000 was predominantly identified by market observers as a consequence of profit-taking. Investors who had benefited from the preceding upward trend chose to realize their gains, a standard market dynamic in any asset class. This distinction is critically important. It suggests that the selling pressure was primarily an internal market mechanism within the cryptocurrency space itself, rather than a direct, sustained erosion of confidence directly attributable to the US debt downgrade.
In a remarkable display of this independent strength, Bitcoin demonstrated a robust recovery, rallying back towards the $105,000 mark. This price action was widely interpreted as Bitcoin effectively "ignoring" or "shrugging off" the downgrade's potential long-term implications for its own valuation. Some market analysts posit that this behavior lends further credence to Bitcoin's burgeoning role as a potential hedge against instability in traditional financial systems and a perceived decline in the long-term purchasing power of fiat currencies. While Bitcoin's price did exhibit a corrective phase around the time of the downgrade announcement, its capacity to swiftly regain lost ground suggests that the market may have either already factored in such macroeconomic developments or, more significantly, views Bitcoin's fundamental, long-term value proposition as increasingly detached from traditional economic indicators. The market's reaction, characterized by an initial dip followed by a spirited recovery, highlights Bitcoin's complex and evolving relationship with macroeconomic news. It behaves at times like a risk asset, sensitive to global liquidity and investor sentiment, and at other times, it exhibits characteristics of a safe-haven asset, sought after during periods of uncertainty.
The Alluring Prospect of a New Zenith: Is $108,000 Bitcoin's Next Landmark?
Amidst this characteristic volatility, a palpable undercurrent of optimism pervades the Bitcoin market. Strong suggestions and analytical forecasts point towards the possibility that Bitcoin could not only retest but decisively surpass its previous all-time high, potentially charting a course towards $108,000, and perhaps even higher, within the current month. Technical analyses, which scrutinize historical price patterns and market statistics to predict future movements, lend support to this bullish outlook. Some chartists and forecasters have identified take-profit targets for bullish positions clustering around the $109,158.98 region.
Currently, Bitcoin's price appears to be in a consolidation phase, hovering around the $102,957 mark after a retreat from a local peak of $107,115. Market participants are intensely focused on key resistance levels. The zone between $105,000 and $108,700 is viewed as a particularly critical hurdle. A decisive daily trading session closing above the $108,700 level could act as a powerful catalyst, potentially triggering a fresh wave of buying interest and propelling Bitcoin towards the $110,000 milestone. Should this momentum be sustained, a further ascent to $115,000 by the end of May is considered a plausible scenario by optimistic analysts.
This bullish sentiment is further amplified by what some market commentators describe as Bitcoin's "volatile liquidity run." This phenomenon, characterized by rapid shifts in market liquidity and price, is believed by some analysts to be capable of paving the way for new record highs. The market has recently observed unusual trading patterns, such as CME (Chicago Mercantile Exchange) Bitcoin futures contracts leading volatile price action, even during weekend trading sessions when traditional markets are closed. This indicates a dynamic and continually evolving market structure, increasingly influenced by institutional-grade trading venues.
Historically, Bitcoin's price has demonstrated a notable correlation with global liquidity conditions, particularly metrics like the M2 money supply. Expansions in M2, representing a broader measure of money in circulation, have often coincided with upward trends in Bitcoin's price. While current expansions in M2 could theoretically provide a tailwind for Bitcoin, the future trajectory of global liquidity is somewhat clouded by persistent inflation concerns and mixed signals from various economic sectors. Nevertheless, the potent combination of strong technical chart patterns, the potential for favorable liquidity conditions, and a resilient underlying market sentiment keeps the prospect of a new all-time high firmly within the realm of possibility. Analysts are keenly eyeing the $108,000 mark as a significant psychological and technical target. A convincing breakout above this level could potentially unleash further euphoric momentum, drawing in more retail and institutional capital.
The Institutional Equation: ETF Open Interest Moderates, While Metaplanet Intensifies Accumulation
The role and behavior of institutional investors continue to be a pivotal factor shaping Bitcoin's market dynamics and its journey towards mainstream acceptance. Recently, a noteworthy development was observed in the Bitcoin ETF space: open interest saw a 5% dip, settling at approximately $29.47 billion. This occurred even as Bitcoin itself maintained its price position near the $102,900 level. This decline in open interest, which represents the total number of outstanding derivative contracts that have not been settled, coupled with a discernible slowdown in weekly inflows into Bitcoin ETFs (which were reported as the lowest in a month, at $603.74 million for the period of May 12-16), suggests a degree of caution or perhaps a phase of consolidation among ETF investors. This follows a period of particularly heightened activity and significant inflows earlier in the year, often associated with the launch and growing popularity of spot Bitcoin ETFs in major markets. The relatively rangebound trading of Bitcoin, oscillating primarily between $102,711 and $104,971 during this period, likely contributed to this softer, more measured demand for ETF exposure.
However, it would be premature to interpret this dip in ETF open interest as a signal of a broader or sustained institutional retreat from Bitcoin. Activity in the derivatives markets, for instance, paints a more nuanced, and in some aspects, more bullish picture. Strong demand for call options, which give buyers the right but not the obligation to buy Bitcoin at a specific price in the future, indicates that a segment of sophisticated traders is actively positioning for an upward price movement, with some targeting levels around $110,000. In futures markets, when open interest rises in tandem with price, it typically signals that new capital is entering the market, reinforcing the strength and conviction behind the prevailing trend.
Contrasting sharply with the moderation observed in ETF flows is the aggressive and strategic accumulation of Bitcoin by corporate entities, most notably exemplified by Metaplanet. The Japanese investment firm recently captured headlines with its announcement of an additional purchase of 1,004 Bitcoin. This transaction marked its second-largest single acquisition of the cryptocurrency to date. This significant purchase, valued at approximately $104.3 million at the time of execution, increased Metaplanet's total Bitcoin holdings to an impressive 7,800 BTC. This substantial stash is currently worth over $800 million, fluctuating slightly with market prices but generally estimated between $806 million and $807 million. The company disclosed that its average acquisition price for this latest tranche of Bitcoin was around 15.13 million Japanese yen per BTC. Crucially, its overall average cost per BTC for its entire holdings now stands at approximately $91,340.
Metaplanet's Bitcoin strategy is notably ambitious and long-term in its orientation. The company has publicly stated its goals of accumulating 10,000 BTC by the end of 2025 and has even hinted at a more audacious long-term vision of potentially holding up to 1% of the total global Bitcoin supply. This proactive accumulation positions Metaplanet as a significant corporate holder of Bitcoin, particularly prominent within the Asian financial landscape. Its approach has drawn frequent comparisons to that of Strategy (formerly MicroStrategy), the US-based software intelligence firm renowned for its pioneering and substantial investments in Bitcoin as a primary treasury reserve asset.
Such large-scale corporate buying, as demonstrated by Metaplanet and Strategy, can exert considerable upward pressure on Bitcoin's price. By acquiring and holding substantial amounts of BTC, these corporations effectively reduce the freely circulating supply available on exchanges, a phenomenon sometimes referred to as exerting deflationary pressure, especially when corporate and even governmental buying activity is rapid and sustained. Metaplanet's actions, alongside those of other forward-thinking firms, underscore a growing and significant trend: the diversification of corporate treasuries into digital assets. These companies increasingly view Bitcoin not just as a speculative investment, but as a strategic reserve asset, a potential hedge against inflation, and a safeguard against the perceived long-term devaluation of fiat currencies. This movement has seen a notable surge in Bitcoin holdings by businesses globally, particularly since early 2024, signaling a paradigm shift in how corporations manage their financial reserves.
The Bedrock of Bitcoin: Network Health, Hashrate Resilience, and Expanding Mining Margins
Beneath the often-turbulent surface of price charts and the ebb and flow of institutional capital, the fundamental health and security of the Bitcoin network itself remain remarkably robust. Investment banking giant JPMorgan recently reported that the Bitcoin Network Hashrate experienced a slight but discernible rise in the first two weeks of May. The average hashrate during this period was noted at 88.5 Exahashes per second (EH/s), representing a 2% increase. Other data sources from the blockchain analytics community corroborate this trend, showing the daily hashrate reaching even higher levels, such as 831 EH/s as of May 1, 2025, and even peaking at an impressive 921 EH/s earlier in the month. This represents a significant increase from the lows observed in 2024. As of May 15, 2025, the Bitcoin Network Hash Rate was recorded at approximately 864.51 million Terahashes per second (TH/s), which translates to 864.51 EH/s. This continued upward trajectory in computational power dedicated to the network, even in the aftermath of events like the Bitcoin halving (which reduces the block rewards issued to miners), underscores the sustained confidence of miners and contributes directly to the network's formidable security.
Adding to this positive picture, mining gross margins have reportedly expanded sequentially throughout this month. JPMorgan's analysis highlighted that as Bitcoin prices appreciated, miners' gross profit margins also saw a month-on-month expansion, leading to improved economic conditions for those securing the network. The "hash price," a key metric representing daily mining profitability per unit of hash power, increased by a notable 13% when compared to April's figures. In the initial two weeks of May, Bitcoin miners earned approximately $50,100 per EH/s in daily block rewards (which includes both newly minted bitcoins and transaction fees). This figure is up 13% from the previous month and shows a 3% year-on-year increase.
This financial viability is crucial. It enables miners to continue investing in their operations, which includes covering significant energy costs and upgrading their specialized hardware (ASICs – Application-Specific Integrated Circuits) to maintain competitiveness and efficiency. Leading manufacturers like Bitmain and MicroBT continuously release more powerful and energy-efficient mining rigs. The fact that the market price of Bitcoin remains significantly higher than the average cost of mining (estimated by some analyses to be around $36,800 per BTC) indicates a healthy profit margin for the mining industry. These margins are comparable to those observed at the beginning of previous bull market cycles, further fueling optimism. Some publicly traded mining companies, such as LM Funding, have reported improved mining margins in the first quarter of 2025, successfully navigating the headwinds from the halving event through operational improvements, strategic power agreements, and in some cases, diversifying revenue streams like power sales.
The Untamed Frontier: Meme Coins and the Curious Case of BTC Bull Token
While Bitcoin, with its established infrastructure and growing institutional adoption, commands the lion's share of attention, the broader cryptocurrency ecosystem continues to be a fertile ground for innovation, experimentation, and, undeniably, speculation. One of the most prominent and often controversial manifestations of this is the meme coin phenomenon. The question frequently arises in online forums and social media: "Best Meme Coins like BTC Bull Token Next to Surge?" This highlights the persistent allure of these unique digital assets. Meme coins are a distinct category of cryptocurrency, typically inspired by internet memes, viral social media trends, or popular culture. Their value is often driven less by intrinsic utility or underlying technological fundamentals and more by community-generated hype, speculative fervor, and the quest for rapid, exponential gains. They are infamous for their extreme volatility, capable of producing meteoric price surges in short periods, but also equally susceptible to precipitous crashes.
BTC Bull Token ($BTCBULL) has emerged as a specific example within this highly speculative niche. It has positioned itself with taglines such as "the official Bitcoin meme coin" or a "Bitcoin-themed meme coin," attempting to leverage the brand recognition and market sentiment surrounding Bitcoin itself. Its core proposition appears to be a system of rewarding its token holders with airdrops of actual Bitcoin when BTC achieves certain predetermined price milestones (for example, when Bitcoin's price reaches $150,000, $200,000, or $250,000). Additionally, the $BTCBULL project outlines plans for token burn events. These events, designed to reduce the total supply of $BTCBULL tokens and theoretically increase their scarcity, are scheduled to occur when Bitcoin's price increases by specific increments (e.g., for every $25,000 increase in Bitcoin's price, starting from a baseline of $125,000). Currently reported to be in its presale phase, projects like BTC Bull Token aim to capitalize on the excitement and upward momentum of Bitcoin bull runs. They offer a highly leveraged, and therefore highly risky, way for speculators to potentially profit from Bitcoin's upside.
It is absolutely paramount for anyone considering an allocation to meme coins, including those linked thematically to Bitcoin, to thoroughly understand their inherent high-risk, high-reward nature. These assets are, by definition, intensely speculative. They are highly susceptible to "pump-and-dump" schemes, where coordinated buying inflates the price before early holders sell off en masse, leaving later entrants with significant losses. Many meme coins lack long-term viability, tangible real-world applications, or robust development teams. While the allure of quick, life-changing profits can be undeniably strong, the potential for substantial, and often total, financial loss is equally, if not more, significant. Prudent investors should approach such tokens with extreme caution, treating them more as a form of high-stakes gambling or digital entertainment rather than a serious, fundamentally-driven investment. Due diligence, a clear understanding of the risks involved, and an investment amount one can afford to lose are critical prerequisites.
Weaving the Narrative: A Complex Market of Resilience, Adoption, and Speculation
The current Bitcoin landscape presents a fascinating and intricate tapestry, woven from a diverse array of threads. We observe robust price action that seems increasingly capable of defying or quickly recovering from macroeconomic pressures. There is the steady, albeit sometimes fluctuating, march of institutional adoption, most visibly through products like ETFs, but also through direct corporate treasury allocations. The unwavering commitment of long-term corporate accumulators, exemplified by firms like Metaplanet, adds another layer of demand. Underpinning all of this is the fundamental strength and security of the Bitcoin network itself, evidenced by a healthy and growing hashrate. And, at the periphery, the ever-present speculative fervor of the broader crypto market, including the volatile world of meme coins, adds a unique dynamism.
Bitcoin's demonstrated ability to absorb the potential shock of Moody's US debt downgrade and subsequently rally, largely on the back of what was identified as profit-taking, indicates a growing maturity within its market. It also suggests a potential decoupling, at least to some extent, from the reflexive reactions often seen in traditional financial markets. The widespread anticipation of a new all-time high, with many eyes fixed on the $108,000 level, is not without foundation. It is supported by various technical indicators, ongoing positive sentiment, and a persistent bullish undercurrent in many segments of the market. However, the recent dip in ETF open interest serves as a salient reminder that institutional sentiment can be subject to caution and re-evaluation, and that the path to higher valuations is rarely a straight, uninterrupted line. Corrections and consolidations are natural parts of any market cycle.
Metaplanet's aggressive Bitcoin acquisition strategy highlights a different, perhaps more profound, facet of institutional interest. This is not just about short-term trading or exposure to a new asset class; it's about a long-term conviction in Bitcoin's potential role as a strategic treasury reserve asset. Such a trend, if it continues to grow, could have a more sustained and significant impact on Bitcoin's supply and demand dynamics over time. Meanwhile, the healthy hashrate figures and reports of improving miner profitability provide a solid and reassuring foundation for the network's continued secure operation and the confidence of its participants.
The emergence and popularity of meme coins like BTC Bull Token, while arguably peripheral to Bitcoin's core value proposition and its aspirations as a global financial asset, reflect the undeniable speculative energy that often accompanies bull markets in the cryptocurrency space. It serves as a reminder of the diverse and sometimes bewildering ecosystem that Bitcoin anchors – an ecosystem that now ranges from highly sophisticated institutional financial products and regulated investment vehicles to community-driven, high-risk, and often ephemeral digital tokens.
Gazing Forward: A Market Poised for Potentially Defining Movements
As May 2025 continues to unfold, the Bitcoin market stands at a fascinating and potentially pivotal juncture. The confluence of technical factors, institutional behavior, network fundamentals, and macroeconomic influences creates an environment ripe for significant moves. Several key elements will be crucial to watch in the coming weeks and months:
• Price Action Around Critical Levels: Bitcoin's ability to decisively breach and, more importantly, hold above the formidable resistance zone generally identified between $105,000 and $108,700 will be a critical determinant of whether a new all-time high is imminent. A strong breakout could ignite further momentum. Conversely, key support levels, likely around the $100,000 to $102,000 range, must hold firm to maintain the prevailing bullish market structure. A break below these supports could signal a deeper correction.
• Institutional Capital Flows: Continued monitoring of inflows and outflows from Bitcoin ETFs, as well as changes in their open interest, will provide valuable insights into shorter-term institutional sentiment and positioning. Simultaneously, tracking further corporate accumulation by entities like Metaplanet and Strategy will offer signals regarding long-term conviction and the adoption of Bitcoin as a treasury asset.
• Network Fundamentals and Security: Sustained growth in the Bitcoin network hashrate and the maintenance of healthy mining economics will continue to be vital indicators of the network's underlying security, resilience, and the confidence of its core infrastructure providers. Any significant disruptions or negative trends in these areas could impact broader market sentiment.
• Overarching Macroeconomic Influences: While Bitcoin has demonstrated a degree of resilience, the broader global economic climate will undoubtedly continue to exert an influence. Key factors to watch include inflation data from major economies, monetary policy decisions from central banks (particularly regarding interest rates and quantitative easing/tightening), and any further significant developments related to sovereign debt or geopolitical stability.
• Prevailing Market Sentiment: The overall sentiment within the cryptocurrency market, as reflected in metrics like the Fear & Greed Index, activity in derivatives markets (funding rates, options skew), and the tenor of discussions within online communities and social media, will play a significant role in driving short-term price movements. This is particularly true for the more speculative assets within the ecosystem.
Bitcoin's journey is one of perpetual evolution, marked by innovation, debate, and dramatic market cycles. The current phase, characterized by ambitious price targets, strategic institutional chess moves, and robust underlying network strength, suggests that the coming weeks and months could be particularly pivotal in shaping its longer-term narrative. While the prospect of Bitcoin surpassing the $108,000 mark and venturing into new price discovery territory excites many participants, the asset's inherent volatility, coupled with the speculative elements that froth at the market's fringes, necessitates a balanced and informed perspective. Acknowledging both the transformative potential of Bitcoin and the considerable risks that continue to define its unique position in the global financial landscape remains essential for anyone navigating this dynamic space.

Bitcoin Stalls, But Chart Watchers Eye $300,000 Peak: Here's Whe
Bitcoin, the world's leading cryptocurrency, has experienced a period of consolidation, leaving investors and analysts alike pondering its next move. While the price has stalled below the $105,000 mark, a confluence of factors, including popular predictive models and bullish sentiment from prominent crypto analysts, suggests that a significant surge could be on the horizon. The potential for Bitcoin to reach new all-time highs, possibly soaring to between $275,000 and $300,000 by October of this year, is fueling excitement and speculation within the crypto community.
This article delves into the factors driving the bullish outlook for Bitcoin, examining the predictive models, analyst forecasts, and underlying fundamentals that support the possibility of a substantial price increase. We will explore the potential catalysts that could propel Bitcoin to new heights and analyze the technical indicators that chart watchers are monitoring closely.
Predictive Models Point to a Massive Surge
One of the primary drivers of the bullish sentiment surrounding Bitcoin is the existence of popular predictive models that suggest a massive price surge in the coming months. These models, often based on historical data, supply and demand dynamics, and other relevant factors, attempt to forecast the future price of Bitcoin with varying degrees of accuracy.
One such model, which has gained considerable attention in the crypto community, points to a potential surge to between $275,000 and $300,000 by October of this year. While the specifics of this model are not explicitly detailed in the prompt, it is likely based on factors such as Bitcoin's scarcity, its increasing adoption as a store of value, and the potential for institutional investment to drive demand.
It is important to note that predictive models are not foolproof and should not be taken as definitive guarantees of future price movements. However, they can provide valuable insights into potential scenarios and help investors make informed decisions.
Analyst Forecasts: $159,000 This Cycle
In addition to predictive models, bullish forecasts from prominent crypto analysts are also contributing to the optimistic outlook for Bitcoin. One analyst, in particular, has predicted that Bitcoin's price could reach $159,000 this cycle.
While the specific methodology used by this analyst is not detailed in the prompt, it is likely based on a combination of technical analysis, fundamental analysis, and market sentiment. Technical analysis involves studying price charts and other technical indicators to identify potential trends and patterns. Fundamental analysis involves evaluating the underlying value of Bitcoin based on factors such as its adoption rate, network security, and regulatory environment. Market sentiment involves gauging the overall mood and expectations of investors in the crypto market.
The analyst's forecast of $159,000 this cycle suggests a belief that Bitcoin is currently undervalued and that its price will eventually catch up to its intrinsic value.
Bitcoin IS The Opt Out
The phrase "Bitcoin IS The Opt Out" encapsulates a growing sentiment within the crypto community that Bitcoin represents a viable alternative to traditional financial systems. This sentiment is based on the belief that Bitcoin offers several advantages over traditional currencies and financial institutions:
• Decentralization: Bitcoin is not controlled by any single entity, such as a government or central bank. This decentralization makes it resistant to censorship and manipulation.
• Scarcity: Bitcoin has a limited supply of 21 million coins, which makes it a scarce asset. This scarcity is expected to drive its price higher over time as demand increases.
• Transparency: All Bitcoin transactions are recorded on a public ledger called the blockchain. This transparency makes it difficult to engage in illicit activities using Bitcoin.
• Security: The Bitcoin network is secured by cryptography, making it difficult to hack or tamper with.
The belief that Bitcoin offers a viable "opt out" from traditional financial systems is driving increased adoption and investment in the cryptocurrency.
BTC Price to $116K Next? 'Early Week' All-Time High
The prospect of Bitcoin reaching $116,000 in the near future, potentially even achieving an all-time high early in the week, is further fueling bullish sentiment. This forecast, attributed to a Bitcoin trader, suggests that the cryptocurrency is poised to break out of its current consolidation phase and enter a new period of price discovery.
The trader's forecast is likely based on technical analysis, identifying potential breakout patterns and momentum indicators that suggest an imminent surge in price. The expectation of an "early week" all-time high suggests a belief that the market is primed for a rapid and decisive move to the upside.
Leaving the Tight Range Behind
The statement that "Bitcoin is in line to leave its tight range behind in the coming days" suggests that the period of consolidation is nearing its end. A tight trading range typically indicates a period of indecision in the market, where buyers and sellers are evenly matched. However, such periods often precede significant price movements, as pent-up energy is released in one direction or another.
The expectation that Bitcoin will leave its tight range behind suggests a belief that the balance of power is shifting in favor of buyers, setting the stage for a potential breakout to the upside.
Retaking All-Time Highs and Pushing into Price Discovery
The ultimate goal for Bitcoin bulls is to see the cryptocurrency retake its all-time highs and push into price discovery. Price discovery refers to the process of establishing a new price level for an asset when it breaks out of its previous range.
When Bitcoin reaches a new all-time high, it enters a period of price discovery, where there are no historical resistance levels to impede its upward movement. This can lead to rapid and substantial price increases, as buyers are willing to pay higher and higher prices to acquire the asset.
Potential Catalysts for a Bitcoin Surge
Several potential catalysts could propel Bitcoin to new all-time highs and trigger a period of price discovery:
• Increased Institutional Investment: As more and more institutional investors, such as hedge funds, pension funds, and corporations, allocate capital to Bitcoin, demand for the cryptocurrency is likely to increase, driving its price higher.
• Regulatory Clarity: Greater regulatory clarity surrounding Bitcoin and other cryptocurrencies could remove a major source of uncertainty and encourage more investors to enter the market.
• Mainstream Adoption: As Bitcoin becomes more widely accepted as a form of payment and a store of value, its adoption rate is likely to increase, driving demand and price appreciation.
• Macroeconomic Factors: Macroeconomic factors, such as inflation, currency devaluation, and geopolitical instability, could drive investors to seek refuge in Bitcoin as a safe haven asset.
Technical Indicators to Watch
Chart watchers are closely monitoring several technical indicators to gauge the potential for a Bitcoin surge:
• Breakout Patterns: Identifying potential breakout patterns, such as ascending triangles, cup and handle formations, and flag patterns, can provide clues about when Bitcoin is likely to break out of its current range.
• Volume: Monitoring trading volume can help to confirm the validity of a breakout. A breakout accompanied by high volume is generally considered more reliable than a breakout accompanied by low volume.
• Momentum Indicators: Momentum indicators, such as the Relative Strength Index (RSI) and the Moving Average Convergence Divergence (MACD), can help to gauge the strength of a trend and identify potential overbought or oversold conditions.
• Support and Resistance Levels: Identifying key support and resistance levels can help to anticipate potential price movements and set appropriate entry and exit points.
Conclusion: Awaiting the Next Chapter in Bitcoin's Story
Bitcoin's recent period of consolidation has left investors and analysts eager to see what the future holds. While the price has stalled below $105,000, a confluence of factors, including predictive models, analyst forecasts, and bullish market sentiment, suggests that a significant surge could be on the horizon.
The potential for Bitcoin to reach new all-time highs, possibly soaring to between $275,000 and $300,000 by October of this year, is fueling excitement and speculation within the crypto community. Whether Bitcoin achieves these lofty targets remains to be seen, but the stage is set for what could be another exciting chapter in the cryptocurrency's story. As always, investors should conduct their own research, assess their risk tolerance, and make informed decisions before investing in Bitcoin or any other cryptocurrency. The journey ahead promises to be volatile, but the potential rewards could be substantial for those who are willing to navigate the risks.