BTC/USDT Analysis – Setup for a RangeYesterday, while we were trading within the $78,000–$80,000 zone, no significant market buying appeared, so the price moved to test the local low. The $74,500 level wasn't swept, and we saw strong absorption of market selling, which led to a rebound.
Currently, price is caught between a volume zone and an area of buyer activity, and the signs suggest a developing sideways range.
In the coming days, we expect a full test of the local low. A false breakout of this level could offer interesting long opportunities, though we also can't rule out a full breakdown and a move toward the next buyer zone.
Sell Zones:
$78,000–$80,000 (volume zone)
$82,000–$83,900 (volume zone)
$85,600–$88,000 (absorption of buyer aggression)
$95,000–$96,700 (accumulated volumes)
$97,500–$98,400 (pushing volumes)
$107,000–$109,000 (volume anomalies)
Buy Zone:
$69,000–$60,600 (accumulated volumes)
Bitcoinidea

Bitcoin Formed a Double Bottom Bullish PatternFenzoFx—Bitcoin formed a double bottom bullish pattern. A consolidation phase toward $81,160 is imminent if the price holds above $74,475.
>>> Trade BTC/USD, swap free at FenzoFx Decentralized Forex Broker.

BTC/USDT Analysis – Expected ReboundWhile the entire market was panicking and selling off, our primary scenario was a rebound from the buyer zone at $77,000–$73,000, which has played out.
Yesterday, Bitcoin experienced an abnormal spike in volume. A breakout and consolidation either below or above the newly formed volume zone at $78,000–$80,000 will set the trend for the coming days.
Our main scenario suggests a move toward the sell zone above the current price. At the moment, we are seeing a slight absorption of market selling based on delta analysis.
In a bearish scenario, support is expected on a false breakout of the local low at $74,550.
Sell Zones:
$82,000–$83,900 (volume zone)
$85,600–$88,000 (absorption of buyer aggression)
$95,000–$96,700 (accumulated volumes)
$97,500–$98,400 (pushing volumes)
$107,000–$109,000 (volume anomalies)
Buy Zone:
$69,000–$60,600 (accumulated volumes)

Bearish Bitcoin Faces Key ResistanceFenzoFx—Bitcoin trades bearishly below the critical resistance level of $81,160. If the price remains below this level, the downtrend will likely resume, targeting $74,000.

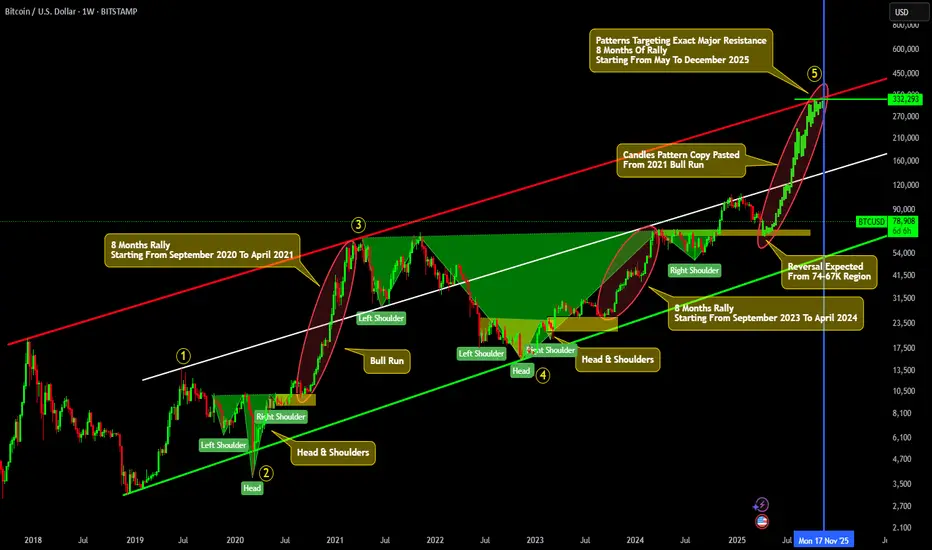
MAJOR BULL RUN RALLY INCOMING !!! Starting From MAY 2025 !!!On Big Picture starting from 2020....
Inverse H & S was formed... after breakout we got pull back & then it started 8 months rally from September 2020 To April 2021.
Then after deep bear market, we got Inverse H&S... after breakout, we got pull back & then it started 8 months rally from September 2023 To April 2024.
Now. we got big H&S... after breakout, we are getting pull back & now we are almost near at support level of H&S. From around 74-66K region, reversal bull run rally is expected which will most probably start from next month ( May 2025) and around after 8 months (October-December) we would be roaming ATH around 300K !!! which tags exactly at major resistance line. By copy pasting 2021 rally's candles pattern on current scenario, we can see exactly how things are going to shape in upcoming months.
Lets Hope For The Best !!!
Market overview
WHAT HAPPENED?
Last week, US President Donald Trump announced the amount of trade duties on imported goods. Bitcoin was restrained from falling in the $83,600–$82,500 zone, but the selling pressure turned out to be stronger, and we updated the local minimum.
At the moment, we’ve dropped to the buy zone of $77,000–$73,000 (volume anomalies pushing volumes). Volumes have been increased, and most liquidations are priced at $75,200.
WHAT WILL HAPPEN: OR NOT?
We expect a rebound from the current buyer's zone. The reversal formation hasn’t been formed yet, so long positions are only possible on the spot asset. For margin trading, it’s necessary to wait for additional confirmation.
A more negative scenario is a decrease to the next zone of accumulated volumes of $69,000-$60,600. The probability of such a decline without a proper rebound is very low.
Sell Zones:
$82,000–$83,900 (high-volume zone)
$85,600–$88,000 (absorption of buyer's market aggression)
$95,000–$96,700 (accumulated volumes)
$97,500–$98,400 (pushing volumes)
$107,000–$109,000 (volume anomalies)
Buy Zones:
$77,000–$73,000 (volume anomalies, pushing volumes)
$69,000–$60,600 (accumulated volumes)
IMPORTANT DATES
We’re following these macroeconomic developments:
• Wednesday, April 9, 2:00 (UTC) — announcement of the New Zealand interest rate decision;
Wednesday, April 9, 18:00 (UTC) — publication of FOMC minutes;
• Thursday, April 10, 12:30 (UTC) — publication of the basic US consumer price index for March, as well as in comparison with March 2024, and the number of initial applications for US unemployment benefits;
• Friday, April 11, 06:00 (UTC) — publication of UK GDP for February and German consumer price index for March;
• Friday, April 11, 12:30 (UTC) — publication of the US producer price index for March.
*This post is not a financial recommendation. Make decisions based on your own experience.
#analytics

Time Has Came For Bitcoin NOW!!!As Updated previously on Macro, We have reached at crucial zone. According to Elliott wave count on big picture, BTC formed ending diagonal and now approaching at it's reversal points. From this area of 75-69k region, there's high probability of trend reversal and we will soon see shorters getting rekt

Bitcoin Sell to 73/72k ?There is a potential incoming sell on the 4 hour time frame.
Take profit around : 73/72 k
Stop loss: 85.6k
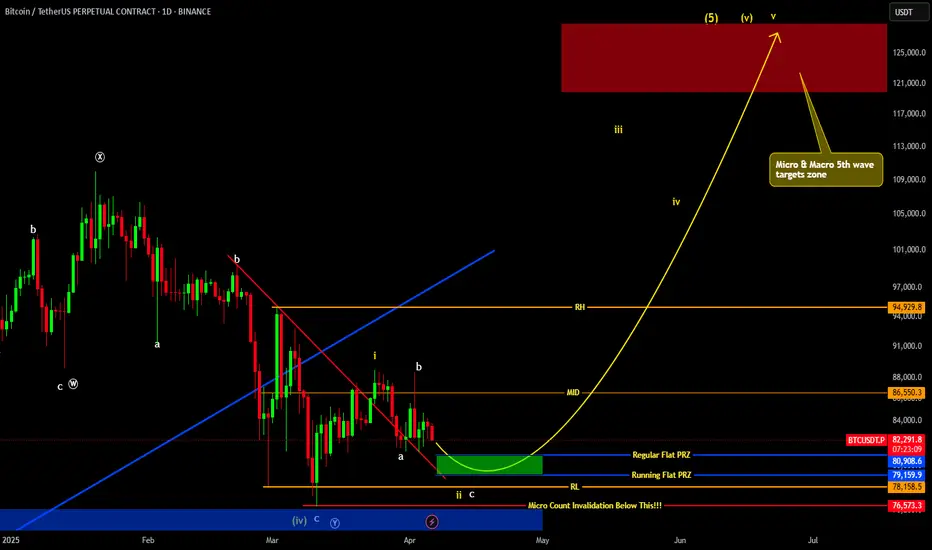
BITCOIN SEEMS TO FOLLOW THIS PATH TOWARDS 120k !!!According to elliott wave count, If BTC has completed it's macro wave (IV), then we can expect it moving to complete it's macro wave (V).
In this case if recently impulse move is counted as micro wave (i), then we can expect reversal from 81-79K region very soon.
Otherwise, if micro count gets Invalid, then reversal can be expected from up to 76-70k .
Important key level is breakout of 95k which would confirm reverse in trend.
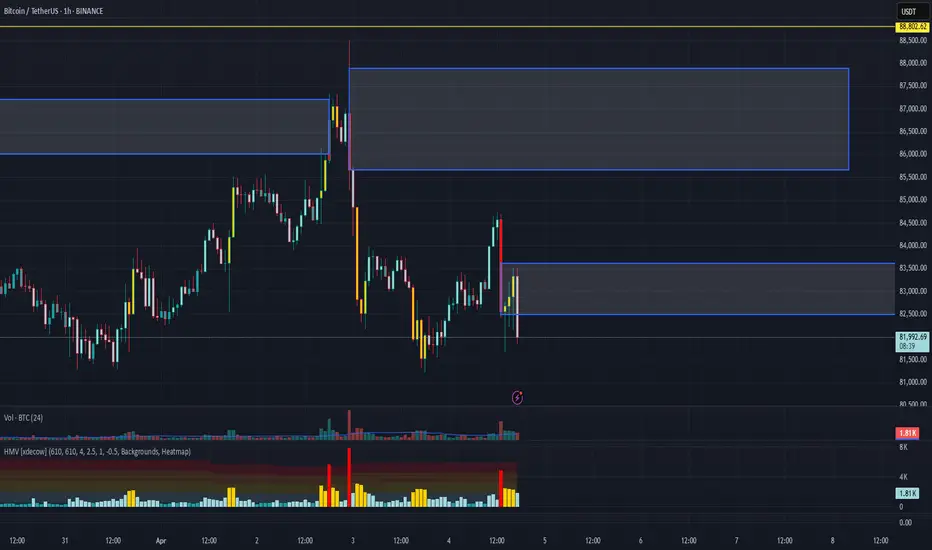
BTC/USDT Analysis: Local Growth or Continued Decline?Yesterday, Bitcoin continued its decline from the previously mentioned volume zone, but there was no confirmed breakdown below it or a breach of the local low.
At the moment, a trend reversal to the upside has formed.
Currently, the zone of accumulated volume has shifted and is now located in the $83,600–$82,500 range.
A breakout above or below this zone will define the local trend for the coming days.
Our primary scenario considers an upward move toward the $85,600–$88,000 sell zone (absorption of buyer aggression), from where we expect selling pressure to resume.
Sell Zones:
$85,600–$88,000 (absorption of buyer aggression)
$95,000–$96,700 (accumulated volumes)
$97,500–$98,400 (pushing volumes)
$107,000–$109,000 (volume anomalies)
Buy Zones:
$77,000–$73,000 (volume anomalies, pushing volumes)
Bitcoin Technical AnalysisFenzoFx—BTC/USD trend outlook is bearish below $88,650.
A break below the immediate support of $81,160 can trigger a new bearish wave, targeting the next support area at $77,850.

Navigating BTC Volatility Storm: Buy, Hold, or Flee?Bitcoin's recent price action has been reminiscent of a rollercoaster, leaving investors grappling with a whirlwind of conflicting signals. From sharp drops mirroring stock market turmoil to the looming "death cross," the cryptocurrency's trajectory is shrouded in uncertainty. Is this a prime buying opportunity, a warning to retreat, or simply another bout of the volatility that defines Bitcoin?
The past few days have been a stark reminder of Bitcoin's inherent volatility. Reports of an 8% drop, coupled with the US stock market shedding $2 trillion in value, sent ripples through the crypto sphere. The catalyst? Concerns surrounding potential US tariffs and their impact on the global economic outlook. This sudden shift in market sentiment triggered a sell-off, reminiscent of the COVID-19 crash in 2020, during which Bitcoin’s pre-pandemic gains evaporated.
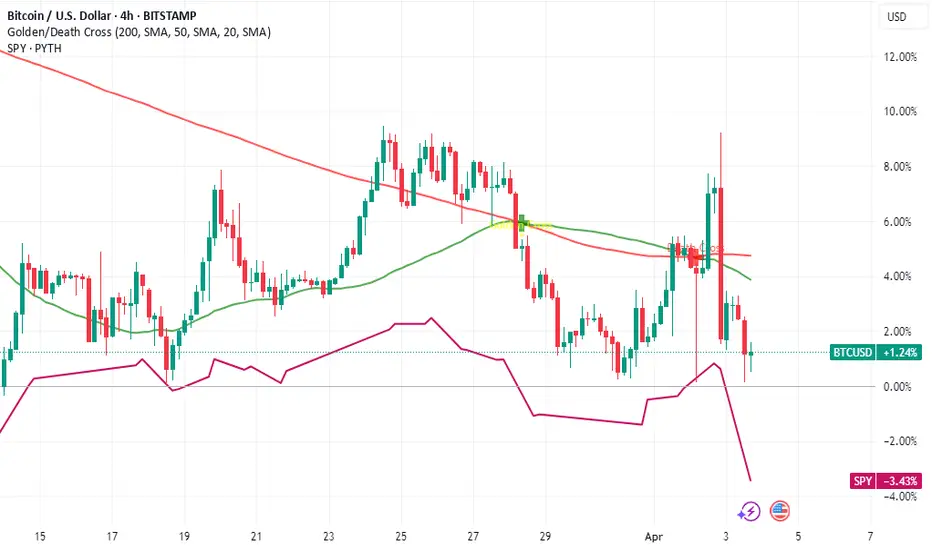
Adding to the unease is the looming "death cross," a technical indicator that occurs when the 50-day moving average crosses below the 200-day moving average. Historically, this pattern has signaled bearish momentum. The 2022 death cross, for example, precipitated a significant price drop of nearly 20%. Conversely, "golden crosses," where the 50-day moving average crosses above the 200-day moving average, have historically signaled bullish momentum, triggering rallies of over 500% in 2020 and 2021.
Currently, Bitcoin's 50-day moving average is edging closer to this critical crossover, prompting widespread speculation. Is this a repeat of 2022, or will the market defy historical patterns? The answer, as always, is complex and contingent on a confluence of factors.
One significant factor is the strength of the US dollar. While the dollar's strength can often negatively impact Bitcoin, the current increase in the money supply could potentially counteract this effect, creating a bullish flag pattern. The dollar's inflation may become a catalyst for Bitcoin as a store of value. The global market dynamics are currently shrouded in uncertainty, making it difficult to predict the long-term impact of these factors.
The recent price drops have pushed Bitcoin towards the $80,000 mark, with some analysts predicting a potential fall to $71,000. However, this level could also represent a "sizeable bounce," acting as a strong support zone for Bitcoin. The concept of an "oversold bounce" also comes into play. After a period of intense selling pressure, markets often experience a relief rally as traders capitalize on discounted prices. Whether this materializes remains to be seen.
Is it a Good Time to Buy Bitcoin?
The decision to buy, hold, or sell Bitcoin depends on an individual's risk tolerance, investment strategy, and understanding of the market. Here's a breakdown to consider:
• For the Long-Term Investor:
o Bitcoin's long-term potential remains a compelling narrative. Its decentralized nature, limited supply, and growing adoption continue to attract institutional and retail investors.
o Price volatility is an inherent part of the Bitcoin journey. Historically, periods of sharp declines have been followed by significant rallies.
o Dollar-cost averaging (DCA) can mitigate the impact of volatility by investing a fixed amount at regular intervals, regardless of the price.1
o The strength of the US dollar may become a catalyst for Bitcoin as a store of value.
• For the Short-Term Trader:
o The current volatility presents opportunities for skilled traders to profit from price swings.
o Technical analysis, including monitoring moving averages and support/resistance levels, is crucial for identifying potential entry and exit points.
o However, short-term trading is inherently risky and requires a deep understanding of market dynamics.
o The "death cross" should be monitored carefully.
• For the Cautious Investor:
o The current market uncertainty may warrant a more conservative approach.
o Diversifying investments across different asset classes can help mitigate risk.
o Staying informed about market developments and avoiding emotional trading decisions is essential.
The Death Cross: A Warning or a False Alarm?
The "death cross" is a significant technical indicator, but it's not a foolproof predictor of future price action. Historical data show that while it can signal bearish trends, it's not always accurate. Market conditions, investor sentiment, and macroeconomic factors can all influence Bitcoin's trajectory.
Ultimately, the Bitcoin market remains highly speculative. The current volatility, driven by a confluence of factors, underscores the importance of careful research, risk management, and a long-term perspective. While the "death cross" and market fluctuations may cause short-term panic, the long-term potential of bitcoin, and it's reaction to the weakening dollar, may still produce long-term gains.
BTC/USDT Analysis: Local EuphoriaYesterday, right after the release of our analysis, Bitcoin absorbed the entire breakout of the trendline with buyer aggression.
At the moment, we have reached the sell zone at $86,000–$87,200 (absorption of buyer aggression) and have already observed an abnormal spike in volume.
The main expectation is a decline, at least to the new local buyer zone at $83,800–$82,800.
On a broader scale, we could still see a drop down to the $76,700 low.
Sell Zones:
$86,000–$87,200 (absorption of buyer aggression)
$95,000–$96,700 (accumulated volumes)
$97,500–$98,400 (pushing volumes)
$107,000–$109,000 (volume anomalies)
Buy Zones:
$83,800–$82,800 (local volume zone)
$77,000–$73,000 (volume anomalies, pushing volumes)
BITCOIN Update: What We Can Expect Next???According to current price action we can expect 3 scenarios:
Scenario 1: BTC is currently at it mid range resistance. If it breaks above this resistance then we may probably see price approaching range high and even beyond.
Scenario 2: If it fails to break and rejects, then most probably we can expect reversal from range low demand zone, which aligns with cypher harmonic pattern's PRZ.
Scenario 3: In worst case, we may see BTC dumping upto 74-70K region, and from there we will most probably see trend reversal.
Most crucial level to watch in all scenarios is 95k region, if it breaks successfully above it, then we will see BTC slamming new ATH.

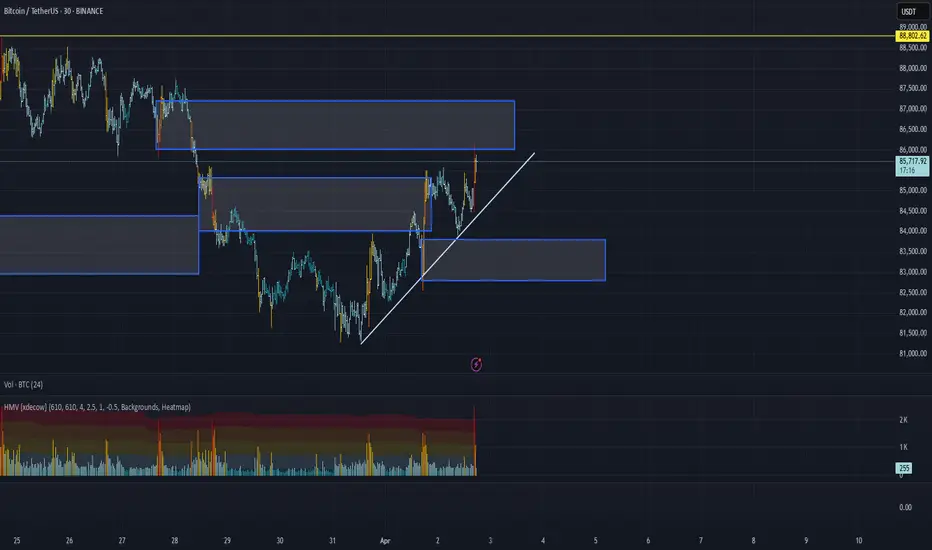
BTC/USDT Analysis. Watching for Further DeclineYesterday, Bitcoin experienced a local rebound, reaching the sell zone.
Our weekly scenario remains unchanged—we still expect further downside movement. Several factors support this view: the reaction in the sell zone and weak price action during the upward move (each high is struggling to break through).
All zones remain active. We are monitoring the break of the trendline, and on a pullback, we will look for short entries.
Sell Zones:
$84,000-$85,300 (pushing volumes)
$86,000-$87,200 (absorption of buyer's market aggression)
$95,000-$96,700 (accumulated volumes)
$97,500-$98,400 (pushing volumes)
$107,000–$109,000 (volume anomalies)
Buy Zone:
$77,000-$73,000 (volume anomalies, pushing volumes)

Bitcoin's Rocky Quarter: Tariffs, Whales, and Volatility Loom
Bitcoin's first quarter of 2025 has concluded with a whimper, marking its worst Q1 performance since the tumultuous bear market of 2018.1 While gold has surged to record highs, fueled by geopolitical tensions and US trade tariffs, Bitcoin has struggled to maintain momentum, leaving traders bracing for potential further volatility. This week’s preview reveals a confluence of factors that could significantly impact Bitcoin's price trajectory.
A Disappointing First Quarter
The initial months of 2025 were anticipated to be a period of growth for Bitcoin, particularly with the anticipation surrounding the halving event. However, the cryptocurrency failed to deliver on these expectations. Instead, it experienced a period of stagnation and even decline, contrasting sharply with the robust performance of traditional safe-haven assets like gold.
Several factors contributed to this underwhelming performance. The escalating trade tensions, particularly the US tariffs, have injected uncertainty into global markets, diverting capital towards established safe-haven assets.
Tariffs and Trade Tensions: A Persistent Headwind
The US imposition of trade tariffs has emerged as a significant headwind for Bitcoin. These tariffs, designed to protect domestic industries, have disrupted global trade flows and created a climate of economic uncertainty.2 Investors, wary of potential market disruptions, have sought refuge in traditional safe-haven assets like gold, which has historically outperformed during periods of economic instability.
The impact of these tariffs extends beyond immediate market reactions. They signal a potential shift towards protectionist policies, which could have long-term implications for global trade and investment flows. Bitcoin, often touted as a decentralized and borderless asset, is particularly vulnerable to disruptions in global trade and capital flows.
Whale Activity and Market Manipulation
Adding to the complexity of the market is the activity of large Bitcoin holders, often referred to as "whales."3 These entities, possessing significant amounts of Bitcoin, can exert considerable influence on market prices through large buy or sell orders. Recent observations suggest increased whale activity, potentially contributing to the volatility and price fluctuations.
Concerns about market manipulation have also resurfaced. The decentralized nature of Bitcoin, while a core strength, also presents challenges in terms of regulation and oversight. This lack of centralized control can create opportunities for manipulation, leading to price swings that are not necessarily reflective of fundamental market dynamics.
Bitcoin Bears Tighten Grip: Where’s the Next Support?
The recent price action indicates that Bitcoin bears are tightening their grip. The failure to sustain upward momentum has emboldened sellers, leading to a downward trend. Traders are now closely monitoring key support levels, anticipating potential further declines.
Identifying these support levels is crucial for understanding the potential trajectory of Bitcoin's price. Technical analysis, using tools like Fibonacci retracement levels and moving averages, can help traders identify potential areas of support where buying pressure may emerge. However, the volatile nature of Bitcoin makes it challenging to predict these levels with certainty.
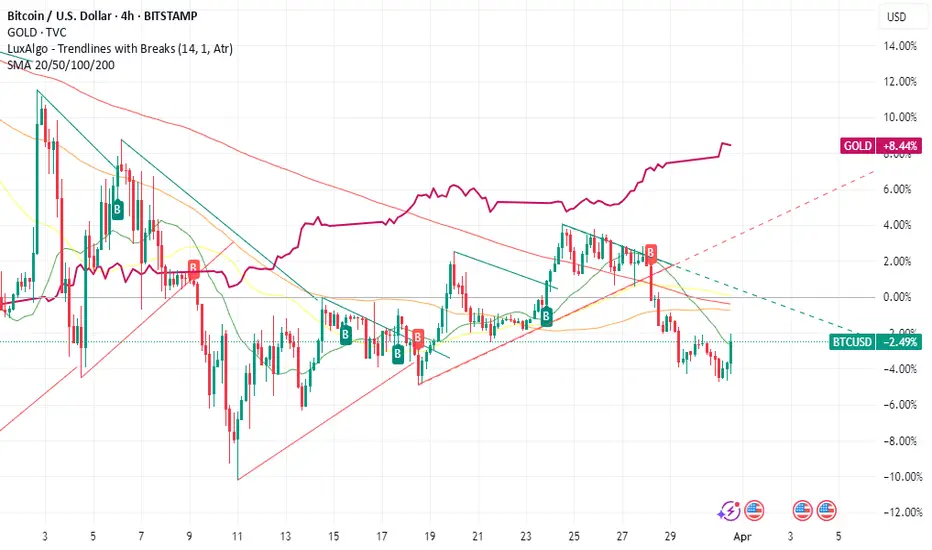
Gold vs. Bitcoin: A Comparative Analysis
The stark contrast between gold's recent performance and Bitcoin's struggles has reignited the debate about their respective roles as safe-haven assets. Gold, with its long history and established reputation, has benefited from the current climate of uncertainty.
However, Bitcoin proponents argue that its decentralized nature and limited supply make it a superior store of value in the long term. The comparison between the two assets highlights the evolving nature of safe-haven assets and the growing acceptance of digital currencies. The quote "Gold has taken 26 years to 10X. Bitcoin has taken 4 years to 10X" shows the potential for rapid growth, but also its volatility.
Looking Ahead: Volatility and Uncertainty
The coming week promises to be a period of significant volatility for Bitcoin. Traders should brace for potential price swings, driven by a combination of factors, including:
• Continued Trade Tensions: The ongoing trade disputes and potential for further tariffs are likely to continue to impact market sentiment.
• Whale Activity: Large buy or sell orders from whales could trigger significant price fluctuations.
• Regulatory Developments: Any regulatory announcements or policy changes could have a substantial impact on Bitcoin's price.
• Macroeconomic Factors: Inflation data, interest rate decisions, and other macroeconomic indicators will continue to influence investor behavior.
•
In conclusion, Bitcoin's disappointing first quarter has set the stage for a period of heightened volatility. The confluence of trade tensions, whale activity, and market manipulation creates a challenging environment for traders. While the long-term potential of Bitcoin remains a subject of debate, the immediate future is marked by uncertainty and the need for caution.
Market overview
WHAT HAPPENED?
Last week, we were unable to update the local high of $88,800, after which we broke the uptrend and went down.
As we mentioned earlier in the daily analysis on TradingView, of the support zones at the moment, only the accumulated volume zone of $84,400-$82,900 and technical levels can be noted. Therefore, the main priority for this week is to reduce to a minimum of $76,700.
WHAT WILL HAPPEN: OR NOT?
The only buyer's zone couldn't resist. The seller's pushing volumes appeared just above it, which will now act as a resistance zone when the price returns.
Long is contraindicated. Consider buys only when approaching the local minimum and testing the buyer's zone of $77,000-$73,000, or with abnormal market activity and a breakdown of the maximum of $88,800.
Sell Zones:
$84,000–$85,300 (pushing volumes)
$86,000–$87,200 (absorption of buyer's market aggression)
$95,000–$96,700 (accumulated volumes)
$97,500–$98,400 (pushing volumes)
$107,000–$109,000 (volume anomalies)
Buy Zone:
$77,000–$73,000 (volume anomalies, pushing volumes)
IMPORTANT DATES
This week we’re following these macroeconomic events:
• Monday, March 31, 12:00 (UTC) — publication of the German consumer price index;
• Tuesday, April 1, 03:30 (UTC) — announcement of the Australian interest rate decision;
• Tuesday, April 1, 09:00 (UTC) — publication of the consumer price index in the Eurozone compared to March 2024;
• Tuesday, April 1, 13:45 (UTC) — publication of the index of business activity in the US manufacturing sector for March;
• Tuesday, April 1, 14:00 (UTC) — publication of the number of open vacancies in the US labor market for February;
• Wednesday, April 2, 12:15 (UTC) — publication of changes in the number of people employed in the US non-agricultural sector in March;
• Thursday, April 3, 12:30 (UTC) — publication of the number of initial applications for US unemployment benefits;
• Thursday, April 3, 13:45 (UTC) — publication of the index of business activity in the US services sector for March;
• Thursday, April 3, 14:00 (UTC) — publication of the US non-manufacturing Purchasing Managers' Index for March;
• Friday, April 4, 12:30 (UTC) — publication of the average hourly wage, changes in the number of people employed in the non-agricultural sector and the unemployment rate in the United States for March;
• Friday, April 4, 15:25 (UTC) — speech by Fed Chairman Jerome Powell.
*This post is not a financial recommendation. Make decisions based on your own experience.
#analytics

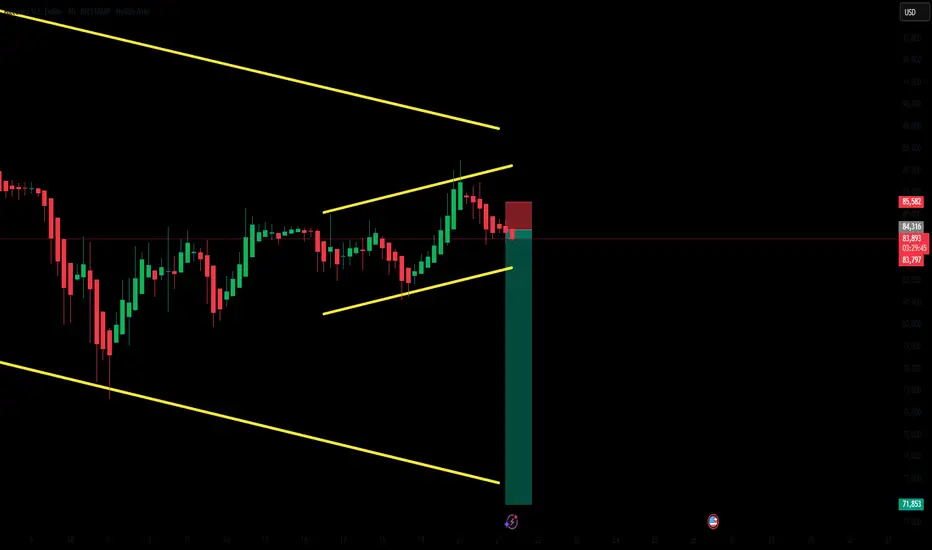
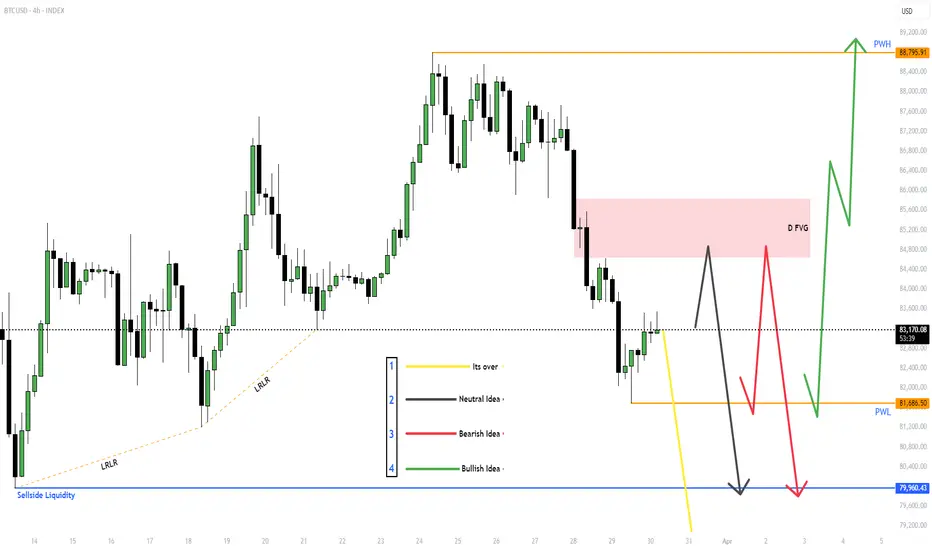
$BTC for Next week (31st March - 4th April)Given out all the ideas, Will react to the market based on which idea presents itself.
If Yellow line - Its better to stay out of the markets.
With the other wait for MSS (Market Structure Shift) and then take the trade and target the other side of the liquidity.
BITSTAMP:BTCUSD , BINANCE:BTCUSDT.P BINANCE:BTCUSDT
Overall I'm neutral on CRYPTOCAP:BTC but SEED_ALEXDRAYM_SHORTINTEREST2:NQ and NYSE:ES look bearish to me, and CRYPTOCAP:BTC could follow.
Bitcoin Part2: Bullish Trade longBad economy,global inflation,recessive U.S. economy,hypes,uncertainly, the white house policy.
All these facts matter:They put the markets under massive pressure
Where is the chance: To plan different scenarios and models that have benn working in such similar scenarios. 202 is a good example, as the markets suddenly experienced big pressure.
Last not least, the FED transistory inflation, that wasnt real inflation, now indeed is becoming a dangerouse reality: We will have higher inflation, and global risks increasing.This will impact global liquidity inflow into markets.
Additionally we are noticing an outflow of the US stock markest, and increasing inflow of capital in foreign countries stock markets.
This are not good news for Bitcoin nor for crypto at all.
The chane in my opinion is just to think reverse.like 2020
Sell when positive news from the Whitehouse andpositive tone from FED.
Buy when White house talking and announcing threadful tariffs and if FED talks negatively.
Why?Because we have indieed real thread of inflation, and FED is the more competent team, who really now does everything to tame the inflation.Therefor i beleive them more.
Also short term contarian trade is just planned for max 24-48 hours. not longer
As the volatility rises.
Helding positions for more periode of time means increasing the risk.Upwards and downwards.
Bitcoin Part1: bearish Trade Short termBitcoin Macro Index' bear signal puts $110K BTC price return in doubt
Fact is: Bitcoin and ether drop amid grim inflation outlook, tariff uncertainty midterm to long term, as long the white house continues its policy.And PRES: trump cannot prevent it.
A positive change of the white house policy, and improving its relationshipsto other nations,instead putting them with tariffs, will be a boosting positive cataylst also for crypto,specially Bitcoin. Bitcoin has lost in trust of new investors ,specially since 21st of January 2025.
Also participating of Pres. trump in crypto summits had no positive significant signals ,specilly not for Bitcoin.Instead Bitcoin lost now more than 34% since Nov. 2025.
Also many crypto fans are very disappointed about developement of their crypto performances.
Promise gave,Promise ,,NOT,,kept!
It wIll be a very volatile time ahead.
Therefor I prepare for both scenarios:Bullish/Bearish short term.
This is part 1:bEARISH STRATEGY:
Below 78k...bearish momentum will gain more on momentum.
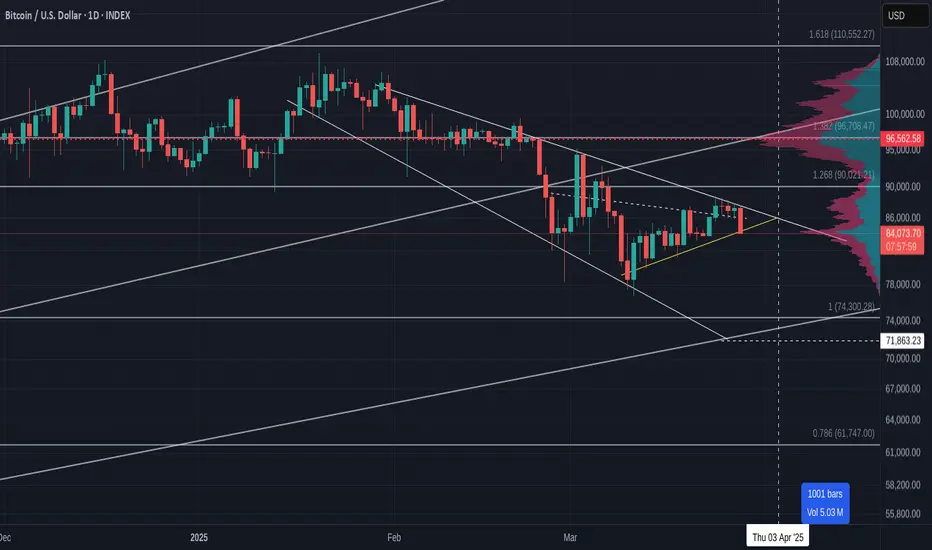
Bitcoin Squeeze Point – Breakout or Breakdown?Bitcoin is approaching a key inflection zone where the Daily Downtrend Resistance and the Monthly Uptrend Support intersect. This confluence could be setting the stage for a major breakout or breakdown, and the next move could define BTC’s medium-term trend.
🧠 Key Levels to Watch:
Daily Downtrend Resistance (Red) – Price is testing this descending trendline again.
Monthly Uptrend Support (Green) – Strong support held since August 2024.
Fibonacci 0.5 Level (~79.3K) – Acting as mid-zone control point.
Fibonacci 0.618 Golden Zone (~72K) – Strong historical retracement support.
🟦 Bullish Scenario (Blue Arrow):
If BTC breaks above the daily downtrend and holds above the green uptrend line:
Possible target: 110K, aligning with the 1.0 Fibonacci extension.
Would confirm continuation of the larger bullish trend.
🔻 Bearish Scenario (Not drawn but implied):
If BTC breaks down below 79K and the monthly trendline:
Eyes on 72K for a potential bounce at the 0.618 Fib level.
Below that, potential deeper retracement toward the 65K–60K zone.
⏳ Conclusion:
BTC is sitting at a high-confluence zone. This is not the time to chase—wait for confirmation of breakout or breakdown before reacting.

BTC 2 week planthe explanation is in the video
overall bearish for next 2 weeks Dailly is on a downtrend that will not end until 70ks maybe 78 or 76 0r 72 but we do have more downside coming
short-term 24 to 48 hrs. bullish bounce coming immediately

Bitcoin Daily UPDATE - something for the weekend sir ?Chances are we will see PA Drop over the weekend if what has happened today is anything to go by
As mentioned in apost this morning, Pa fgot rejected off the upper trend line of the descending channel and currently Sits on the POC ( point of control ) on the VRVP ( Vivible Range Volume Profile )
The Drop if we loose this support could be swift but we do have support lines below to try and hold up the fall
But again, as mentioned, a drop is NOT such a bad thing....unless we loose 73K, in which case I will seriously think again about what I Hold.
The 4 hour chart shows the current situation more clearly
If we do bounce of this, remain cautious....we need to get over and Hold 91K before we start screaming "ATH"
For me, I have opened anotehr Spot order at 74K
I go higher than the expected Low incase the visit to the low is a Very quick wick down and the order does not have time to fill.
DO NOT PANIC
Have a good Weekend