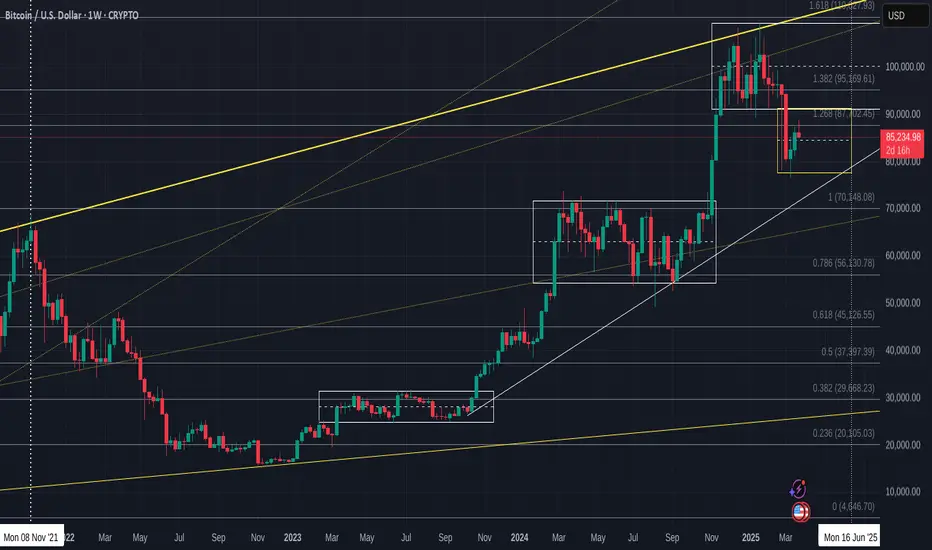
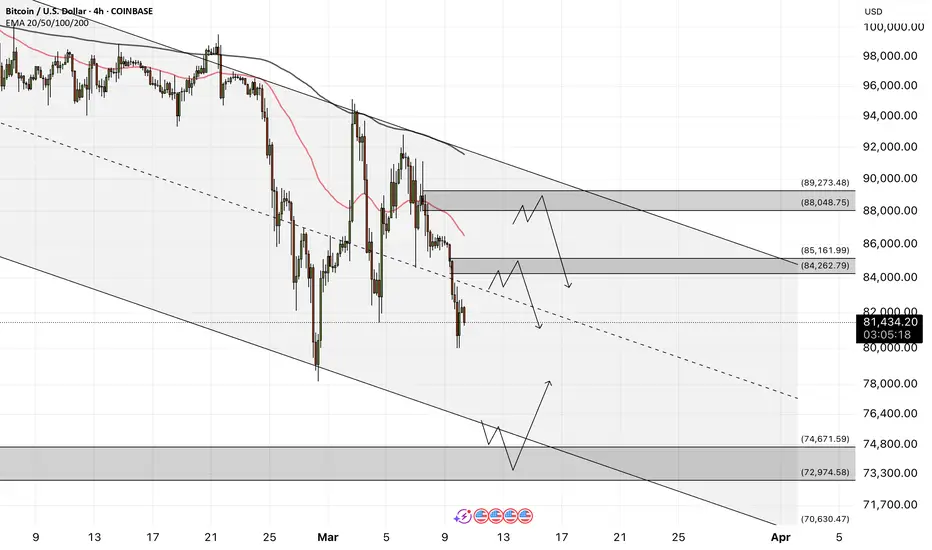
Bitcoin -potential to 91K, back to 78K wick to 73K and THEN -->>In this cycle, since the push up from the Low in Jan 2023, we have had 2 other Major pushes.
Each of these came off the Rising line of support that we are currently heading towards again, with the date of "Touch" currently in Mid June.
If we rise and stay back in the higher Range Box, that date is even later in the year ( around Mid Q4 )
As I have talked about many times, I am watching the MACD as the "trigger".
The chart below is the Weekly MACD
We reach Neutral , if we continue current rate of descent, around end of April
This is obviously before we would hit the line of support being talked about above.
That leaves 2 possibilities.
1) - MACD may drop below Neutral
2) - We may see a bounce from PA but NOT to a New ATH
If you look back at previous range we had in 2024, there was a bounce there.
See how the Histogram went White as we had that bounce
We Just had a white bar on the histogram .
Will we see another White bar next week and a further rise in PA
Top of current Range box in 91K - We could head to that again, Drop back to the Low around 78K and then we would be ready. This would be over the next 3 - 6 weeks
78K is the Price that touches that line of support the soonest, in early June
Why could we go back down?
For the reasons above regarding the MACD BUT ALSO ;-
There are things called FAIR VALUE GAPS (FVG)
. These gaps highlight market inefficiencies and potential trading opportunities, allowing traders to anticipate price movements and confirm trends.
That area just below Current PA on this weekly chart is the FVG that goes down to 73K
It is NOT guaranteed that PA will revisit that area but while we sit so close, the potential exists
But something to note, that could be benifical is that Should PA Drop to Fill that Gap, PA could hit that line of support earlier than Mid June..infact, it would be a month earlier and be in Mid May.
So, I can see the potential for a push higher in the near future, to extend MACD, then a drop back to the range Lows, a Sharp wick down to around 73K and THEN a sustained push higher...
This is just an idea.....No guarantees...But it does have Potential
We will see - Time will tell...........
Bitcoinidea
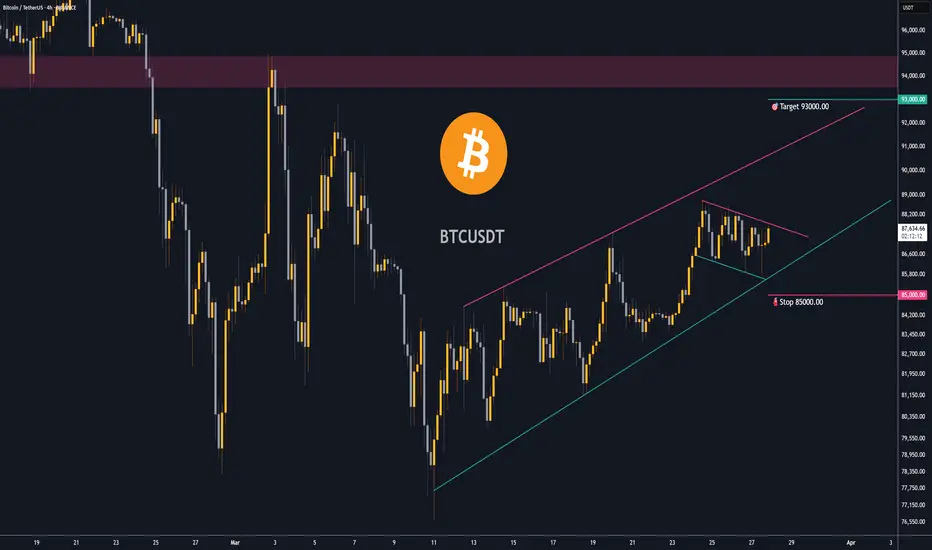
Trading opportunity for Bitcoin BTCUSDT Based on technical factors there is a Buy position in :
📊 BTCUSDT
🔵 Buy Now
🪫Stop loss 85000.00
🔋Target 93000.00
📏 R/R 2,1
💸RISK : 1%
We hope it is profitable for you ❤️
Please support our activity with your likes👍 and comments📝
Crypto liquidations drop 76% as Bitcoin $BTC stabilizes aboveCrypto liquidations plummeted by 76% in the second half of March as Bitcoin BTC CRYPTOCAP:BTC consolidated around $87,000 after earlier volatility. From March 12 to March 25, Bitcoin's price moved within a narrower range, starting at $82,857 and closing at $87,330.
Earlier in March, Bitcoin BTC CRYPTOCAP:BTC saw sharp price movements, dropping below $79,000 before rebounding, coinciding with a spike in long liquidations. The recent decline in liquidations signals more stable market participation and reduced leverage risk.
Between March 12 and March 25, long liquidations totaled $1.26 billion, while short liquidations reached $1.14 billion, down from 7$7.2 billion in long and $2.8 billion in short liquidations from February 24 to March 12.

BTC IMF Tracking, Liquidation Frenzy, and Market PredictionsBitcoin's recent price action has been a rollercoaster, marked by significant gains, dramatic liquidations, and a confluence of macroeconomic factors that are shaping its trajectory. From the International Monetary Fund (IMF) officially tracking Bitcoin in cross-border finance to speculative predictions of a potential $87,000 surge, the cryptocurrency remains a focal point of intense market scrutiny.
One of the most noteworthy developments is the IMF's increasing recognition of Bitcoin's role in global finance. While the IMF previously issued warnings to El Salvador regarding its Bitcoin adoption, its decision to now track Bitcoin in cross-border financial flows signals a tacit acknowledgment of the cryptocurrency's growing significance. This shift reflects a broader trend of institutions grappling with the reality of digital assets, forcing them to incorporate these assets into their analytical frameworks.
Simultaneously, the Bitcoin market has witnessed a surge towards the $87,000 mark, triggering a wave of short liquidations. This phenomenon occurs when traders who have bet against Bitcoin's price are forced to close their positions at a loss as the price rises. The sheer magnitude of these liquidations, exceeding $110 million in a short period, underscores the volatility and the inherent risks associated with leveraged trading in the cryptocurrency market. The total market liquidations surpassing $200,000 in 24 hours only highlights the dramatic price swings and the vulnerability of short positions.
Adding to the complexity of the market dynamics is the emergence of another CME gap in the $84,000–$85,000 range. Historically, these gaps, which represent discrepancies between trading prices on the Chicago Mercantile Exchange (CME) and other exchanges, tend to be filled, suggesting a potential pullback in Bitcoin's price. This pattern creates a sense of uncertainty, with traders weighing the potential for further gains against the possibility of a corrective downturn.
Furthermore, the surge in Bitcoin open future bets on Binance, with an increase of $600 million, indicates heightened price volatility. Open interest, which measures the total number of outstanding futures contracts, often correlates with price movements. A rise in open interest alongside a price increase typically confirms an uptrend, but it also signals the potential for sharp price swings as more capital enters the market.
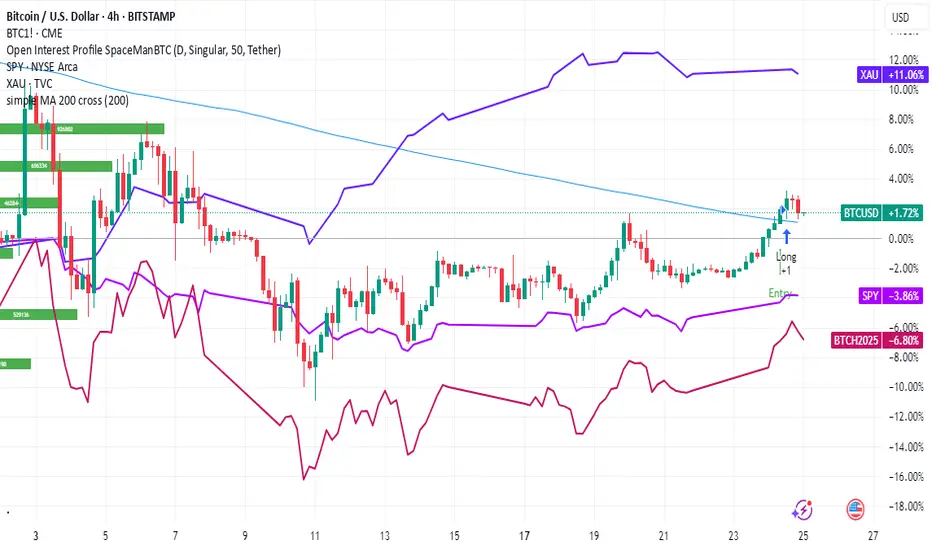
Market analysts are divided on Bitcoin's future trajectory. Some predict a "brutal bleed lower," while others foresee a break towards new all-time highs in the second quarter. The critical level to watch is $93,000. If Bitcoin can reclaim this level as support, it would significantly reduce the risk of a fresh collapse. However, until this threshold is breached, the market remains vulnerable to downward pressure.
On a more positive note, the S&P 500's reclamation of its 200-day moving average provides a potential tailwind for Bitcoin. This technical breakout in equities, coupled with similar signals in the cryptocurrency market, could indicate renewed bullish momentum. The correlation between traditional financial markets and Bitcoin has become increasingly apparent, with positive developments in equities often translating to positive sentiment in the crypto space.
Adding another layer to the narrative is the potential softening of the stance on reciprocal tariffs by Donald Trump. Some analysts see this development as a potential catalyst for a Bitcoin bottom. Any relaxation of trade tensions could boost investor confidence and create a more favorable environment for risk assets, including cryptocurrencies.
Finally, the concept of tokenized US gold reserves, as proposed by NYDIG, presents an intriguing long-term prospect for Bitcoin. While gold and Bitcoin are fundamentally different assets, the tokenization of gold on a blockchain could enhance the overall legitimacy and infrastructure of digital assets. This increased institutional acceptance could indirectly benefit Bitcoin by further integrating blockchain technology into mainstream finance.
In conclusion, Bitcoin's current market landscape is characterized by a blend of institutional recognition, intense trading activity, and speculative predictions. The IMF's tracking of Bitcoin in cross-border finance underscores its growing relevance, while the liquidation frenzy and CME gap highlight the inherent volatility of the cryptocurrency market. The interplay of macroeconomic factors, technical indicators, and speculative sentiment will continue to shape Bitcoin's trajectory, making it a fascinating asset to watch in the coming months.
BTC - Potential short continuationThere is possibilities for a short continuation of BTC.
We are on support area .. if the BTC Break this area we can go directly to second support area

BTC/USDT (Bitcoin) LONG SET UPEntry Price 1: $84,000
Entry Price 2: $83,500
Stop Loss: $82,000
Take Profit 1: $86,000 (Close 25%)
Take Profit 2: $88,000 (Close 50%)
Take Profit 3: $90,000 (Close 75%)
Take Profit 4: $92,000 (Close 100%)
Status: ACTIVE
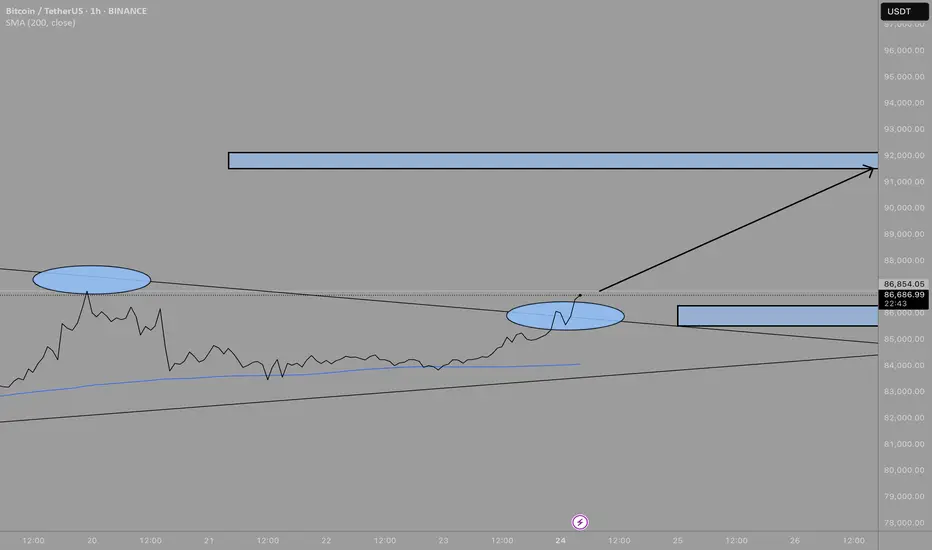
BTC/USDTBreakout may retest, waiting for a retest better. For target to reach, price action must remain above trend line and above breakout lvl > 85.6k
🎯 --> 91.5k
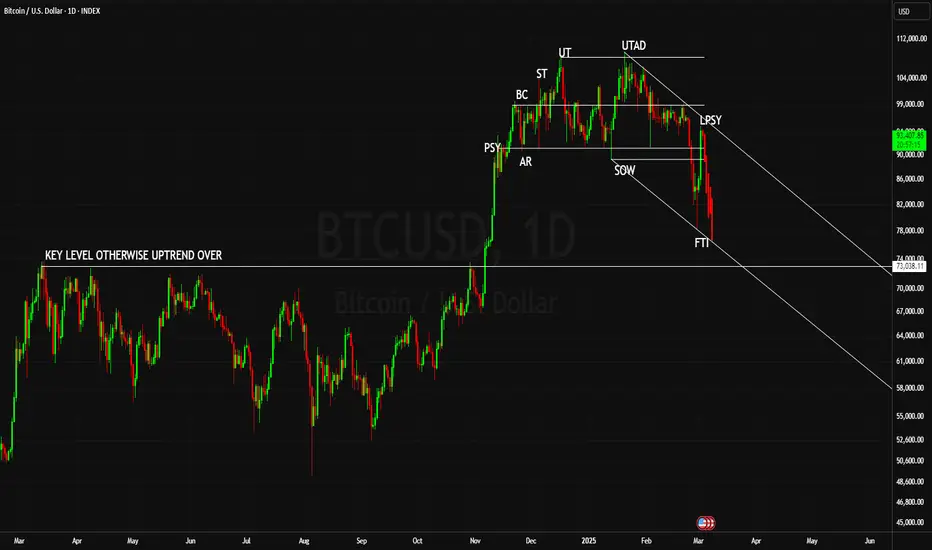
BITCOIN BASED ON WYCKOFF THEORY 73K PROGRAMMED FOR NEXT LEG DOWNBased on analysis from multiple perspectives, not just Wyckoff theory, the chart strongly suggests that this is merely a pullback before continuing downward.
Global Tensions, Market Manipulation, and BTC Uncertainty The cryptocurrency market, a realm notorious for its volatility, is currently grappling with a confluence of factors that are forcing investors to reassess their strategies. Global trade tensions, macroeconomic uncertainties, and the intricate dance of market manipulation are all contributing to a complex and unpredictable landscape. Specifically, Bitcoin, the flagship cryptocurrency, is experiencing a period of intense scrutiny, with analysts offering a range of perspectives on its potential future.
A recurring theme in recent analyses is the notion of "whale manipulation." Reports suggest that large holders, or "whales," are engaging in strategic trades on exchanges like Binance to influence Bitcoin's price. This "liquidity massaging" is seen as a deliberate attempt to create artificial price ceilings, with some analysts predicting that Bitcoin's upward momentum could be capped below $90,000, and more conservatively, $87.5K. Such manipulations introduce uncertainty, making it difficult to discern genuine market sentiment from artificially inflated or deflated prices.
Adding to the complexity is the debate surrounding retail investor participation. Contrary to the prevailing narrative of retail investors being absent, some crypto executives argue that they are already actively involved. This perspective challenges the notion that a surge in retail interest is needed to propel Bitcoin to new heights. If retail participation is already significant, the anticipated catalyst for a bull run may have already materialized, leaving investors to wonder what new catalyst is needed for further price appreciation.
Data from Bitcoin's Realized Cap and UTXO (Unspent Transaction Output) analysis is also signaling a "major shift." These metrics, which offer insights into the actual value stored within the Bitcoin network and the movement of coins, are crucial for understanding the underlying health of the market. Changes in these indicators can foreshadow significant price movements and shifts in investor behavior. Traders are closely monitoring these metrics for clues about Bitcoin's future direction.
However, despite recent attempts to pare losses, Bitcoin is struggling to maintain a consistent uptrend. This instability has led some traders to adopt a bearish stance, with predictions of a potential drop to as low as $65,000. These bearish sentiments are fueled by the inability of Bitcoin to decisively break through resistance levels and the persistent volatility that characterizes the current market.
Conversely, some analysts are finding bullish signals by examining indicators that also correlate with the Nasdaq. The correlation between traditional financial markets and the cryptocurrency space has become increasingly evident, and analyzing these relationships can provide valuable insights. If the Nasdaq shows signs of strength, it could potentially buoy Bitcoin's price. However, this correlation is not always consistent, and the inherent volatility of both markets can lead to unpredictable outcomes.
The performance of U.S. spot Bitcoin ETFs is another critical factor influencing market dynamics. The collapse of the "cash-and-carry" trade, a popular arbitrage strategy, has had significant implications for investors. The stagnation of inflows into these ETFs, compared to the initial surge earlier in 2024, has raised concerns about the sustainability of institutional interest. While there have been recent reports of net inflows returning, questions remain if this is a temporary blip, or a sustained uptrend. This fluctuation in ETF inflow signals a wavering confidence from institutional players.
The combination of these factors creates a challenging environment for investors. Global trade tensions, which can disrupt economic stability and investor sentiment, add another layer of uncertainty. Fluctuations in traditional markets, geopolitical events, and regulatory developments can all have a ripple effect on the cryptocurrency market.
In this tumultuous landscape, investors are advised to exercise caution and adopt a diversified approach. Relying solely on technical analysis or market sentiment can be risky. Instead, a comprehensive strategy that incorporates fundamental analysis, risk management, and a deep understanding of market dynamics is essential.
The current situation highlights the inherent volatility and complexity of the cryptocurrency market. While Bitcoin remains a dominant force, its future trajectory is far from certain. The interplay of whale manipulation, retail participation, technical indicators, and macroeconomic factors creates a dynamic and unpredictable environment. Investors must remain vigilant, adapt to changing conditions, and prioritize risk management to navigate this challenging terrain successfully.

BTC Showdown: Smash 84,700 for a Rocket Ride to 93KMorning, trading peeps! BTC’s at a crossroads – if we punch through 84,700, we’re looking at a sweet climb to 88K or even 93K. But if we slip below 83,500 and close there, brace yourselves for a dip to 76,300 or lower. Let’s see where this ride takes us today!
Kris/Mindbloome Exchange
Trade Smarter Live Better
BTC Whales Stir, Trump's Crypto Push, and the Path to $85,000
Bitcoin's recent price action has ignited a renewed sense of optimism within the crypto community. A confluence of factors, ranging from whale activity and political pronouncements to macroeconomic indicators and regulatory developments, is shaping the current market narrative.
Whale Activity: A Harbinger of Bullish Momentum?
The resurgence of Bitcoin whale activity is a significant indicator that has captured the attention of traders and analysts. Large-scale Bitcoin holders, often referred to as "whales," possess the capacity to significantly influence market dynamics.1 Their accumulation of Bitcoin can signal strong conviction and potentially trigger broader market rallies. The recent uptick in whale activity suggests a renewed interest in Bitcoin among these major players, potentially laying the foundation for a sustained upward trend. This can be viewed as the building of a strong base of long positions.
Political Winds: Trump's Crypto Pronouncements and Market Sentiment
Political discourse has increasingly intersected with the cryptocurrency market, with recent statements from a prominent political figure influencing market sentiment. Rhetoric emphasizing the United States as a "Bitcoin superpower" has undeniably contributed to bullish momentum. This political articulation of a crypto-friendly approach signals potential policy shifts and improved regulatory clarity, both crucial factors in attracting institutional investment. Market participants are interpreting this as a sign of acceptance, if not outright endorsement, of digital assets at the highest levels.
It is worth noting that consistent pronouncements regarding the US becoming the "crypto capital of the world," while driving short term volatility, need to be followed with legislative action for long term impact.
Macroeconomic Factors: Fed Policies and Inflationary Concerns
The Federal Reserve's monetary policy and the evolving narrative surrounding inflation play a pivotal role in shaping Bitcoin's trajectory. Recent indications from the Fed regarding continued rate cuts, despite persistent inflationary pressures, have boosted investor confidence. This stance, coupled with Powell's assessment of certain inflationary factors, such as tariffs, as "transitory," has provided much-needed relief to risk assets, including Bitcoin. This monetary policy creates a favorable environment for investment. The combination of Fed policy confirmation and rumors of "significant updates" to US crypto plans have driven Bitcoin to new two-week highs.
Technical Analysis: The $85,000 Threshold and Beyond
From a technical perspective, Bitcoin's ability to reclaim the $85,000 level is considered a crucial milestone. Surpassing this threshold would validate the current bullish momentum and potentially pave the way for further gains. Analysts are closely monitoring key support and resistance levels to gauge the strength of the ongoing rally. The return of significant volume combined with the price retaking old highs lends to an increasingly bullish sentiment.
BlackRock's prediction of a price shift ahead indicates a growing acceptance of Bitcoin as a mainstream asset, potentially aligning it with traditional Wall Street investments.2 These kinds of comments indicate an institutional bullish long-term perspective.
Regulatory Clarity: Ripple's Resolution and Its Impact on Bitcoin
The resolution of Ripple's legal battle with the SEC has sent ripples (pun intended) throughout the cryptocurrency market. This development has provided much-needed regulatory clarity, bolstering investor confidence and fostering a more favorable environment for digital assets. The jump in XRP's price after confirmation of the case coming to an end further exemplifies the markets sensitivity to regulatory action. This resolution will influence Bitcoin’s adoption rates, as investors now know the US regulatory stance may be moderating.
Options Market Sentiment: A Shift Towards Bullishness
The Bitcoin options market has exhibited a noticeable shift towards bullishness, particularly after Powell's "transitory inflation" remarks. This sentiment reflects increased optimism among traders and investors, potentially signaling a sustained uptrend. An increased amount of bullish options being written displays further faith in the rise of Bitcoin’s price.
Bitcoin's Volatility: Navigating the Uncertainty
Despite the positive developments, Bitcoin remains inherently volatile. Price swings, driven by a combination of market sentiment, news events, and technical factors, are to be expected. Investors should remain vigilant and exercise prudent risk management strategies. While large volume and long term political promises are strong positive indicators, there are still volatile short term swings to consider.
Looking Ahead: The Potential for a Sustained Rally
The convergence of positive catalysts, including whale activity, political support, macroeconomic factors, and regulatory clarity, paints a potentially bullish picture for Bitcoin. However, the cryptocurrency market is subject to rapid shifts, and unforeseen events can significantly impact price movements.
To conclude, the present environment is ripe for sustained Bitcoin price discovery. The political and macroeconomic climates are aligning, coupled with increased whale activity and regulatory clarity. While markets will remain volatile, the trend is looking increasingly bullish.
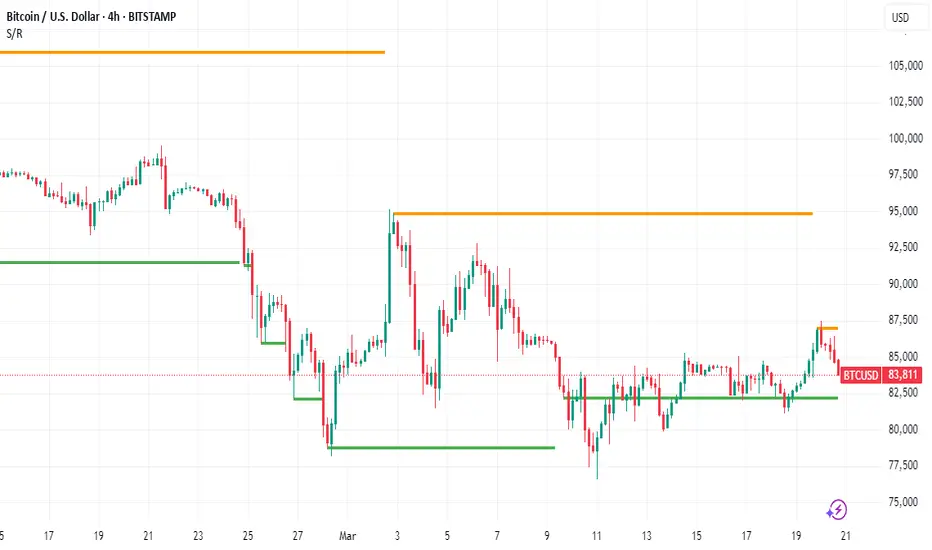
Bitcoin (BTC/USD) Technical Analysis & Trade Setup Market Structure & Key Levels:
The Bitcoin (BTC/USD) 4-hour chart displays a descending channel breakout, followed by a range-bound consolidation phase.
Key Support Levels:
$78,000 - $77,320: A strong demand zone where buyers have previously stepped in.
$80,000: Psychological support level.
Key Resistance Levels:
$84,340: Short-term resistance currently being tested.
$85,996: Next major resistance level.
$89,363: Target resistance level if a breakout occurs.
$92,331: A higher timeframe resistance level.
Chart Pattern & Price Action:
Descending Channel (Early March)
Price was in a downtrend, forming a descending channel pattern.
The breakout from this channel led to a shift in momentum.
Range Consolidation (Current Pattern)
After the breakout, BTC entered a sideways accumulation phase (marked by the red box).
Price is bouncing between $82,000 - $84,500, showing low volatility and indecision.
Breakout Possibility (Bullish Bias)
A break above $84,500 could confirm a bullish move towards $85,996 and beyond.
The next major target is $89,363, which aligns with previous resistance.
Support Retest (Bearish Risk)
If BTC fails to break resistance, we might see a retest of $80,000 or even $78,000.
A break below $77,320 would invalidate the bullish scenario.

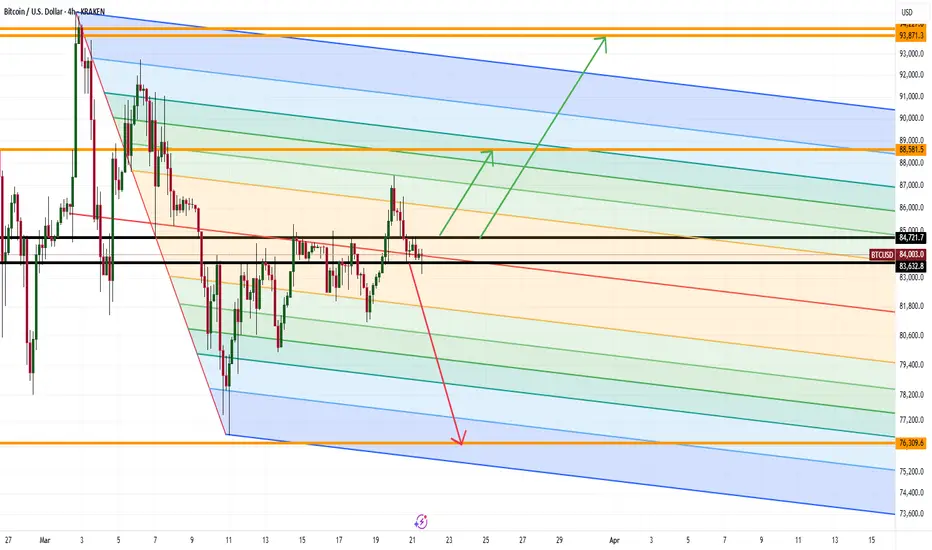
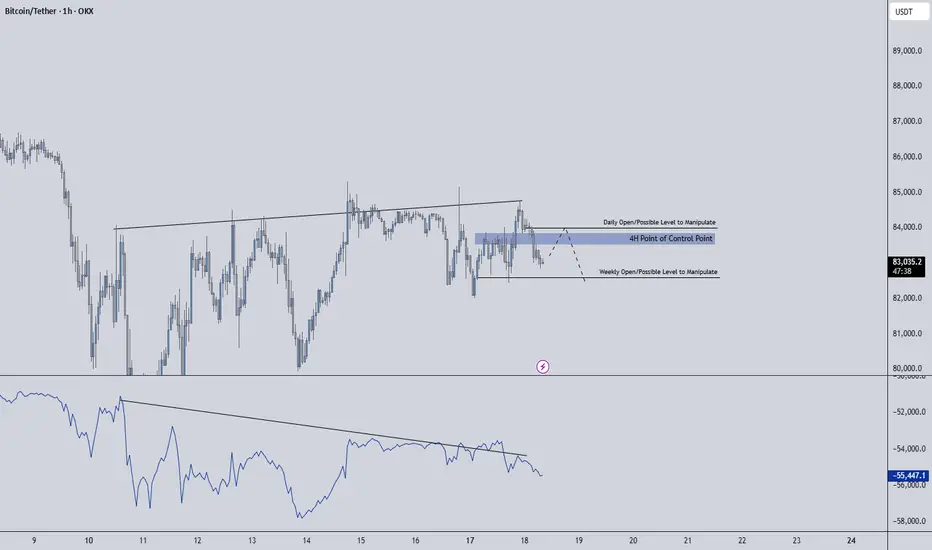
BTCUSDT - Forecast for Today!My general opinion is that we will go back and forth in the intermediate zones until interest rate decision is announced and I'm bearish for now due to CDV. I have indicated the possible manipulations in these intermediate zones in the drawings on the chart.
Starting from the 4-hour point of control zone(indicated in the chart), I will start looking for short trends downwards and as usual, I will enter with confirmations in the low time frame.
I have a long list of my proven technique below:
🤖 IQUSDT: Smart Plan
🟠 IDEXUSDT: Spot Buy Area | %26 Profit if You Trade with MSB
📌 USUALUSDT: Buyers Are Active + %70 Profit in Total
🌟 FORTHUSDT: Sniper Entry +%26 Reaction
🐳 QKCUSDT: Sniper Entry +%57 Reaction
Bitcoin Clears October 2024 FVG! What’s Next?BTC has successfully cleared the Fair Value Gap (FVG) from October 2024. The range has been tested, and we are now witnessing some sideways movement in lower time frames (LTF).
The $93.2K level remains the most critical resistance for now. Historically, Bitcoin has seen 29% to 32% corrections right before the final wave. It's also important to note that the 50EMA on the weekly chart has repeatedly acted as a strong support, preventing major breakdowns in the past.
I will be posting a detailed analysis on Bitcoin corrections this week. So far, we've already seen signs of this playing out. BTC must start reversing from here, or we could see one more push to the $70K range, forming a double or triple bottom before the final breakout.
This is not the time to be bearish, news cycles and geopolitical events can shift dramatically in the coming weeks or months. We've seen this pattern many times before, haven't we?
Stay prepared for what’s coming! I’ll also be sharing altcoin charts that could perform well in the upcoming months.
👉 If you found this analysis valuable, hit that Like button and make sure to follow me for more insights!
#PEACE

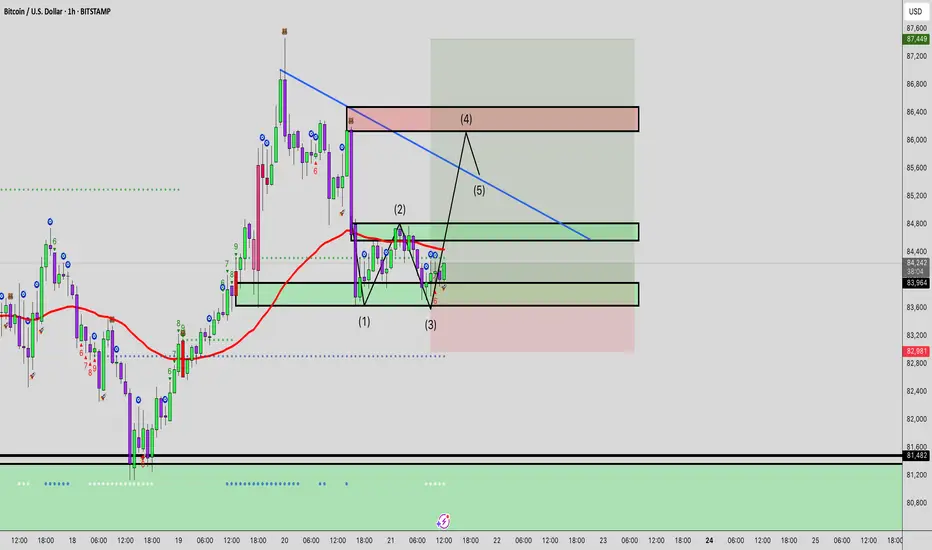
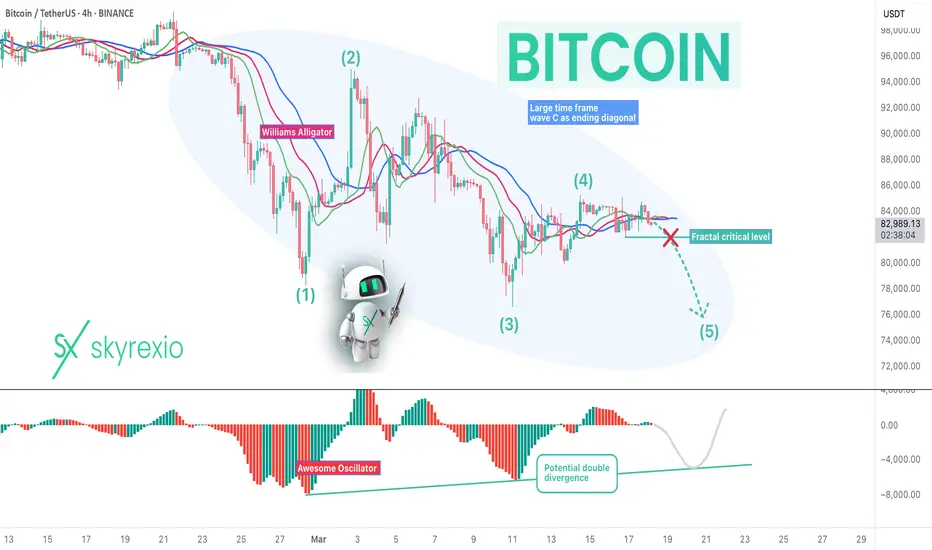
WARNING! Bitcoin BTC Can Crush To $75k Again!Hello, Skyrexians!
Recently, when the BINANCE:BTCUSDT price was below $80k we told you that reversal will come soon and $140k is next, but this correction can lasts longer, that we supposed. There is a high chance to see the another one dip to $75k and we will explain why.
Let's take a look at the 4h time frame. Those who read our articles know that Bitcoin is in wave C and this wave shall have 5 waves, but can be like an ending diagonal. We suppose this scenario. In this case double divergence with Awesome oscillator is likely. Now we have the high probability to see wave 5. This scenario is likely in price breaks down the GETTEX:82K key fractal level and confirm short setup.
Best regards,
Skyrexio Team
___________________________________________________________
Please, boost this article and subscribe our page if you like analysis!
$84K BTC Battle, ETF Resilience, and Macroeconomic ShadowsBitcoin's journey remains a captivating saga of volatility, resilience, and the interplay of technical indicators and macroeconomic forces. Recently, the cryptocurrency surged past $84,000, reigniting bullish sentiment, but faces a critical test at a key resistance level.1 This surge, fueled by a broader rebound in risk assets, pushed BTC above its 200-day moving average, a pivotal benchmark for assessing long-term trends. However, this bullish momentum is juxtaposed with significant selling pressure, ETF outflows, and lingering concerns about regulatory and macroeconomic landscapes.
The 200-Day Moving Average: A Battleground for Bulls
The 200-day moving average is a widely recognized technical indicator that provides insight into the long-term trend of an asset. For Bitcoin, consistently closing above this level signifies a potential shift from bearish to bullish momentum. The recent breach is a positive sign for bulls, indicating renewed confidence and potentially attracting further investment. However, a sustained close above this level is crucial to solidify the bullish outlook.
The importance of this level is highlighted by the narrative that a weekly close above this average would confirm a market bottom. This emphasizes the significance of longer timeframes in validating trends in the highly volatile cryptocurrency market.
$86K or $65+K: A Price at a Crossroads
Bitcoin's price currently finds itself at a critical juncture. The immediate challenge is breaching the $86,000 resistance level. A successful breakout could pave the way for further gains, potentially pushing Bitcoin towards new all-time highs. Conversely, failure to overcome this resistance could lead to a pullback towards the $65,000 support level. This range represents a crucial battleground for bulls and bears, with the outcome likely to determine the short-term trajectory of Bitcoin's price.
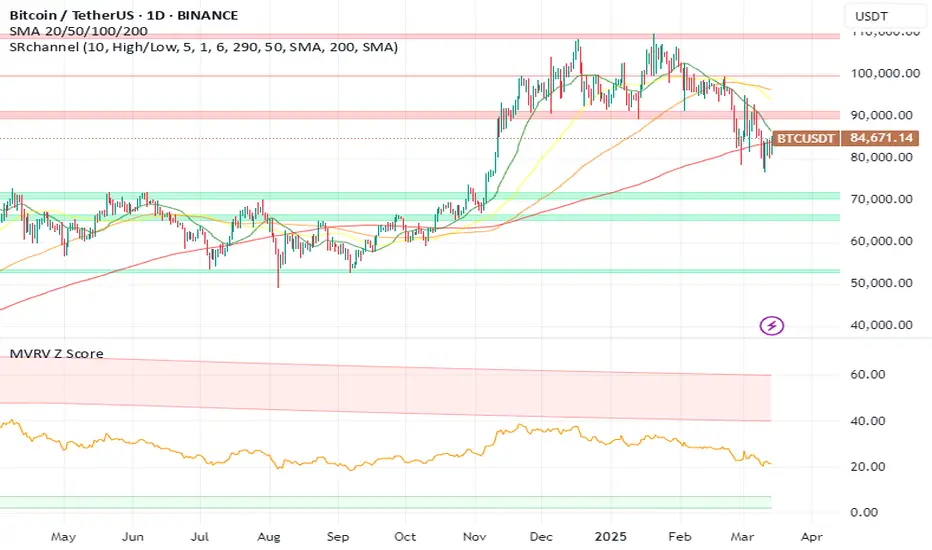
MVRV Ratio: A Potential Reversal Indicator
The Market Value to Realized Value (MVRV) ratio is another key metric that investors closely monitor. It compares Bitcoin's market capitalization to its realized capitalization, providing insights into potential overbought or oversold conditions. A high MVRV ratio suggests that Bitcoin is overvalued and prone to a correction, while a low ratio indicates undervaluation and potential for a rebound. The MVRV ratio nearing a key level suggests that a major reversal could be imminent, adding another layer of complexity to Bitcoin's current price action.
ETF Resilience Amidst Volatility
Despite a 25% price drop, Bitcoin ETF investors have maintained a relatively strong stance. This resilience is reflected in the collective $115 billion in assets under management by US Bitcoin ETFs. This demonstrates the growing institutional adoption of Bitcoin and the increasing acceptance of cryptocurrencies as a legitimate asset class. However, since mid-February, Bitcoin ETFs have witnessed total outflows of nearly $5 billion. This outflow points to a potential shift in investor sentiment, possibly driven by concerns about market volatility or macroeconomic uncertainties.
The strength of the ETF market is a double edged sword. While significant holdings demonstrate institutional buy in, large outflows can increase sell pressure on the underlying asset.
Selling Pressure and Macroeconomic Shadows
Bitcoin's recent decline is attributed to intensified selling pressure, reflecting a broader trend of risk aversion in the market. This selling pressure is exacerbated by concerns about the potential impact of digital currencies on traditional banking systems. Banks are increasingly weighing the implications of Bitcoin and other cryptocurrencies, leading to regulatory scrutiny and potential policy changes.
Furthermore, macroeconomic factors continue to weigh on investor sentiment. Concerns about inflation, interest rate hikes, and geopolitical tensions are contributing to market volatility and impacting the demand for risk assets, including Bitcoin.
Presidential Policy and Market Sentiment
A presidential policy aimed at creating a strategic Bitcoin reserve initially sparked optimism among investors. However, this initial enthusiasm waned, highlighting the complex interplay between policy announcements and market reactions. While such policies can signal government acceptance of cryptocurrencies, they may not always translate into immediate price appreciation.
The market's reaction suggests that investors are more focused on broader macroeconomic trends and regulatory clarity. The lack of sustained positive impact from the policy announcement underscores the importance of addressing fundamental concerns about Bitcoin's long-term viability and regulatory framework.
Navigating the Volatility
Bitcoin's current situation highlights the inherent volatility and unpredictable nature of the cryptocurrency market. Investors must remain vigilant and adapt to rapidly changing market conditions. The interplay of technical indicators, ETF flows, and macroeconomic factors creates a complex landscape that requires careful analysis and strategic decision-making.
In conclusion, Bitcoin's battle at $84K, coupled with the resilience of ETF investors and the shadow of macroeconomic uncertainties, paints a picture of a market at a critical juncture. The coming weeks will be crucial in determining whether Bitcoin can sustain its bullish momentum or succumb to renewed selling pressure. Understanding the interplay of these factors is essential for navigating the volatile world of cryptocurrency investing.
BTCUSDT UPDATE....What we can expect next????Things are going accordingly. We are currently probably forming ending diagonal which indicates a trend reversal. If things go even, we can expect reversal from 74-69k region which is also PRZ of bat harmonic pattern. Also golden fib. level (61.8) of micro wave (iii) is aligning in PRZ zone.

$BTC Bitcoin Next Target PTs 68,919 --> 102,000 (April 2025) CRYPTOCAP:BTC Bitcoin
Next Target PTs 68,919 --> 102,000 (April 2025) -->
36,000 (Rebuy late 2026) --> 200k top Dec 2027

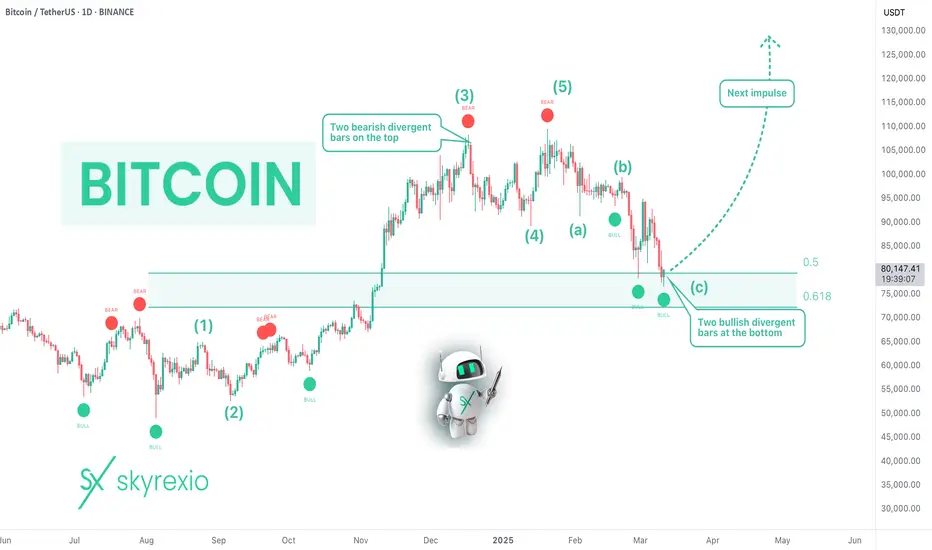
Bitcoin BTC - Bottom Or The Bear Market? [READ CAREFULLY!]Hello, Skyrexians!
Let's update our BINANCE:BTCUSDT idea. Last time we told you that this is the bottom when price was at $80k previous time. Yesterday we posted a mind at $78k that "Don't panic, this is the bottom". Today we have the update on this crypto to give you the thoughts what can really happen next.
Let's take a look at the daily timeframe. We have shown you already the 5 Elliott wave cycle with two red dots on our Bullish/Bearish Reversal Bar Indicator . After that correction has been started. Now it looks like that price has finished the ABC zigzag and ready for the reversal. VERY IMPORTANT: price shall form the bullish bar and green dot on indicator on the daily close. We are still in danger, but if it will happen, it's going to be the strong long signal inside the Fibonacci 0.5-0.61 zone. After that the next impulse is going to happen.
P.S. On 4h and lower time frames picture is beautiful!
Best regards,
Skyrexio Team
___________________________________________________________
Please, boost this article and subscribe our page if you like analysis!
Dollar Decline Fuels Bitcoin Bull Case, Macro Signal CautionThe intricate relationship between the U.S. dollar and Bitcoin continues to be a focal point of analysis within the cryptocurrency market. While a weakening dollar can indeed bolster Bitcoin's bull case, a confluence of other metrics necessitates a cautious outlook. The dynamic interplay between these factors creates a complex and volatile environment for Bitcoin.
The Dollar's Decline and Bitcoin's Ascent:
• A weakening U.S. dollar often strengthens the appeal of alternative assets, including Bitcoin. This is because Bitcoin, perceived by some as a hedge against inflation and the devaluation of fiat currencies, becomes relatively more attractive when the dollar's purchasing power diminishes.
• This inverse correlation stems from Bitcoin's nature as a decentralized, limited-supply asset, contrasting with the potentially inflationary nature of fiat currencies.1 When investors lose confidence in the dollar, they may turn to Bitcoin as a store of value.
"High-Stakes Game of Chicken" with Central Banks:
• The phrase "Bitcoin playing a high-stakes game of chicken" with central banks aptly captures the ongoing tension between decentralized cryptocurrencies and traditional financial institutions.
• Central banks wield significant influence over monetary policy, and their decisions can have a profound impact on the value of fiat currencies and, consequently, on the cryptocurrency market.2
• The potential for regulatory crackdowns or the introduction of central bank digital currencies (CBDCs) poses a considerable risk to Bitcoin's long-term prospects.
• Conversely, if central banks where to greatly devalue their currencies, it would greatly boost the Bitcoin bull case.
Concerning Metrics and Cautious Outlook:
• Despite the potential benefits of a weakening dollar, other metrics warrant a cautious outlook.
• Market volatility remains a significant concern. Bitcoin's price fluctuations can be extreme, making it a risky investment for those with low risk tolerance.
• Regulatory uncertainty continues to cast a shadow over the cryptocurrency market. Governments worldwide are grappling with the challenge of regulating cryptocurrencies, and any adverse regulatory developments could trigger a sharp sell-off.
• Also, the overall global economic climate, with the potential for recessions, and geopolitical instability, add layers of uncertainty to the market.
• Investor sentiment is also a huge factor. While there are times of great excitement, and "Fear of missing out"(FOMO), there are also times of great fear, that can cause large sell offs.
Key Considerations:
• Macroeconomic Factors: The broader economic environment, including inflation, interest rates, and economic growth, plays a crucial role in shaping Bitcoin's price trajectory.
• Regulatory Landscape: The evolving regulatory landscape remains a key factor that could greatly effect Bitcoin's price.
• Investor Sentiment: The psychological factors that drive investor behavior, such as fear and greed, can have a significant impact on Bitcoin's price.
• Technological Developments: Advancements in blockchain technology and the adoption of cryptocurrencies by mainstream institutions could provide a boost to Bitcoin's long-term prospects.
In essence, while the weakening U.S. dollar may provide a favorable tailwind for Bitcoin, investors must remain vigilant and consider the multitude of other factors that could influence its price. The "high-stakes game of chicken" with central banks underscores the inherent uncertainty of the cryptocurrency market, and a cautious outlook is warranted.

Bitcoin's November Low: Recession Fears, and Volatility
Bitcoin's recent slump, dipping below $80,000 to levels not seen since November, has sent ripples through the cryptocurrency market. This downturn, fueled by heightened recession fears and a complex interplay of macroeconomic factors, has triggered a wave of analysis and speculation. While some experts predict further corrections, others point to potential catalysts for a resurgence. Amidst this uncertainty, South Korea's ambitious push for a Bitcoin reserve and the burgeoning $BTCBULL presale add intriguing layers to the narrative.
The primary driver behind Bitcoin's decline is the growing apprehension of a global economic recession. Persistent inflation, rising interest rates, and geopolitical tensions have created a climate of uncertainty, prompting investors to seek refuge in traditional safe-haven assets. This risk-off sentiment has weighed heavily on Bitcoin, a notoriously volatile asset class.
Adding to the complexity of the situation is the ongoing tension between Bitcoin and central banks. As one expert noted, Bitcoin is "playing chicken with central banks" as the dollar experiences fluctuations. This dynamic underscores the fundamental debate surrounding Bitcoin's role as a potential hedge against traditional financial systems. The recent volatility surge following Donald Trump's comments on a Bitcoin reserve and the options expiry further exemplifies this tense relationship.
Despite the bearish sentiment, there are glimmers of optimism. South Korea's ambitious plan to establish a Bitcoin reserve has captured the attention of the crypto community. This move, if realized, could signal a significant shift in the adoption of Bitcoin by institutional players and governments. The implications are far-reaching, potentially bolstering Bitcoin's legitimacy as a store of value and a strategic asset.
The $BTCBULL presale, emerging amidst this volatile landscape, presents an interesting case study. In a market characterized by uncertainty, presales offer investors the opportunity to gain early access to potentially high-growth projects. However, they also carry inherent risks, and their success depends on a multitude of factors, including market conditions, project fundamentals, and community support. The $BTCBULL presale’s ability to attract investors during this period of market downturn will be a good indicator of overall market sentiment. Should it succeed, it may indicate that despite the general bearishness, there is still strong interest in projects that are perceived to be innovative, or to offer a unique value proposition.
The current trading range of $78,000 to $82,000 reflects the market's indecision. Bullish momentum has clearly faded, leaving traders grappling with the implications of shifting macroeconomic conditions. The volatility witnessed in recent days underscores the need for caution and strategic decision-making.
Furthermore, the impact of regulatory developments cannot be ignored. Governments worldwide are grappling with the challenge of regulating cryptocurrencies, and any significant regulatory changes could have a profound impact on Bitcoin's price and adoption. The ongoing debate surrounding stablecoins, DeFi, and central bank digital currencies (CBDCs) adds another layer of complexity to the market.
In conclusion, Bitcoin's recent fall to November lows is a reflection of the broader economic uncertainties and the inherent volatility of the cryptocurrency market. While recession fears and bearish predictions dominate the headlines, South Korea's ambitious Bitcoin reserve plan and the $BTCBULL presale offer glimpses of potential future growth. Investors must navigate this complex landscape with caution, carefully considering the interplay of macroeconomic factors, regulatory developments, and market sentiment. The current volatility serves as a reminder of the need for thorough research and a long-term perspective. Whether Bitcoin retests lower support levels or stages a comeback remains to be seen, but one thing is certain: the cryptocurrency market will continue to be a dynamic and unpredictable space.

Bitcoin - Bitcoin’s fate in Trump’s hands?!Bitcoin is trading below the EMA50 and EMA200 on the four-hour timeframe and is trading in its descending channel. Bitcoin’s continued downward trend and its inclusion in the zone may buy it again for us.
A Bitcoin correction will also be offered to test the selling from the zone. It should be noted that there is a possibility of heavy fluctuations and shadows due to the movement of whales in the market and one should have capital management in the cryptocurrency market, than we can ask for more. If the downward trend continues, I can buy now.
During Trump’s presidency, the United States is aiming to become the “global capital of cryptocurrencies.” A key component of this strategy is establishing a national digital asset reserve, where Bitcoin will play a central role as a “digital Fort Knox.” Currently, the U.S. holds approximately 200,000 Bitcoins, making it one of the largest Bitcoin holders globally. Other digital assets, apart from Bitcoin, will be stored separately.
In contrast, during Biden’s administration, a significant portion of government-held Bitcoin was sold, slowing the growth of the cryptocurrency sector and restricting banks from engaging in digital asset transactions. These policies resulted in a decline in crypto development within the U.S.
Now, the Trump administration is reviewing all digital assets under U.S. ownership and evaluating the possibility of acquiring more Bitcoin. Additionally, the administration aims to end “Operation Choke Point 2.0,” which had pushed banks away from crypto, and accelerate the passage of stablecoin legislation by the end of the August recess. Trump has also declared that the U.S. will never sell its Bitcoin holdings, keeping them as a long-term reserve asset.
Following Trump’s remarks about creating a national digital currency reserve, Bitcoin initially surged but later fell below its pre-announcement level. Currently, Bitcoin’s price has dropped below $83,000, with other major cryptocurrencies experiencing similar declines.
Last week, U.S. President Donald Trump announced via Twitter that his administration was establishing a strategic reserve of digital assets, including Bitcoin, Ethereum, Solana, Ripple, and Cardano. While this initially drove prices higher, it was later clarified that the plan only involved holding confiscated digital assets rather than making direct crypto purchases.
On Friday, Trump signed an executive order formalizing the initiative, but markets reacted negatively. Bitcoin fell by $3,000, reaching its lowest level in weeks. The order does leave open the possibility of government Bitcoin purchases in the future, though such a move would likely require congressional approval.
As a result, most cryptocurrencies that had gained value due to the announcement have since lost those gains. Assets such as Cardano, Solana, Ripple, and Ethereum have all returned to their pre-announcement price levels. This event once again underscored that governments often act more as liquidity exit points rather than driving new capital inflows into the market.
Meanwhile, Michael Saylor, founder of Strategy, has proposed that the U.S. government should acquire 25% of the total Bitcoin supply by 2035 to establish a strategic Bitcoin reserve. His suggestion is for the government to systematically purchase between 5% and 25% of Bitcoin’s supply through daily acquisitions from 2025 to 2035, by which time 99% of all Bitcoin will have been mined.
Saylor presented this idea at the White House Crypto Summit, urging President Trump and top crypto leaders to adopt a “never sell your Bitcoin” policy. He predicts that such a reserve could be worth between $16 trillion and $81 trillion by 2045, potentially helping to reduce the national debt.
BTCUSDT Analysis – From Simple to Complex!BTCUSDT Analysis – From Simple to Complex! 🚀
“Let’s break it down step by step. At first glance, the first red line looks like an obvious resistance point. But here’s the deal—it’s too obvious. And in trading, when something is too obvious, it often doesn’t work as expected.”
Basic Structure:
📌 Red Line = Clear Resistance – Everyone sees it, but that also means it could be a trap.
Now, Let’s Get Deeper...
🔍 Volume Analysis Changes the Game:
Weekend Moves with Low Volume = High Manipulation Risk – Crypto loves to fake out retail traders in these conditions.
Look at the Black Line Inside the Blue Area – This is where things get interesting. This level could be the true battleground between buyers and sellers.
CDV & Volume Profile Will Guide Us – We need confirmation from buying and selling volumes before making any major moves.
Final Thoughts:
“At first, the chart looks simple, but once you add volume analysis, things get more complex. Don’t trade based on what looks obvious—trade based on what’s actually happening in the order flow. I’ll explain the next step in my following post!”
📉 Stay smart, stay ahead! 🔥
My approach is built on years of experience and a solid track record. I don’t claim to know it all, but I’m confident in my ability to spot high-probability setups.
If you would like to learn how to use the heatmap, cumulative volume delta and volume footprint techniques that I use below to determine very accurate demand regions, you can send me a private message. I help anyone who wants it completely free of charge.
I have a long list of my proven technique below:
AVAXUSDT Perfect Short Entry!
🎯 ZENUSDT.P: Patience & Profitability | %230 Reaction from the Sniper Entry
🐶 DOGEUSDT.P: Next Move
🎨 RENDERUSDT.P: Opportunity of the Month
💎 ETHUSDT.P: Where to Retrace
🟢 BNBUSDT.P: Potential Surge
📊 BTC Dominance: Reaction Zone
🌊 WAVESUSDT.P: Demand Zone Potential
🟣 UNIUSDT.P: Long-Term Trade
🔵 XRPUSDT.P: Entry Zones
🔗 LINKUSDT.P: Follow The River
📈 BTCUSDT.P: Two Key Demand Zones
🟩 POLUSDT: Bullish Momentum
🌟 PENDLEUSDT.P: Where Opportunity Meets Precision
🔥 BTCUSDT.P: Liquidation of Highly Leveraged Longs
🌊 SOLUSDT.P: SOL's Dip - Your Opportunity
🐸 1000PEPEUSDT.P: Prime Bounce Zone Unlocked
🚀 ETHUSDT.P: Set to Explode - Don't Miss This Game Changer
🤖 IQUSDT: Smart Plan
⚡️ PONDUSDT: A Trade Not Taken Is Better Than a Losing One
💼 STMXUSDT: 2 Buying Areas
🐢 TURBOUSDT: Buy Zones and Buyer Presence
🌍 ICPUSDT.P: Massive Upside Potential | Check the Trade Update For Seeing Results
🟠 IDEXUSDT: Spot Buy Area | %26 Profit if You Trade with MSB
📌 USUALUSDT: Buyers Are Active + %70 Profit in Total
