Revsiting $150k - $200k Bitcoin (AND Next Bear Market Bottom)In this video I revisit my 2-year old study showing the potential path for Bitcoin to $150k to $200k and not only how we might get there, but the 11 reasons WHY we can this cycle.
This is the same Fibonacci series that predicted the 2021 cycle high at the 3.618 (Log chart) and used the same way this cycle, with some interesting 2025 forecasts of:
1.618 - $100k
2.618 - $150k
3.618 - $200k
There are quite a few confluences that we get to $150k like the measured moves from both the recent mini bull flag, but also the larger one from earlier this year.
** Also I touch on revisiting my study from 2 years ago where I may have discovered the retracemebnt multiple that correctlty predicted and held the 2022 lowes around $16k. **
It's a VERY interesting number you all will recognize (buy may not agree with).
Let me know what you think.
Bitcoinlong

Bitcoin - Trust the higher timeframe!⚔️Bitcoin ( CRYPTO:BTCUSD ) is still 100% bullish:
🔎Analysis summary:
For the past couple of months we have been seeing an overall consolidation on Bitcoin. But looking at the higher timeframe, Bitcoin remains in an underlying strong bullrun. Consolidations are always expected and no reason to freak out since everything is still bullish.
📝Levels to watch:
$100.000
🙏🏻#LONGTERMVISION
Philip - Swing Trader

BTC - Long SET-UP BINANCE:BTCUSDT
Bitcoin AMC Pattern Forming?
BTC is showing signs of an AMC-style accumulation after a range-bound consolidation. A clean breakout is possible if price respects the 113k–113.8k support zone — potential entry zone for smart money 📈
Alternatively, deeper liquidity may be tapped at the 110k–112k OB zone, offering another high-probability buy setup🔁
Watch for signs of bullish intent in these key zones — price structure suggests upside potential once liquidity is swept✅

BTC/USDT Analysis: Inside the Range
Hello everyone! This is a daily analysis from a trader-analyst at CryptoRobotics.
Yesterday, Bitcoin continued moving toward the upper boundary of the sideways range. Strong market buying emerged near that level, but unfortunately, it was absorbed by sellers.
At the moment, we are testing the POC (Point of Control) of the current trading range. Buyer activity is already appearing at this level. If bulls regain initiative, we can expect a move back to the upper boundary. However, if the price drops below the current level, there is a high probability of stop-loss hunting and a liquidity grab near $115,000.
Buy Zones:
~$115,000 (zone of initiating/pushing volumes)
$110,000–$107,000 (accumulated volumes)
This publication is not financial advice.

BTC/USDT Analysis: Rotation Continues
Hello everyone! This is a daily analysis from a trader-analyst at CryptoRobotics.
Yesterday, Bitcoin continued to rotate within a narrow sideways range, and so far, there has been no breakout. We retested the lower boundary of the range and once again saw absorption of market selling at that level.
At the moment, the scenario remains valid — we expect a breakout to the upside. Several factors support this outlook: strong defense at the lows, delta absorption across the entire range, and buyer control on the most recent local upward wave.
A less likely scenario is a dip into the lower buy zone, a liquidity grab, and another attempt to move higher.
Buy Zones:
~$115,000 (zone of initiating/pushing volumes)
$110,000–$107,000 (accumulated volumes)
This publication is not financial advice.

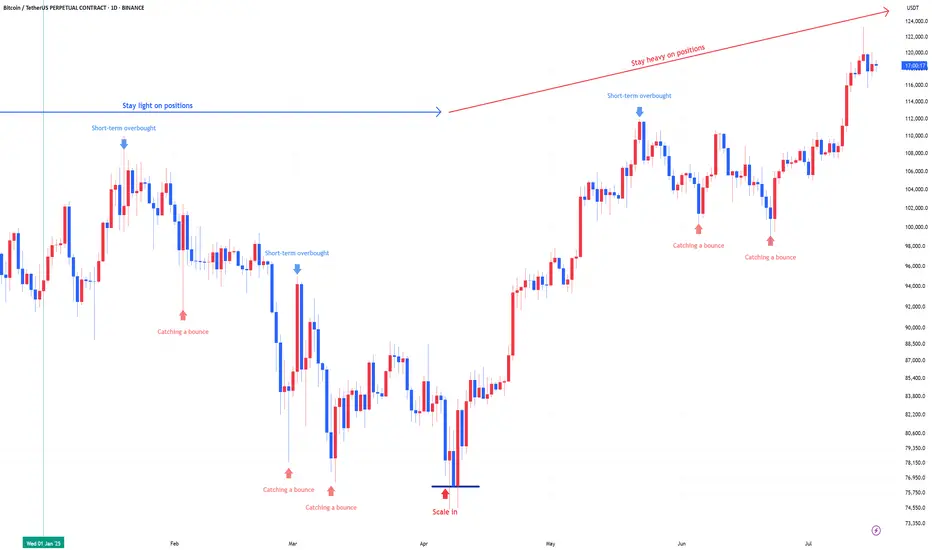
Bitcoin : Stay heavy on positionsApril was the scale-in zone:
Back in April, the US stock market flashed a split-entry buy signal—a classic zone for gradual accumulation.
That same setup applied to Bitcoin. Buying the fear worked again.
We’ve moved out of the fear zone:
Both Bitcoin and equities have left the extreme fear territory behind. Sentiment has shifted.
Short-term overbought now:
Bitcoin is currently in a short-term overbought phase. Some consolidation or cooling off is natural here, but no major trend reversal signs yet.
Stay heavy on positions:
I’m maintaining an overweight position in Bitcoin as long as the US stock market stays intact. The Nasdaq is holding up, so Bitcoin likely stays in risk-on mode.
Warning:
If US equities take a hit, expect Bitcoin to follow.
Negative moves in the stock market will likely translate directly into crypto weakness.

Bitcoin Weekend ForecastIts in the middel of wave 4 correction, impulses are tradeable
Levels Highlighted in the chart

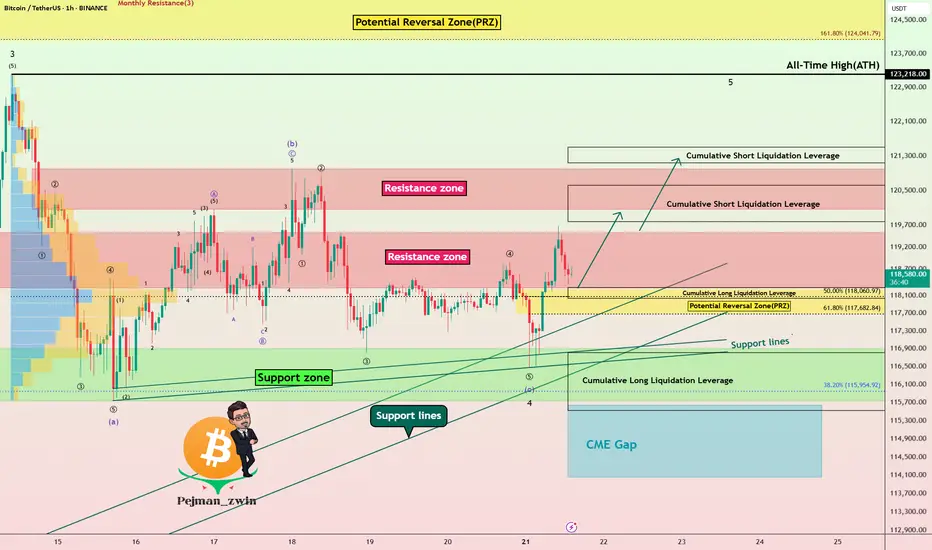
Bitcoin Technical Setup: Support Holds, Wave 5 in FocusBitcoin ( BINANCE:BTCUSDT ) filled the CME Gap($117,255-$116,675) and started to rise, as I expected in my previous idea .
Bitcoin is currently trying to break the Resistance zone($119,530-$118,270) . In the last week's movement, the price of $118,000 can be considered as one of the most important numbers for Bitcoin , with a lot of trading volume around this price.
In terms of Elliott Wave theory , it seems that Bitcoin has managed to complete the main wave 4 near the Support zone($116,900-$115,730) and Support lines . The structure of the main wave 4 is a Zigzag Correction(ABC/5-3-5) (so far). There is a possibility that the 5th wave will be a truncated wave because the momentum of the main wave 3 is high and Bitcoin may NOT create a new ATH and the main wave 5 will complete below the main wave 3.
I expect Bitcoin to start rising near the Potential Reversal Zone(PRZ) and Cumulative Long Liquidation Leverage($118,277-$118,033) , break the Resistance zone($119,530-$118,270) and reach the targets I have marked on the chart.
Note: Stop Loss(SL)= $116,960
CME Gap: $115,060-$114,947
Cumulative Short Liquidation Leverage: $121,502-$121,134
Cumulative Short Liquidation Leverage: $120,612-$119,783
Cumulative Long Liquidation Leverage: $116,810-$115,522
Do you think Bitcoin can create a new ATH again?
Please respect each other's ideas and express them politely if you agree or disagree.
Bitcoin Analyze (BTCUSDT), 1-hour time frame.
Be sure to follow the updated ideas.
Do not forget to put a Stop loss for your positions (For every position you want to open).
Please follow your strategy and updates; this is just my Idea, and I will gladly see your ideas in this post.
Please do not forget the ✅' like '✅ button 🙏😊 & Share it with your friends; thanks, and Trade safe.
BITCOIN FINAL WARNING BEFORE HUGE MOVE!!! (urgent) Yello Paradisers! I am Sharing with you my idea about #Bitcoin of what's going on with Bitcoin right now: be very careful because the Fear and Greed Index, a special one, is at "Greed". We are seeing funding rates, the accumulated funding rates, as extremely positive. We are seeing bearish patterns forming.
In this video, I'm describing the confirmations we are waiting for that will confirm that Bitcoin is about to make a huge movement. Make sure that you are trading with professional trading strategies and that you are waiting for confirmations before any trade execution. Also, make sure that you have tight risk management because only the best, most professional traders will win long-term in this game.
Don't be a gambler. Don't try to get rich quick. Make sure that your trading is professionally based on proper strategies and trade tactics.

Urgent Bitcoin Prediction: Longs Beware!!! Bitcoin longs should be careful, as we are below an important resistance and the market looks bearish. Wait for the confirmations I’ve shown in the video before making any moves! Trade professionally with a proper strategy and well-defined entry tactics!

Market overview
WHAT HAPPENED?
Last week, after updating the historical maximum, bitcoin went into correction for the first time, after which it went sideways.
At the moment, the $117,300 – $116,300 zone has been retested (strong absorption of sales) and an active reaction from buyers has been received.
Within the current flat, the cumulative delta supports buyers, indicating the absorption of market sales. At the same time, the global wave structure on the 4H chart casts doubt on the last wave of buys, as we’ve rapidly adjusted back to its beginning.
💼 WHAT WILL HAPPEN: OR NOT?
We expect to exit the sideways at $116,000 – $121,000 in an upward direction from the current levels, either through capturing liquidity and testing the pushing volume zone at $115,000.
The target is the last ATH, which is $123,200. A re-correction is possible near $123,200, resulting in a wider flat range of $123,200 to $115,000. If there is a true breakout, we can expect the continuation of the global long trend.
Buy Zones:
~$115,000 (zone of initiating/pushing volumes)
$110,000–$107,000 (accumulated volume)
📰 IMPORTANT DATES
Macroeconomic events this week:
• Tuesday, July 22, 12:30 (UTC) — speech by Fed Chairman Jerome Powell;
• Wednesday, July 23, 14:00 (UTC) — publication of data on US second-hand housing sales for June;
• Thursday, July 24, 12:15 (UTC) — announcement of the deposit rate for July and the interest rate decision in the Eurozone;
• Thursday, July 24, 12:30 (UTC) — publication of the number of initial applications for unemployment benefits in the United States;
• Thursday, July 24, 12:45 (UTC) — press conference of the European Central Bank;
• Thursday, July 24, 13:45 (UTC) — publication of business activity indices (PMI) in the manufacturing and services sectors of the United States for July;
• Thursday, July 24, 14:00 (UTC) — publication of data on new home sales in the United States for June.
*This post is not a financial recommendation. Make decisions based on your own experience.
#analytics

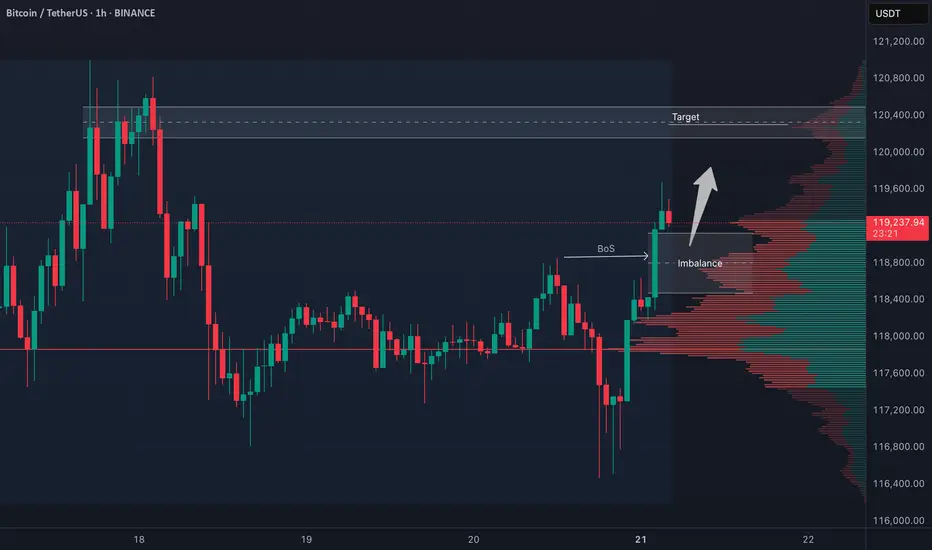
BTC 4H Structure Break – Long Bias with Conditions🚀 BTC (Bitcoin) has clearly broken bullish market structure on the 4-hour timeframe.
📈 My bias is to ride the momentum and look for a pullback to enter long.
✅ I follow a specific entry criteria — price must pull back into the imbalance, find support, and then form a bullish break of structure on a 15m chart to trigger an entry.
❌ If that setup doesn't play out, we simply abandon the idea.
⚠️ This is not financial advice.
BTC - Breakout, Fakeout… or Loading Zone?BTC is back inside the $116K–$117K demand zone — same level that launched the last breakout.
But this time? Consolidation. Stoch RSI stuck mid-range. Unclear momentum.
The Hull Suite Strategy nailed the previous breakout with clean stacked buys — but it’s showing hesitation now.
This is where strategy testing really matters. Not every system handles chop the same.
📊 We test these setups across multiple variations — especially in zones like this where most signals lose edge.
Support flip or breakdown brewing? Watching closely.
—
#BTCUSD #Bitcoin #HullSuite #StrategyTesting #BacktestBetter #QuantTradingPro #CryptoAnalysis #TradingView

Still btc bullish
Don't predict just move according to market
Manage your risk before go to trade
Flag pattern also confirming market still continue up
Strong resistance level looking for break if it broken market make new higher high TP 75 to 82
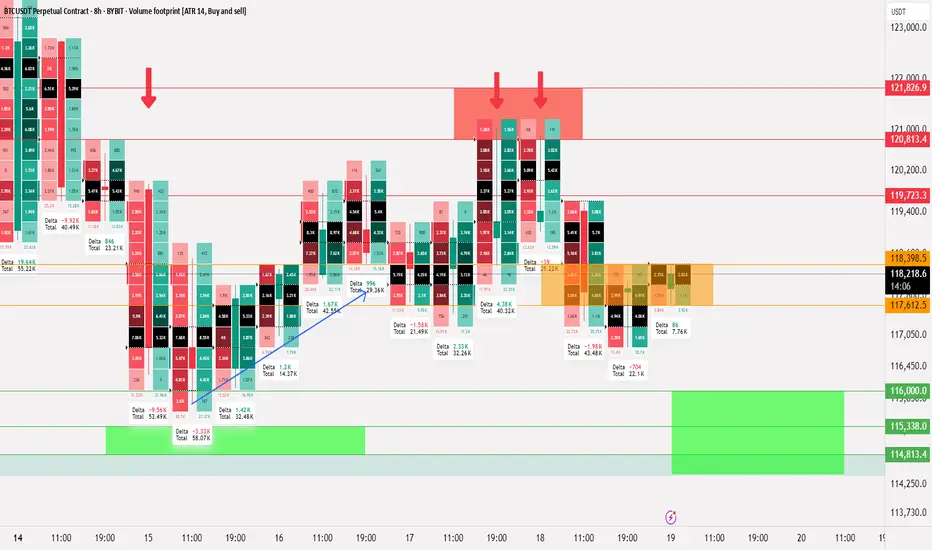
Bitcoin Liquidity updateCRYPTOCAP:BTC
📄 Update on liquidity movement and key liquidity cluster points
◀️ Summary of the first movement: A sale occurred at 121826 and a break happened at 117612, after which liquidity was collected between 116 - 115
◀️ After collecting liquidity, we mentioned that breaking 117612 would allow testing 119723, and that is what happened
⭕️ Now, a selling range has formed between 120813 - 121826, which is clear on the price chart and the way it bounced down
🟣 The current movement is confined between 118398 - 117612
📄 Regarding trading ideas:
⭕️ The thought here is to buy between 11600 - 114813 if a break occurs at 117612 and trading starts below it
⭕️ The second idea, in case this break does not happen, is to wait for confirmation of trading above 118398, and in this case, it's preferable to wait until Monday
Bitcoin : Stay heavy on positionsApril was the scale-in zone:
Back in April, the US stock market flashed a split-entry buy signal—a classic zone for gradual accumulation.
That same setup applied to Bitcoin. Buying the fear worked again.
We’ve moved out of the fear zone:
Both Bitcoin and equities have left the extreme fear territory behind. Sentiment has shifted.
Short-term overbought now:
Bitcoin is currently in a short-term overbought phase. Some consolidation or cooling off is natural here, but no major trend reversal signs yet.
Stay heavy on positions:
I’m maintaining an overweight position in Bitcoin as long as the US stock market stays intact. The Nasdaq is holding up, so Bitcoin likely stays in risk-on mode.
Warning:
If US equities take a hit, expect Bitcoin to follow.
Negative moves in the stock market will likely translate directly into crypto weakness.
The Final Turn Before the Altcoin RotationAs Bitcoin continued its rise, altcoins couldn't keep up. This isn't the first time; the market has experienced this many times. The general pattern is as follows:
1. Global liquidity increases, providing a kind of spark to the market.
2. Bitcoin catches fire, and a bull market begins. If global liquidity increases during this time, great.
3. For various reasons, altcoins don't rise at the same pace as Bitcoin, and therefore Bitcoin's dominance begins to gradually increase.
4. When the market reaches saturation, dominance declines, leading to a rotation into altcoins.
5. The altcoin market capitalization equals Bitcoin's, and the bull market begins.
We're currently at a stage where Bitcoin's dominance has peaked and liquidity is still rising. The beginning of a decline in dominance will trigger a market rotation. This will trigger a capital flow into altcoins, bringing their market value equal to Bitcoin's.
Therefore, we're at the final plateau before entering a bull market. A further rise or hold in Bitcoin is expected. I'm currently buying altcoins, but I'm holding Bitcoin. I don't have a sell mindset at the moment.
Bitcoin -> The bullrun is not over!📣Bitcoin ( CRYPTO:BTCUSD ) is still totally bullish:
🔎Analysis summary:
A couple of months ago Bitcoin broke above the previous all time high. This was basically just the expected creation of new highs, perfectly following the underlying cycles. With respect to the long term rising channel formation, this bullrun on Bitcoin is just starting.
📝Levels to watch:
$100.000
🙏🏻#LONGTERMVISION
Philip - Swing Trader

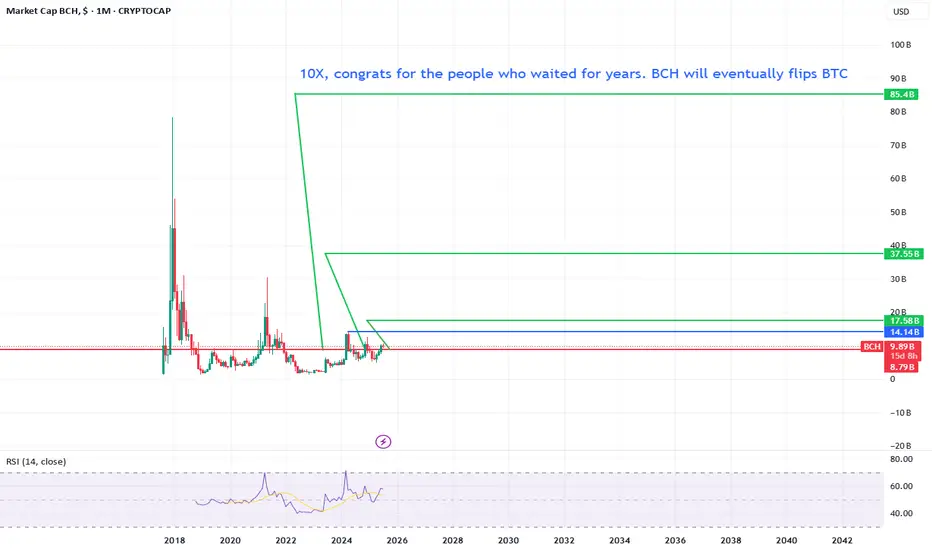
Bitcoin Cash will do a solid 10X For years bitcoin cash is been selling off.
But let me tell you this, we are just getting started.
If we pass the blue line we are officially triggered for a 85 billion marketcap.
Can still take some time but eventually it will happen. Make sure to fomo in when the party is starting!
[UPD] BTC / ETH / XRP / SOL / HYPE and other alt and mem-coins A new video update with insights on the intermediate trend structure with key support and resistance zones to keep on radar in the coming sessions
Coins discussed in the video: CRYPTOCAP:BTC / CRYPTOCAP:ETH / CRYPTOCAP:XRP / GETTEX:HYPE / CRYPTOCAP:SOL / CRYPTOCAP:LINK / CRYPTOCAP:SUI / $BRETT / SEED_DONKEYDAN_MARKET_CAP:FLOKI and others
Hope this is helpful in guiding you through the crypto market. Thank you for your attention and I wish you successful trading decisions!
If you’d like to hear my take on any other coin you’re tracking - feel free to ask in the comments (just don’t forget to boost the idea first 😉).

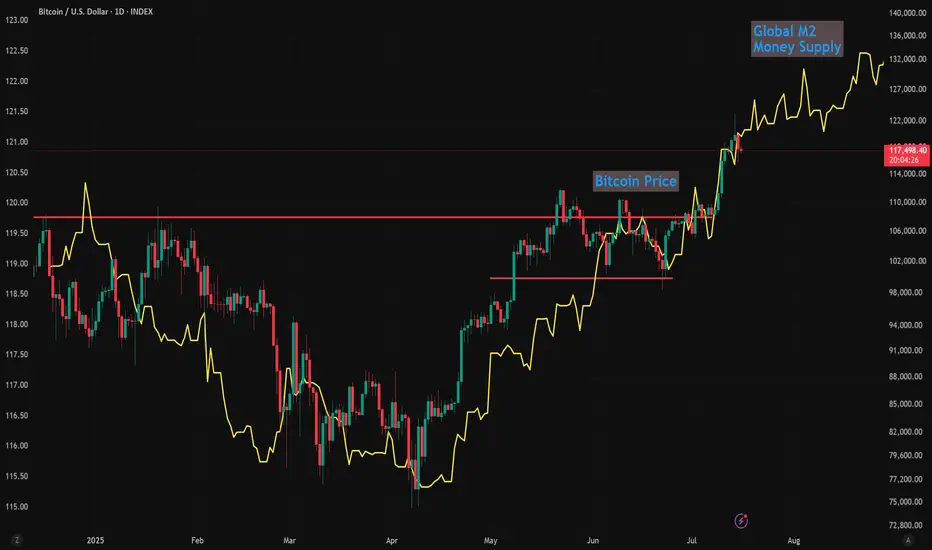
Global M2 Money Supply (70/84/90 Day offset) and $150k BTCI'm using Global M2 slightlty different than most here, and showing it behaves differently during different periods of the cycle.
Many people say M2 leads Bitcoin by 10-12 weeks (70 - 84 Days) and I've seen periods where it does... But in this phase of the bull-run 90 days is working best.
We can see the dip in M2 around now coinciding with the drop in Bitcoin prices.
Of course, these are not directly correlated and can't be relied upon as predictive.
But it's following pretty close, and overall looks great for further upside!
I'll follow up with a video on this if anybody is interested.
#BTC Update #7 – July 15, 2025#BTC Update #7 – July 15, 2025
Bitcoin is currently within the consolidation zone where it previously paused during its last upward move. From this zone, it had previously bounced and created a new all-time high. It is now undergoing a correction, and the level it has reached aligns with the 0.382 Fibonacci retracement, which is perfectly normal for a first stop in a correction.
If the correction continues, the second stop could be around $114,795, and the third around $113,012. If it reaches these levels, it will have filled at least half of the imbalance created during the previous rally.
Looking at the volume, I anticipate that Bitcoin might start to bounce from this level. If it manages to break above the $122,666 zone, the next target would be around $127,172.
I do not plan to buy Bitcoin here unless I see a high-volume green candle. However, if Bitcoin breaks above the $118,900 level with strong volume, a long position might be considered, as the target would likely shift toward the $127,000 range.
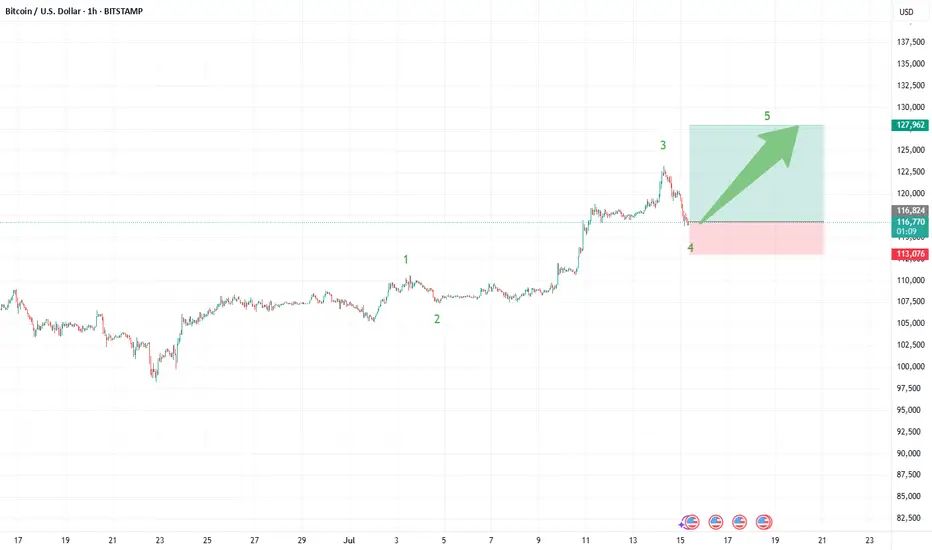
Bitcoin (BTCUSDT): Trade Wave 5—Next Stop $127,000?Bitcoin’s current structure is lining up for a classic Elliott Wave fifth wave scenario, and the setup could offer a high-reward trade as we look for a measured push toward the $127,000 area. Here’s what’s standing out in the recent price action:
What the Current Structure Shows (Primary Scenario)
Wave 4 Correction Complete: After peaking in wave iii near $124,000, BTC pulled back and has potentially completed a wave iv correction. Price respected the Fibonacci retracement zones bouncing near the 38.2% retracement at $117,116.
Preparing for Wave 5: With support confirmed, price action is stabilizing and looks primed for a final motive push—wave 5—to the upside. The target projection for wave 5 is around $127,000, in line with both the 61.8% extension of the previous swing and the common equality projection for wave 5 vs. wave 1 when wave 3 is extended.
Why the Count Is Labeled This Way
The advance from early July kicked off with impulsive movement, subdividing cleanly into smaller waves that align with classic Elliott structure.
Wave iii is the clear standout—steep, extended, and carrying most of the move’s energy, which checks the box for a strong third wave.
The cluster of Fibonacci and previous resistance/support near $127,000 offers strong technical confluence for the next objective.
Trade Setup: Riding Wave 5 to $127,000
Entry Zone: Consider longs on breakouts above the current consolidation, ideally after confirmation of support holding near $117,100–$116,000.
Stop Loss: Place stops just below $113,300 (the 61.8% retracement), or tighter for risk management depending on your position size and timeframe.
Target: $127,000—where wave 5 projects to equal the length of wave 1 and aligns with multiple Fibonacci targets.
What to Watch Next (Confirmation or Invalidation)
Confirmation: An impulsive move above the interim high at $120,000–$121,000 with strong volume would confirm wave 5 is underway and that bulls have regained control.
Invalidation: A break below $110,500 would invalidate this setup and suggest a more complex correction is taking shape.
Final Steps: Monitor for impulsive character in the rally—wave 5s can sometimes truncate, so don’t get complacent at resistance.
Alternate Count
If price fails to hold support and breaks down, BTC could still be in an extended or complex fourth-wave correction—possibly a running flat or triangle—before wave 5 eventually resumes.