symmetrical triangle in progressBitcoin has been consolidating at this level for several weeks, easing some of the pressure in order to push above 120K. As of today, we have a clear formation—a large symmetrical triangle—which confirms the continuation of the upward trend and rules out any possibility of returning to lower levels.
Bitcoinlong
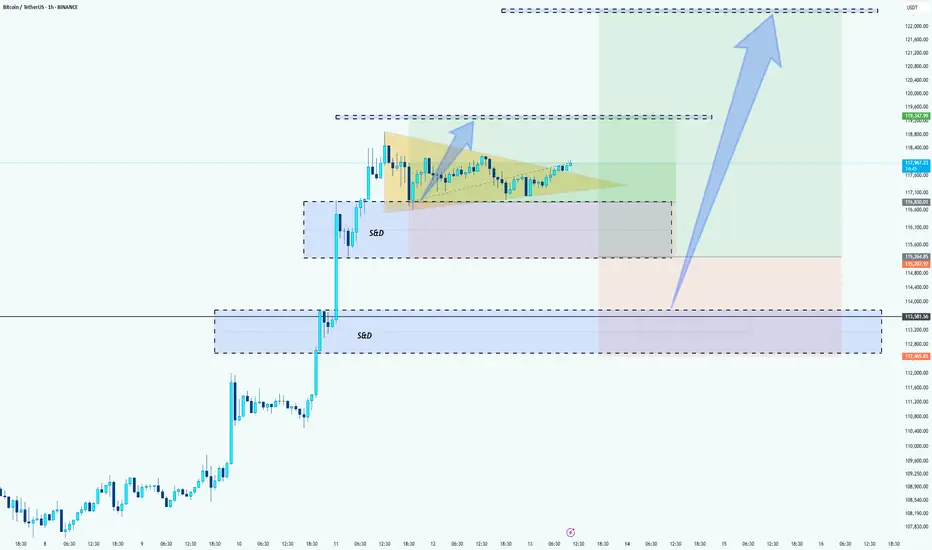
BTC Bullish Setup: Two Long Positions Aligned for ContinuationHello guys!
Bitcoin is currently in a strong uptrend, consolidating after a sharp move up. The chart highlights a textbook bullish continuation pattern (pennant/triangle), suggesting momentum is building for another leg up.
Attention:
This is not an either-or setups. Both long entries are valid and could trigger one after the other, offering layered opportunities for bulls.
1- First Long: Breakout from Bullish Pennant
Price is tightening inside a triangle after a strong impulse move.
A breakout above the resistance around $118K would confirm continuation.
Entry on the breakout targets the upper liquidity zone near $122K.
2- Second Long: Pullback to S&D Zone (around $115K)
If the breakout happens and then retraces, watch for price to revisit the S&D zone at $115,200–$115,800.
This area will act as support and provide a second long opportunity.
target: around $122k
BTC Weekly Update -as of Jul14🕰 Timeframe:
📆 Date:
🔎 Market Overview:
💼 Massive Institutional Inflows:
▪️ Over $1.1 billion in net capital inflows have entered spot Bitcoin ETFs in recent days, bringing the total weekly inflows to $2.72 billion so far.
▪️ The total assets under management (AUM) across all Bitcoin ETFs now exceed $150 billion, representing over 6% of Bitcoin’s total market capitalization.
⚖️ Favorable Political and Regulatory Support:
▪️ The ongoing Crypto Week in Congress is reviewing key legislative proposals like the Genius Act and the Clarity for Digital Assets Act, both of which offer promising regulatory clarity for the crypto industry.
▪️ Additionally, former President Trump’s executive order to establish a “Strategic Bitcoin Reserve” signals strong official political support for Bitcoin adoption.
📊 On-Chain & Sentiment Indicators
📦 Exchange Reserves:
Bitcoin reserves on centralized exchanges are at their lowest levels in years, suggesting a trend toward long-term holding (HODLing) and reduced selling pressure.
🧠 Fear & Greed Index:
The sentiment index remains firmly in the “Greed” zone, even hitting its highest level since May, indicating strong bullish sentiment among retail and institutional investors.
🌀 Whale Activity:
Whale wallets continue to show heavy accumulation, with large and steady transfers into private wallets, further supporting a bullish on-chain trend.
📈 Technical Setup
🔵Trend: Ranging upward
🔸 Key Support: 118,000➖ 115,000
🔸 Key Resistance: 125,000➖ 130,000
🔸 Indicators Used: RSI above 70
🧭 Next Week – Key Points
🔹 Watch for the outcomes of Crypto Week legislation in Washington — this will be a key driver for market direction.
🔹Monitor ETF capital inflows — if daily inflows stay above $500M, the bullish trend will likely strengthen.
🔹 Track the Federal Reserve's interest rate policy and the USD outlook, especially in response to inflation or other macroeconomic factors.
🔚 Summary: Final Analysis
📌 After reaching a new all-time high above $122K on July 14, Bitcoin’s bullish trend has strengthened. Strong institutional inflows and political support have reinforced the foundation for growth.
● Key Level Ahead: $125,000
● Outlook: If price consolidates above resistance, we could see a move toward $135K and beyond.
● Weekly Bias: Bullish, with potential for a pullback before continuation upward.
✅ If you like this analysis, don't forget to like 👍, follow 🧠, and share your thoughts below 💬!

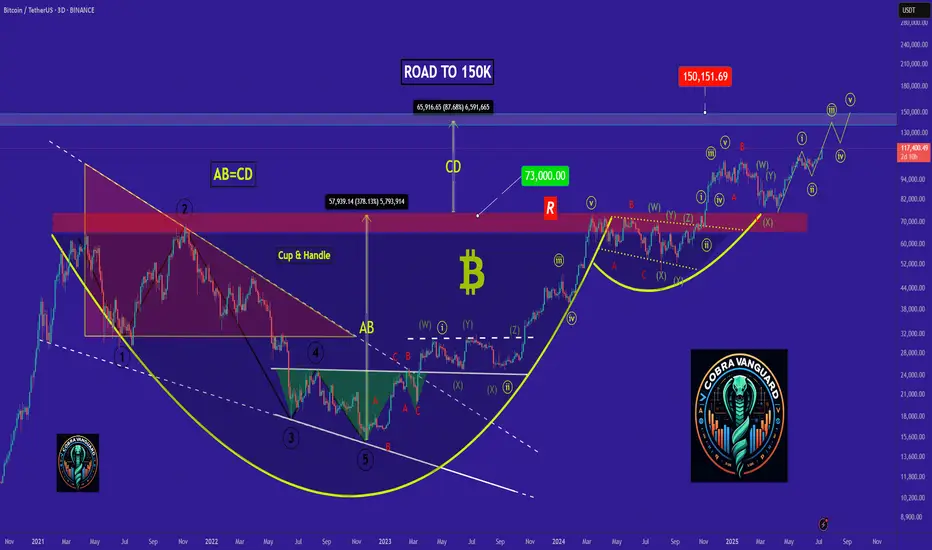
Are we on Super Bullish Express Highway ? Elliott Waves RoadmapHello friends,
Welcome to RK_Chaarts
Today we're attempting to analyze Bitcoin's chart, specifically the BTCUSD chart, from an Elliott Wave perspective. Looking at the monthly timeframe chart, which spans the entire lifetime of Bitcoin's data since 2011, we can see the overall structure. According to Elliott Wave theory, it appears that a large Super Cycle degree Wave (I) has completed, followed by a correction in the form of Super Cycle degree Wave (II), marked in blue.
Now, friends, it's possible that we're unfolding Super Cycle degree Wave (III), which should have five sub-divisions - in red I, II, III, IV, & V. We can see that we've completed red I & II, and red III has just started. If the low we marked in red II doesn't get breached on the lower side, it can be considered our invalidation level.
Next, within red III, we should see five primary degree sub-divisions in black - ((1)), ((2)), ((3)), ((4)) & ((5)). We can see that we've completed black ((1)) & ((2)) and black ((3)) has just started. Within black ((3)), we should see five intermediate degree sub-divisions in blue - (1) to (5). Blue (1) has just started, and within blue one, we've already seen red 1 & 2 completed, and red 3 is in progress.
So, we're currently in a super bullish scenario, a third of a third of a third. Yes, the chart looks extremely bullish. We won't commit to any targets here as this is for educational purposes only. The analysis suggests potential targets could be very high, above $150,000 or $200,000, if the invalidation level of $98,240 isn't breached. But again, friends, this video is shared for educational purposes only.
Many people think that the market doesn't move according to Elliott Waves. But friends, here we've tried to analyze from the monthly time frame to the overly time frame. We've definitely aligned the multi-time frame and also aligned it with the principal rules of Elliott Waves, without violating any of its rules.
I agree that the Elliott Wave theory can be a bit difficult, and for those who don't practice it deeply, it can be challenging. But yes, the market moves according to this methodology, following this pattern. This is a significant achievement.
I am not Sebi registered analyst.
My studies are for educational purpose only.
Please Consult your financial advisor before trading or investing.
I am not responsible for any kinds of your profits and your losses.
Most investors treat trading as a hobby because they have a full-time job doing something else.
However, If you treat trading like a business, it will pay you like a business.
If you treat like a hobby, hobbies don't pay, they cost you...!
Hope this post is helpful to community
Thanks
RK💕
Disclaimer and Risk Warning.
The analysis and discussion provided on in.tradingview.com is intended for educational purposes only and should not be relied upon for trading decisions. RK_Chaarts is not an investment adviser and the information provided here should not be taken as professional investment advice. Before buying or selling any investments, securities, or precious metals, it is recommended that you conduct your own due diligence. RK_Chaarts does not share in your profits and will not take responsibility for any losses you may incur. So Please Consult your financial advisor before trading or investing.

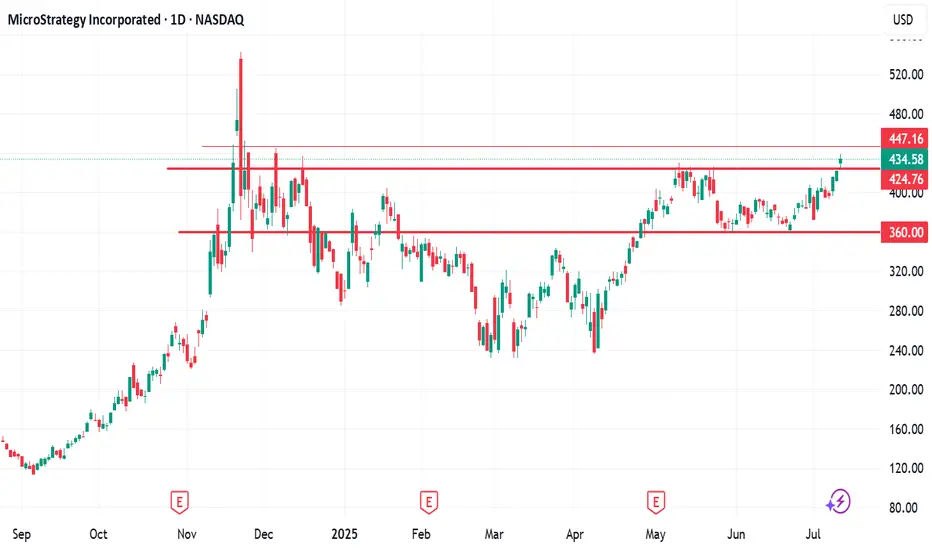
MSTR stock has seen a strong rally since JuneSince June, MSTR stock has seen a strong rally—rising from the mid‑$300s to above $430—driven by a few key factors:
Bitcoin’s continued ascent has fueled sentiment. Bitcoin recently hit fresh record highs (above $118K), driven by a weakening dollar and bullish macro trends, which in turn boosted bitcoin-linked equities like MicroStrategy.
In short, MSTR’s rally since June has been largely Bitcoin-driven: a powerful combination of rising crypto prices, ongoing BTC purchases, proactive capital raises, and positive analyst sentiment creating a bullish feedback loop.
Let me know if you'd like a breakdown of Bitcoin’s trend or deeper insight on MSTR’s financing strategy.
$447 will be my next buy TP.
Please, share your thought, like, share and follow me.
bitcoin - Time to buy again!As I mentioned, the price has started the third bullish wave and has shown good growth so far, with the bullish wave still ongoing. In my opinion, the price could rise to $127k, after which it may correct to form the fourth corrective wave.
previous analysis
BTCUSDT[BITCOIN]:Price is Likely to be Heading Towards $144,000.Recently, Bitcoin has shown extreme bullish price behaviour, and there’s no sign of bearish influence in the market. After monitoring the price since May 4th, we believe there’s a high possibility of price hitting the 120k region first. This could be followed by a small correction around 105k, where a strong bullish price influence will lead the price to our final target at 140k. Both fundamental and technical factors support this view, but it doesn’t guarantee the price will follow our expectations.
Before investing or trading cryptocurrencies, do your own research as they carry significant financial risk. This chart analysis is for educational or secondary purposes only.
Good luck and trade safely.
If you want to support and encourage us, you can do the following: ❤️
-Like the idea
-Comment the idea
-Share ;)
Team Setupsfx_

#BITCOIN: Accumulated Volume, Time For $150,000Bitcoin has accumulated nicely, but we don’t expect the price to distribute strongly towards $150k. We have set two targets: 125k and a swing target at 150k. Remember to have a confirmation before entering.
Good luck and trade safely,
Team Setupsfx_

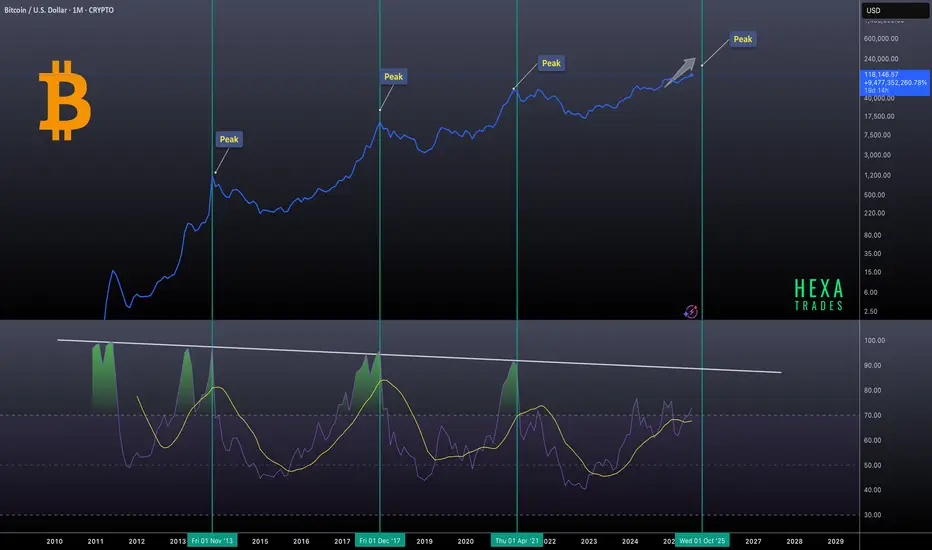
Bitcoin Macro Cycles: Sell Signal at RSI 90Bitcoin’s historical market cycles, using monthly RSI data to identify previous bull market peaks. Notable tops in 2013, 2017, and 2021 are highlighted, with the next potential peak projected around October 2025. A consistent pattern emerges where each market top aligns with the monthly RSI reaching or nearing the 90 level, indicating extremely overbought conditions.
Sell when the monthly RSI hits 90. This has consistently marked previous market tops and can serve as a reliable signal for long-term investors.
Prepare for the 2025 Crypto Summer as Bitcoin Shatters RecordBitcoin Experiences Impact of a $12B Short Squeeze: Here is How to Prepare for Imminent Crypto Summer
July 12, 2025 - The digital asset landscape has been irrevocably altered. In a move that will be etched into financial history, Bitcoin has shattered its previous all-time highs, surging with a ferocity that has left bears in utter ruin and bulls in a state of euphoric disbelief. After decisively breaking the formidable $109,000 barrier, the world’s premier cryptocurrency rocketed past $118,000, liquidating an estimated $12 billion in leveraged short positions in a cascade of forced buy-ins that added jet fuel to an already roaring fire.
This is not just another bull run. This is the manifestation of a market that has fundamentally matured. The "Crypto Summer" of 2025, long whispered about in investor circles, has arrived, and it is being majorly fueled by an unprecedented influx of institutional capital and a newly established clear regulatory outlook. While the price charts paint a picture of blistering gains, the underlying story is one of a structural shift in the global financial order.
For those who have watched from the sidelines, the question is no longer if they should pay attention, but how they can possibly prepare for the seismic shifts to come. This article will dissect the anatomy of this historic market event, explore the powerful forces driving this new paradigm, and offer a guide to navigating the thrilling, albeit treacherous, terrain of the 2025 Crypto Summer.
Part 1: The Anatomy of a $12 Billion Cataclysm
To comprehend the sheer violence of Bitcoin's recent ascent, one must first understand the market dynamics that preceded it. A short squeeze is a market phenomenon that occurs when a heavily shorted asset experiences a rapid price increase. This forces traders who bet on a price drop (short sellers) to buy back the asset to cover their positions and cut their losses. This sudden surge in buying demand creates a feedback loop, pushing the price even higher and liquidating more short positions along the way.
In the weeks leading up to the breakout, a palpable sense of bearishness had settled among many derivative traders. They saw the price range between $100,000 and $110,000 as a formidable distribution zone—a ceiling where bulls would run out of steam. Emboldened by this conviction, they began to build massive short positions. It's estimated that prior to Bitcoin’s bullish breakout above $109k, short traders had accumulated around $12B in leveraged positions, with many of these bets entered around the $118k level, anticipating a strong rejection from that point.
The trap was set. But it was the bears, not the bulls, who were about to be caught.
The initial catalyst was the clean break above the $109,000 resistance. This was followed by a swift move above a key bearish trend line that had formed on shorter timeframes, with resistance at $111,000. As the price then confidently reclaimed the $112,500 zone and began trading above the 100-hourly Simple Moving Average, the first wave of liquidations began.
What followed was a textbook short squeeze of epic proportions. As automated margin calls were triggered, computer algorithms began to market-buy Bitcoin at any price to close the losing short positions. This forced buying pressure propelled BTC through $113,000, then $114,000, and $115,000 in what felt like mere moments. The higher the price went, the more short sellers were forced to capitulate. The $12 billion in leveraged positions, once a wall of sell-side pressure, became a colossal wave of buy-side demand. The price action culminated in a spectacular surge past $116,000 and eventually screaming past $118,800, leaving market commentators and traders alike breathless. This event was a brutal lesson in the inherent risks of shorting a structurally bullish asset in a high-leverage environment.
Part 2: A New Paradigm: Institutional Capital and Regulatory Clarity
While the short squeeze provided the explosive catalyst, the true engine of this bull market is fundamentally different from those of the past. The frenzied, retail-driven manias of 2017 and 2021 have been replaced by a more deliberate, capital-heavy, and institutionally-led advance. The "Crypto Summer" of 2025 is built on the bedrock of legitimacy that only Wall Street and a clear regulatory stance could provide.
The ETF Revolution Matures
The launch of spot Bitcoin ETFs in early 2024 was a watershed moment, but 2025 is the year their impact has become undeniably dominant. These regulated financial products have provided a secure and familiar bridge for institutional investors, hedge funds, and even sovereign wealth funds to gain exposure to Bitcoin. The results have been staggering. In a clear sign of a changing of the guard in the world of alternative assets, spot Bitcoin ETFs have captured an astonishing 70% of gold’s inflows in 2025.
This statistic is more than just a headline; it represents the tangible manifestation of the "digital gold" narrative. For years, proponents have argued that Bitcoin's provable scarcity and decentralized nature make it a superior store of value to the yellow metal. Now, the flow of funds from the world's largest asset managers is proving this thesis correct. BlackRock’s IBIT, in particular, has shattered ETF records, becoming one of the fastest-growing funds in history and signaling to the entire financial establishment that Bitcoin is no longer a fringe asset but a core portfolio component.
The Certainty of Regulation
For years, the spectre of regulatory uncertainty has cast a long shadow over the crypto markets, deterring conservative institutional players. A key driver of the 2025 bull market has been the emergence of a clear regulatory outlook in major jurisdictions like the United States and Europe. With comprehensive market structure bills passed, clear guidelines on custody, and a defined tax framework, the biggest obstacle for institutional adoption has been removed.
This regulatory clarity has done more than just open the floodgates for capital; it has legitimized the entire asset class. Institutions operate on long-term horizons and require predictable rules of engagement. With these in place, they are no longer making a speculative bet but a strategic allocation to a new, globally recognized asset class. This influx of what is often called "stickier" capital—long-term investment rather than short-term speculation—is helping to build a more stable market foundation and reduce some of the notorious volatility associated with Bitcoin.
Part 3: Reading the Charts and Chains
The story of this bull run is written not only in the headlines but also in the data. A confluence of technical chart patterns, on-chain analytics, and market sentiment indicators paints a uniquely bullish picture, suggesting that this rally may have much further to run.
Technical Analysis: Echoes of the Past, Pointers to the Future
For seasoned market observers, the BTC price action in 2025 has mirrored the 2017 macro bullish breakout. The fractal nature of Bitcoin's four-year cycles, often centered around its programmatic "halving" events, appears to be playing out once again. The structure of the consolidation below $100,000 and the subsequent explosive breakout bears a striking resemblance to the patterns that preceded the parabolic run to $20,000 in 2017.
On a more granular level, the price has decisively conquered several key technical levels. The break above the bearish trend line at $111,000 was a critical signal that the downtrend pressure had been absorbed. Now, with the price trading firmly above $113,500 and the 100-hourly Simple Moving Average, these former resistance zones are expected to act as strong support levels for any potential pullbacks. The next major hurdle appears to be the $116,800 resistance zone, a level that, if cleared, could open the door to a much larger upward expansion.
Perhaps the most tantalizing model for predicting the cycle top is the Bitcoin "power law" model. This model suggests that Bitcoin's price growth over time follows a predictable exponential path when plotted on a logarithmic scale. Developed by analyst Giovanni Santostasi, the model views Bitcoin's long-term growth not as a random walk but as a structured, measurable trajectory akin to natural growth phenomena. According to analysts applying this model, Bitcoin is currently trading ahead of its long-term power law curve. Historically, this has been a sign that the market is entering the final, euphoric phase of its bull cycle. Based on this model, some analysts believe a Bitcoin Christmas rally to $200K or even $300K is possible, with the parabolic rally potentially lasting until the end of the year.
On-Chain Analysis: A Supply Shock in the Making
On-chain analysis, which involves examining data directly from the blockchain, provides a transparent view of investor behavior. One of the most encouraging signs for this rally is that Bitcoin Supply On Exchanges Remain Low Amid Latest Milestone. When investors move their BTC off exchanges, it is typically to place them in secure, self-custody wallets for long-term holding. This reduces the immediately available supply that can be sold on the market, creating a "supply shock" dynamic where even a small increase in demand can have an outsized impact on price. The current trend indicates that new institutional buyers and long-term believers are accumulating coins and have no intention of selling at current prices.
Further bolstering the bullish case is the metric of profitability. The market has reached a point where Bitcoin has broken records with 100% profitable days and unmatched returns. This means that for a vast majority of its history, buying and holding Bitcoin has been a profitable endeavor, reinforcing its narrative as one of an incredibly successful long-term asset.
However, a note of caution comes from on-chain analytics firm Glassnode, which warns that despite the breakout to over $118,000, liquidity is still thin. This means the order books on exchanges are not particularly deep. While this can amplify moves to the upside, it also means that a large sell order could cause a sharp and swift correction. This thin liquidity explains the continued volatility and serves as a reminder that the market, while more mature, is still susceptible to violent price swings.
Sentiment Analysis: A Rally Without the Mania
Perhaps the most compelling argument for further upside potential is what is absent from this rally: hype. In previous cycle tops, the market was characterized by a palpable mania. Bitcoin dominated mainstream news, celebrity endorsements were rampant, and stories of overnight crypto millionaires were inescapable.
This time is different. In a sign that suggests significant further upside potential, the current Bitcoin All-Time High Lacks Hype. Google Trends for "Bitcoin" are not at their peak, social media is not yet in a state of collective FOMO (Fear Of Missing Out), and the general public is not yet clamoring to get in. This suggests that the rally so far has been driven by the "smart money" of institutions. The retail-driven "mania phase," which typically marks the final blow-off top of a bull cycle, has not yet begun. This quiet confidence, devoid of irrational exuberance, is seen by many analysts as one of the healthiest indicators for the market's future.
Part 4: The Macroeconomic Tailwinds
A key factor is the falling dollar and anticipated Federal Reserve interest rate cuts. The US Dollar Index (DXY), which measures the greenback against a basket of foreign currencies, has been in a significant downtrend throughout 2025, hitting its lowest levels in over two decades relative to its moving averages. There is a historically strong inverse correlation between the DXY and Bitcoin; a weaker dollar makes assets priced in dollars, like BTC, more attractive to foreign investors and also pushes domestic investors to seek hedges against currency debasement.
Furthermore, the anticipation of interest rate cuts by the Federal Reserve to stimulate a slowing economy makes holding cash and low-yielding government bonds less attractive. This monetary policy shift encourages a "risk-on" environment, where capital flows out of safe-haven assets and into those with higher growth potential. As the ultimate digital risk-on asset, Bitcoin stands as a major beneficiary of this capital rotation.
The magnitude of this rally has also had fascinating side effects, such as the fact that the Bitcoin Surge Pushes Satoshi Nakamoto Into Global Top 15 Rich List. Based on the estimated 1.1 million BTC held by Bitcoin's pseudonymous creator, the recent price surge would place their net worth among the wealthiest individuals on the planet—a testament to the incredible value creation of this new technology.
Part 5: How to Prepare for the Imminent Crypto Summer
With a potential parabolic rally to $200,000 or $300,000 on the horizon, the central question for every investor is how to position themselves. The answer depends heavily on one's experience and risk tolerance. (This section is for informational purposes and should not be construed as financial advice).
For the Newcomer:
1. Education Before Allocation: Before investing a single dollar, take the time to understand what Bitcoin is. Learn about its core principles of decentralization, scarcity, and self-custody. Do not simply buy based on FOMO.
2. Dollar-Cost Averaging (DCA): Entering a market that is already in a parabolic uptrend can be risky. DCA involves investing a fixed amount of money at regular intervals, regardless of the price. This strategy reduces the risk of buying the top and smooths out your average entry price over time.
3. ETFs vs. Self-Custody: For the first time, investors have a simple choice. Buying a spot Bitcoin ETF through a traditional brokerage account is easy and secure. However, the core ethos of Bitcoin is self-sovereignty ("not your keys, not your coins"). Learning to use a hardware wallet to take self-custody of your coins is the ultimate way to embrace the technology, but it comes with greater personal responsibility.
For the Experienced Investor:
1. Prudent Risk Management: The warning of thin liquidity should be heeded. Volatility will remain high. Use stop-losses to protect capital, avoid excessive leverage, and do not get caught up in the euphoria. Have a clear plan for both entry and exit points.
2. Develop a Profit-Taking Strategy: No asset goes up forever. It is crucial to have a plan for taking profits. This could involve selling a certain percentage of your holdings at pre-determined price targets (e.g., $150k, $200k, $250k) or using technical indicators to signal a potential market top.
3. Look Beyond Bitcoin: Historically, a major Bitcoin rally paves the way for a subsequent "alt-season." As Bitcoin's dominance peaks, capital often rotates into Ethereum and other alternative cryptocurrencies with strong fundamentals, leading to explosive gains in those assets. Researching promising projects now could position you for the next phase of the crypto summer.
Finally, it is essential to address the question: Breakout Or Brutal Bull Trap? While all signs point to a sustained, institutionally-backed bull market, the risk of sharp corrections remains. Parabolic advances are often followed by equally dramatic pullbacks. The thin liquidity could exacerbate such a move. Staying grounded, managing risk, and sticking to a well-defined plan are the keys to surviving and thriving.
Conclusion
The Bitcoin story of 2025 is a symphony of powerful forces playing in perfect harmony. The violent crescendo of a $12 billion short squeeze announced its arrival, but the enduring melody is one of profound structural change. The unwavering commitment of institutional capital, flowing through newly approved and highly successful ETFs, has provided a stable and deep foundation for the market. This, combined with a clear regulatory framework and supportive macroeconomic tailwinds from a weakening dollar, has created the conditions for a historic "Crypto Summer."
Unlike the retail-driven manias of the past, this rally is characterized by a quiet confidence, a lack of widespread hype, and on-chain data that points to a severe supply shock. Models like the power law suggest that the journey is far from over, with potential targets that would have seemed fantastical just a year ago.
The road ahead will undoubtedly be volatile. But for those who understand the underlying dynamics at play—the institutional shift, the market structure, the on-chain truths—the path to navigating this new era is clear. The summer has just begun.
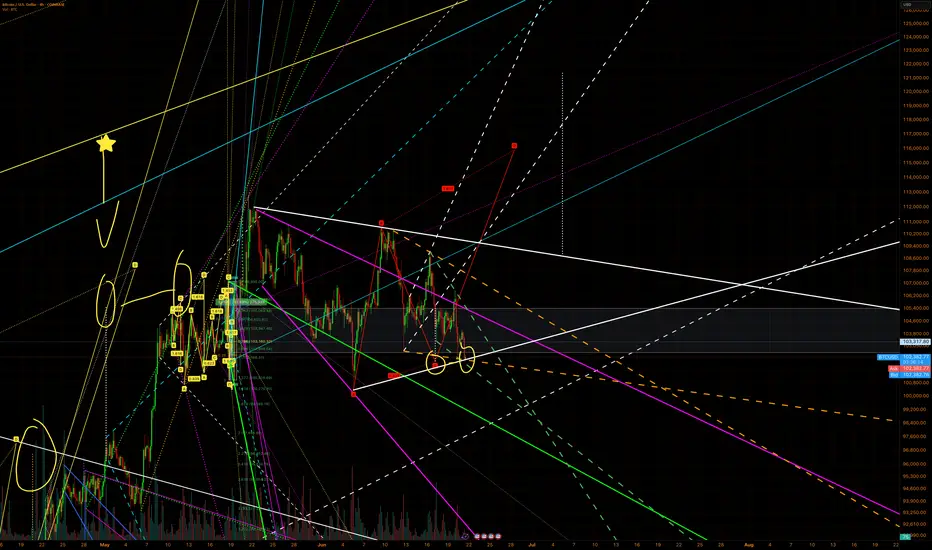
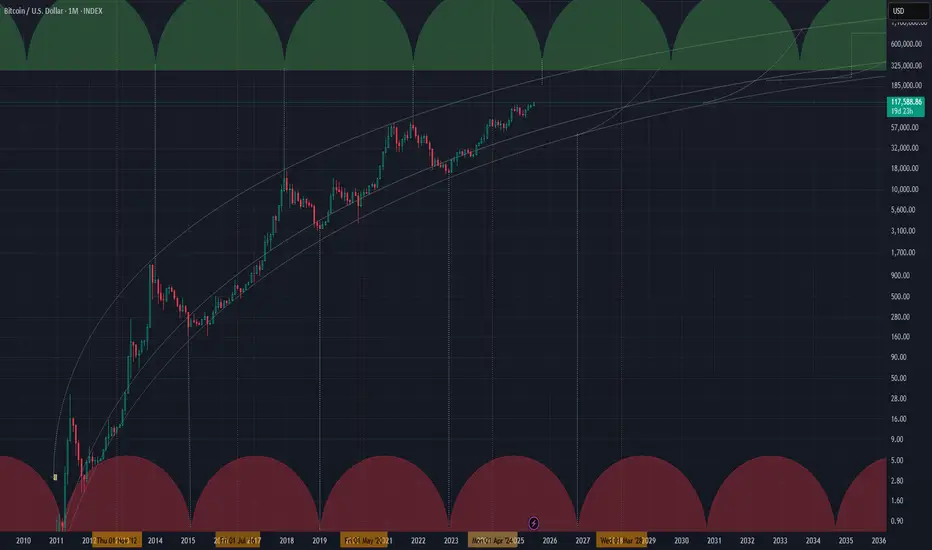
Cycle time tool sugesting topping prices around October 2025 As expected in previous analysis this idea support my thesis for topping close to October. i will be unloading soon to buy back around November 2026. Cheers!
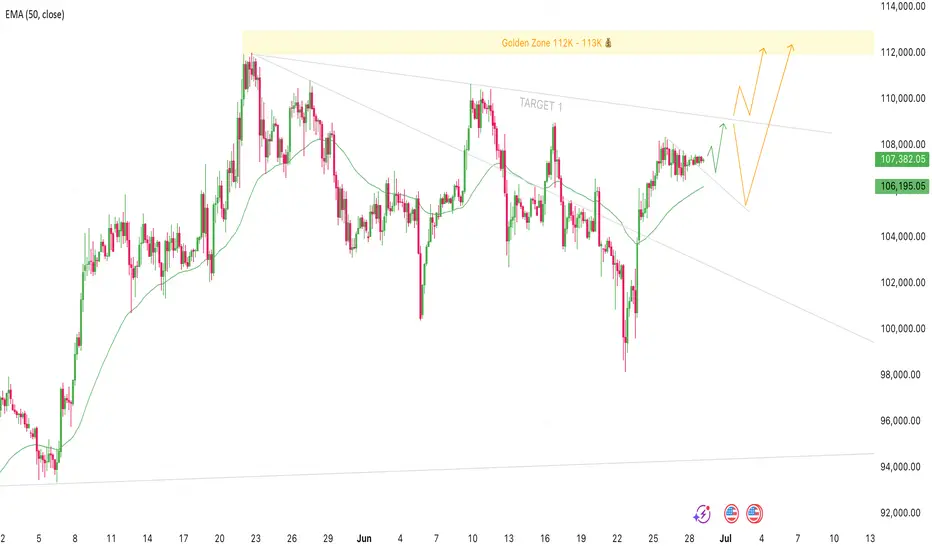
Bitcoin Setup for 109K and New Highs Could Be NextTrade Idea:
Direction: long
Entry: Now 107,350 - 106,800
Stop Loss: 102,000
Target 1: 109,000
Golden Zone: 112,000 - 113,000
Bitcoin has been consolidating for the last four days with no real price increase, but we’ve still managed to break above the short-term descending trend line. This could signal a continuation of the current swing up to the next resistance around 109K, which lines up with the daily trend line.
My bias here is that once we hit that 109K area, we could either see a pullback to around 104 to 106K before pushing higher, or we might break straight through, retest the trendline, and continue quickly to new highs above 112K.
I’ll be watching closely to see how price reacts around 109K, whether it rejects or breaks through. Either way the structure remains bullish, and if we get a rejection I'll be looking to re-enter.
Let's see how this plays out ✌️
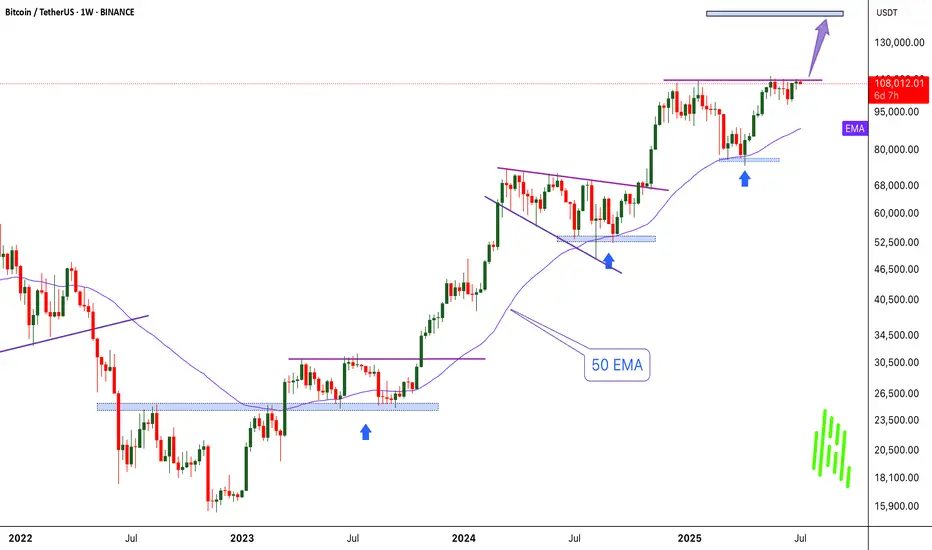
Bitcoin : Missed $100K? Don’t Miss What’s Coming Next!!MARKETSCOM:BITCOIN BINANCE:BTCUSDT continues to show exceptional strength and strong bullish momentum. When we look back at the charts from 2023 and 2024, a clear and reliable pattern stands out. Each time Bitcoin touched the 50 EMA on the weekly chart, it triggered a significant rally that led to new all-time highs. That same setup appears to be forming once again.
MARKETSCOM:BITCOIN tested the 50-week EMA around the $75,000 level and has since bounced with conviction. The price has reclaimed the $100,000 mark and is now challenging previous all-time high resistance. Historically, a successful bounce from this key moving average has not only signaled recovery but also sparked explosive upside moves.
Following this repeating pattern, the current cycle target is positioned at $150,000. A clean breakout above the current resistance zone could act as the trigger that launches Bitcoin into uncharted territory. The technical structure remains bullish, momentum is clearly accelerating, and the overall trend continues to favor the upside.
This moment represents a textbook Buy and HODL opportunity. Technical indicators are aligning, market sentiment is turning increasingly optimistic, and all signs suggest that Bitcoin could be preparing for another historic rally. Stay ready for what could be the next big move.
Follow Our Tradingview Account for More Technical Analysis Updates, | Like, Share and Comment Your thoughts
REDUSDT Forming Falling WedgeREDUSDT is attracting fresh eyes in the crypto community as this pair sets up for what could be a remarkable bullish move. The recent chart shows price action consolidating within a falling channel, hinting at a potential breakout scenario if the resistance trendline is successfully breached. With a strong volume profile backing this setup, REDUSDT is showing signs of healthy accumulation, suggesting that market participants are quietly building positions in anticipation of a trend reversal.
Many crypto traders are now closely watching REDUSDT because of its high-risk, high-reward potential, with an expected gain of 90% to 100%+. If the breakout confirms, the upside move could be sharp and decisive, driven by both technical momentum and fresh investor sentiment. This aligns with broader market conditions where investors are increasingly hunting for altcoins that can deliver outsized returns in a short period.
What makes REDUSDT even more compelling is the growing interest among investors in the underlying project and its ecosystem. A surge in community engagement and positive developments could serve as fundamental catalysts to sustain this projected bullish momentum. For traders, this setup could present a unique opportunity to catch an early trend before it gains mainstream attention.
✅ Show your support by hitting the like button and
✅ Leaving a comment below! (What is You opinion about this Coin)
Your feedback and engagement keep me inspired to share more insightful market analysis with you!

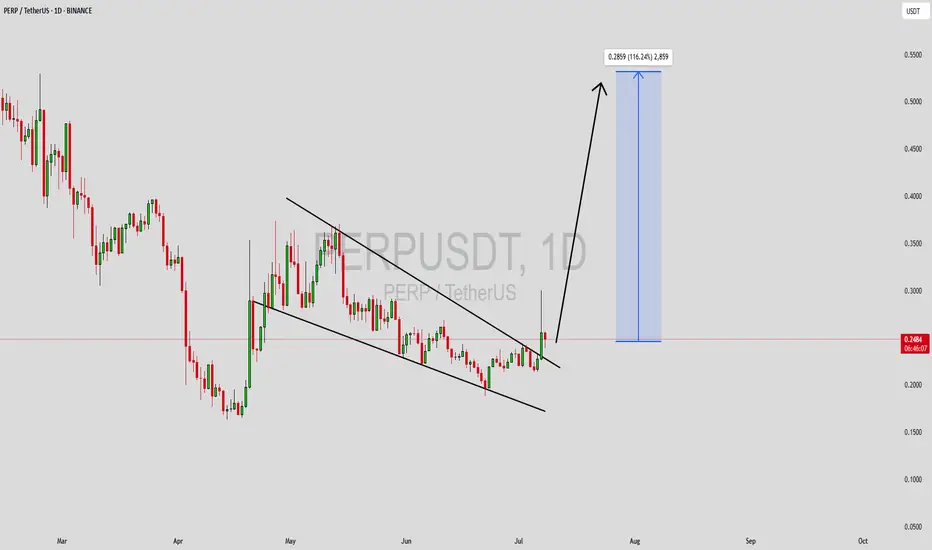
PREPUSDT Forming Falling WedgePREPUSDT is setting up for a promising move as it forms a textbook falling wedge pattern, a strong indicator that a bullish breakout could be imminent. Falling wedge patterns are known for signaling a shift in momentum from bearish to bullish, giving traders a clear opportunity to position themselves ahead of a potential uptrend. The structure of this pattern suggests that PREPUSDT could see gains in the range of 90% to 100%+, attracting significant attention from both swing traders and long-term investors.
The volume profile around this breakout setup has been encouraging, with increasing buying interest hinting at renewed market confidence in this project. Sustained or growing volume during a breakout typically validates the strength of the move, helping to prevent false breakouts and providing momentum for follow-through buying. With volume confirming the technical setup, the chances of a successful breakout look increasingly favorable.
Additionally, PREP’s underlying fundamentals and community support continue to evolve positively. With more investors recognizing its potential and actively accumulating positions, PREPUSDT stands out as a coin to watch closely in the current market cycle. As crypto sentiment improves and capital rotates into promising altcoins, projects like PREP with strong breakout patterns and growing investor interest can deliver remarkable returns.
✅ Show your support by hitting the like button and
✅ Leaving a comment below! (What is You opinion about this Coin)
Your feedback and engagement keep me inspired to share more insightful market analysis with you!
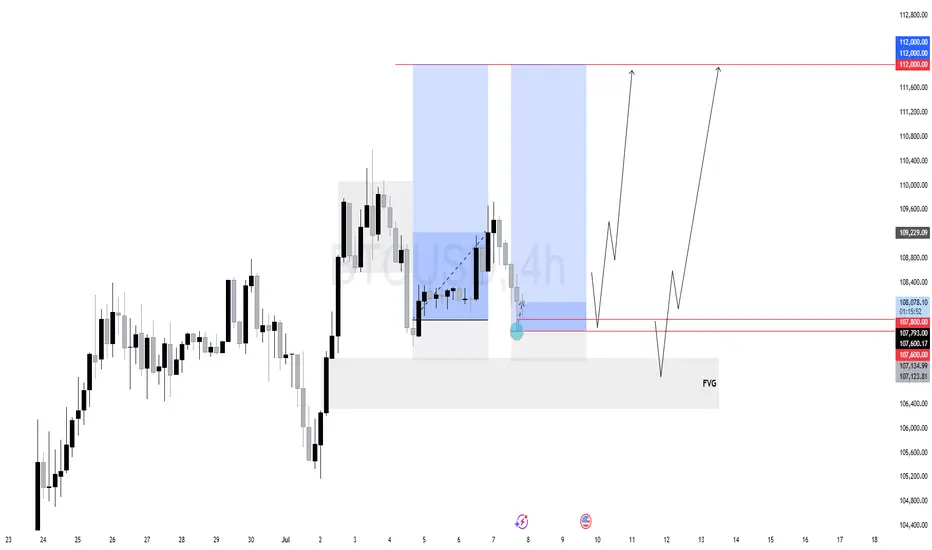
$BTC (BITCOIN) 4HPrice previously rallied strongly from a Fair Value Gap (FVG) at the bottom of the chart, forming a bullish market structure.
After a bullish displacement, BTC consolidated in a tight range (reaccumulation) and swept internal liquidity before breaking down.
Now, price has returned to a critical discount zone around 107800–107600
First Target: 109,229 — internal range high.
Main Objective: 112,000 — resting external liquidity above a clean high.
As long as BTC holds above 107600, we remain bullish. The current area is perfect for accumulation before a potential expansion phase toward external liquidity.
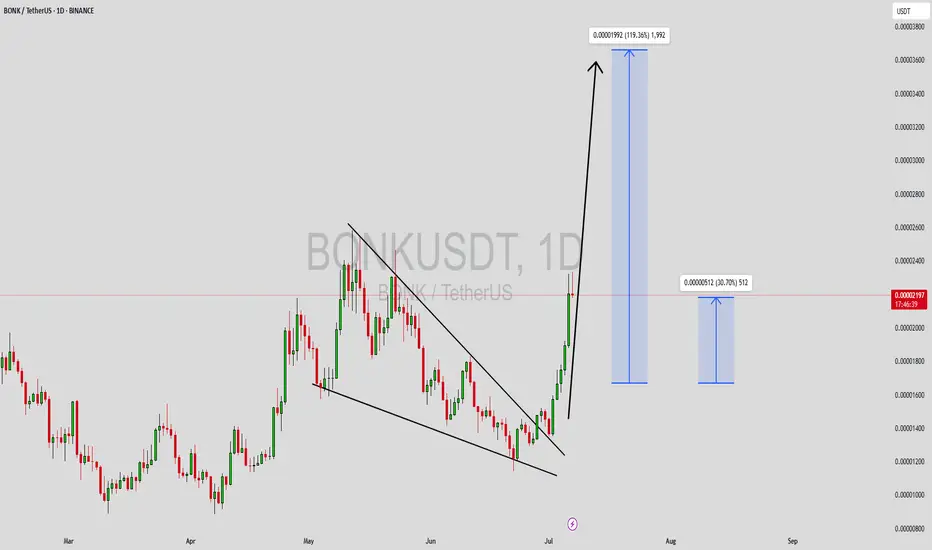
BONKUSDT Forming Descending TriangleBONKUSDT is rapidly emerging as a favorite among traders looking for high-growth meme coins with serious upside potential. This coin has recently shown strong price action, supported by healthy volume that signals growing investor confidence. The market sentiment around BONK has been increasingly bullish, and with current patterns aligning well with a potential breakout, traders are eyeing an impressive 90% to 100% gain from its current levels. Such explosive potential makes BONKUSDT one of the standout opportunities in the altcoin space right now.
As the crypto community continues to embrace meme coins, BONK has carved out a unique space with its vibrant community and strong social engagement. This coin’s popularity on social platforms is fueling its liquidity, and the recent accumulation phases suggest that smart money may be positioning for the next wave up. Technical traders should pay close attention to how BONKUSDT reacts at key resistance zones, as a confirmed breakout could open the door to a major rally in the coming weeks.
The technical structure shows BONKUSDT maintaining its trend above critical support levels while forming higher lows — a promising sign of sustained upward momentum. Traders are watching for a decisive move above recent swing highs to confirm the bullish continuation. With solid volume backing up these moves, there’s a strong chance that BONK will reward patient holders with substantial returns. Keep an eye out for breakout candles and spikes in trading volume as potential signals for entry.
✅ Show your support by hitting the like button and
✅ Leaving a comment below! (What is You opinion about this Coin)
Your feedback and engagement keep me inspired to share more insightful market analysis with you!
Bitcoin BTC Trade Plan: Watching for Breakout or Pullback Entry📊 Currently watching BTC (Bitcoin) as price action remains bullish overall, but we're approaching a key decision point 🎯
💹 Price is pushing higher, but with some signs of exhaustion after the recent rally ⚠️ — and with the weekend approaching, we could either see a continuation higher or a healthy pullback
I’m keeping an eye on two potential trade scenarios:
1️⃣ A break and clean retest of the recent high, which could offer a continuation long if momentum follows through 🚀
2️⃣ A retracement into equilibrium — a deeper pullback toward fair value 📉 — which could also present a high-probability long setup if confirmed with structure and reaction 📈
Either way, I’m letting the market reveal its hand and waiting for one of these setups to play out before committing 💡
💬 Not financial advice — always assess your own risk and confirm with your own analysis.

BTC: 650 Point Long Trade To 108,650$ (Date: Sat 05 Jul 25)High potential signal as my all signals. Don't miss this opportunity. At least open a trade in demo just to test.
Details:
Entry: Now - 108,100 $
Target Price: 108,650 $
Stop loss: 107,700 $
Trade Ideas:
There is a flag pattern here after a good down trend. So here is possibility for a small pull back till my target price.
Trade Signal:
I provide trade signals here so follow my account and you can check my previous analysis regarding BITCOIN. So don't miss trade opportunity so follow must.
BINANCE:BTCUSDT BINANCE:BTCUSDT.P BYBIT:BTCUSDT.P

FISUSDT Forming Bullish WaveFISUSDT is currently presenting an exciting opportunity for traders and investors who are tracking projects with strong breakout potential. The chart is showcasing a clear bullish wave pattern, a formation that often indicates an upcoming strong upward trend. This setup suggests that FIS could be gearing up for a significant move, and with the volume looking healthy, the momentum is likely to support this bullish scenario. Traders should closely watch key levels for a decisive breakout confirmation in the coming sessions.
What makes FISUSDT even more interesting is its fundamental backdrop. StaFi (FIS) is a well-known liquid staking protocol that continues to attract investors interested in maximizing yield while maintaining liquidity — a narrative that is regaining strength in the DeFi sector. As more market participants look for ways to unlock value from their staked assets, coins like FIS are well-positioned to benefit from renewed demand, which adds confidence to the projected 190% to 200% upside potential.
From a technical perspective, the recent higher lows and consistent wave structure show that buyers are stepping in at key support zones. A strong breakout above the current resistance area could trigger a new bullish impulse wave, accelerating gains and potentially drawing in fresh capital from traders seeking undervalued gems. Keeping an eye on daily closing candles and volume spikes will be key for confirming the breakout strength.
✅ Show your support by hitting the like button and
✅ Leaving a comment below! (What is You opinion about this Coin)
Your feedback and engagement keep me inspired to share more insightful market analysis with you!

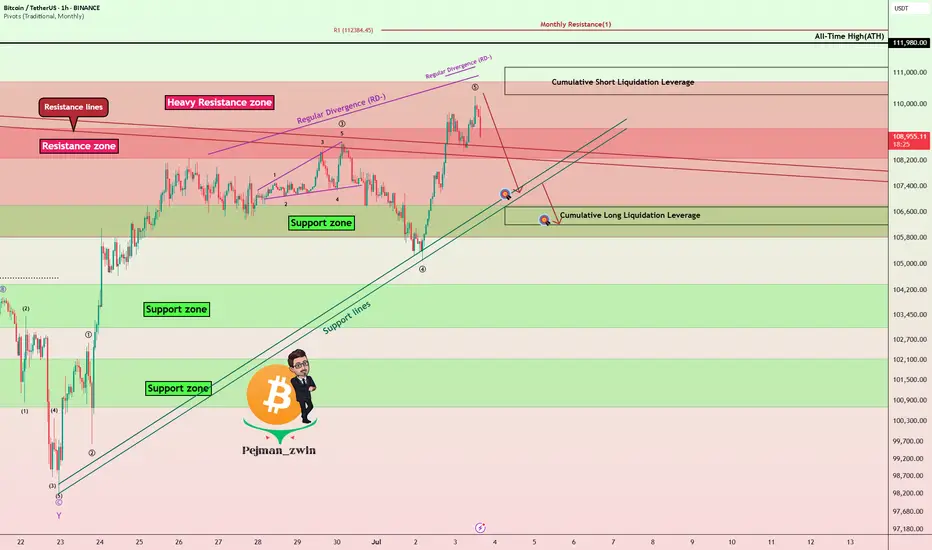
Bitcoin Roadmap => Short-termBitcoin ( BINANCE:BTCUSDT ) is moving above a Heavy Resistance zone($110,720-$105,820) , Cumulative Short Liquidation Leverage($110,300-$111,177) and is approaching All-Time High(ATH) .
Do you think Bitcoin will create a new All-Time High(ATH) in this rally?
In terms of Elliott Wave theory , Bitcoin's rise over the last two days appears to have been in the form of wave 5 .
Also, we can see the Regular Divergence(RD-) between Consecutive Peaks.
I expect Bitcoin to start declining in the coming hours. Targets are marked on the chart.
Cumulative Long Liquidation Leverage: $106,750-$106,202
Note: Stop Loss(SL)= $111,223
Please respect each other's ideas and express them politely if you agree or disagree.
Bitcoin Analyze (BTCUSDT), 1-hour time frame.
Be sure to follow the updated ideas.
Do not forget to put a Stop loss for your positions (For every position you want to open).
Please follow your strategy and updates; this is just my Idea, and I will gladly see your ideas in this post.
Please do not forget the ✅' like '✅ button 🙏😊 & Share it with your friends; thanks, and Trade safe.
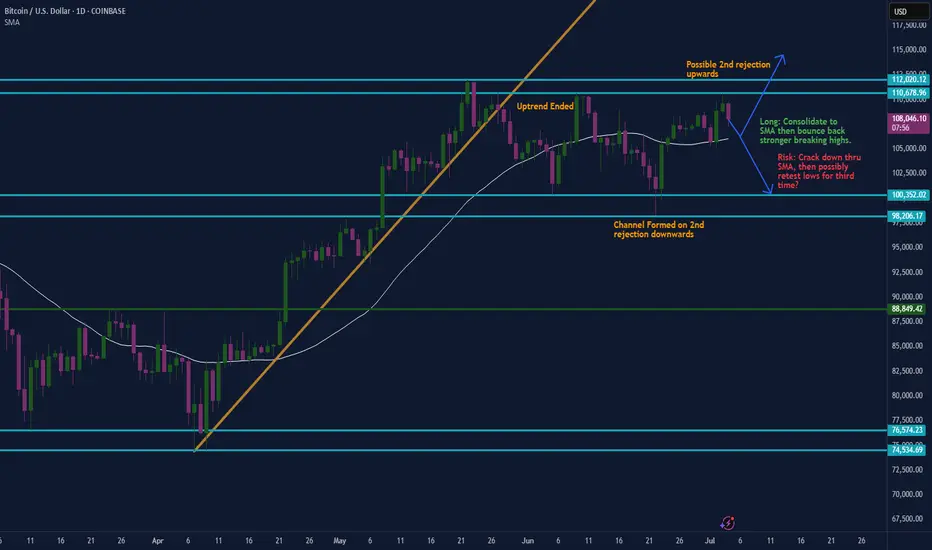
Are we still in an oscillator?Been over a month in this channel now. Now clear signs of breaking up or down. We are likely headed back to the 30 day SMA, and from there who knows. I tend to like the upside here being above the SMA, but we all know it can crack down and retest the lows yet again. I'm saying we retest the highs first.
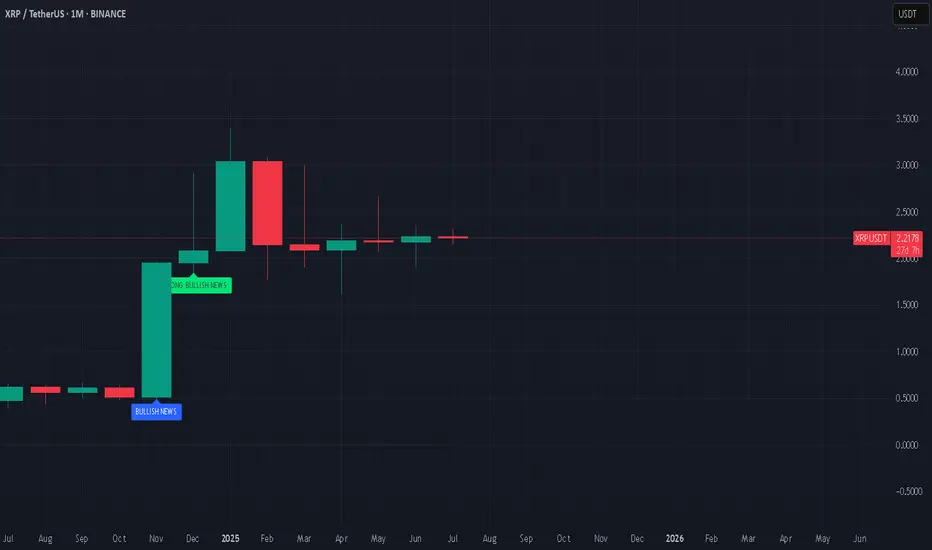
Will Ripple "leave a dent in the universe"?They called us crazy, when we bought xrp at the bottom, in the midst of court cases. What they don't see is that, many TODAY major companies that changed the world (e.g. Apple, Amazon, MSFT etc.) had long term court cases with the SEC before "leaving a dent in the universe". In our opinion, Ripple is next in line.
#xrp #crypto #bitcoin #ripple #banking #blockchain #finance #money #stablecoin #financialsystem