Whale Moves and Market Optimism: Potential Surge to $100,000Bitcoin continues to capture investors' attention with its price changes and large movements. Every rise and fall sparks more questions about its future and how it might affect the global economy.
Recently, Bitcoin was traded at a price of $65,715, experiencing a small increase of about 1% in the last 24 hours, which sparked some cautious optimism among cryptocurrency enthusiasts around the world.
This new confidence has been bolstered by the activity of major whales and long-term positive predictions. Some see this as an irreplaceable opportunity, while others warn against the danger of drifting behind illusions.
Bitcoin seems to be at a key point that could be a good chance to buy, based on current conditions and optimistic market predictions. The rise in activity from big investors and their large purchases of Bitcoin show they believe in the currency's future, which could signal positive market trends. Also, over 70% of all open Bitcoin positions on Binance are bullish.
A well-known crypto whale recently made headlines by buying 6,070 Bitcoin, worth about $395 million. This marks the whale's first major purchase in over 18 months. Renowned for strategic trading, this investor had previously acquired 41,000 Bitcoin during the 2022 market dip at an average price of $19,000 each.
In a smart move, the whale sold 37,000 Bitcoin during the market upturn in 2023 and 2024 for an average price of $46,800 each, earning a total of $1.74 billion and over $1 billion in profit. This recent purchase reflects the whale's renewed optimism in Bitcoin’s future, suggesting potential significant price increases ahead.
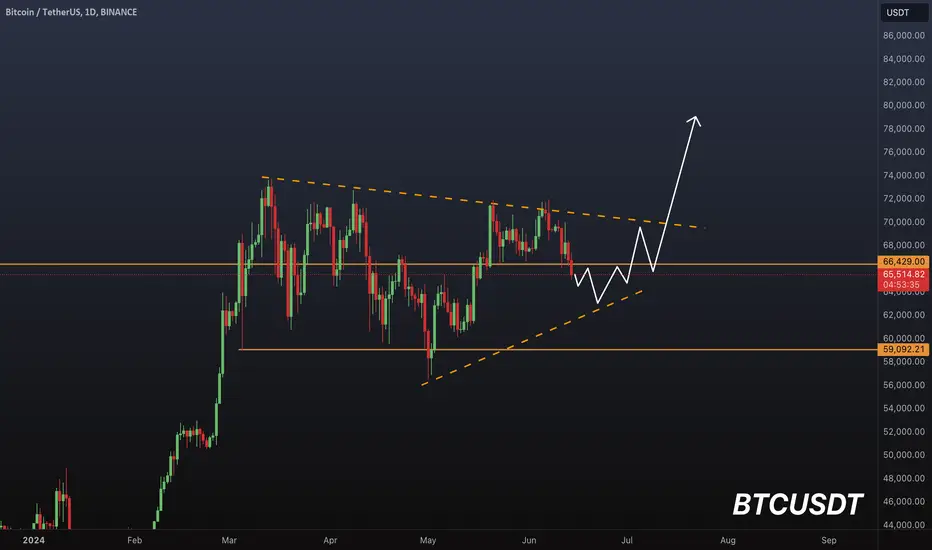
Due to recent activity and positive market predictions, Bitcoin seems to stand at an attractive buying point. The current support at the 100-day Exponential Moving Average and the lower edge of an ascending triangle pattern signals potential rises. It is expected that a bounce from these levels could soon push the Bitcoin price to $72,000, paving the way for a potential rise to $100,000 in the long term.
I expect the Bitcoin price to rise by 30% in July, potentially exceeding $85,000, although current technical indicators lean towards a bearish trend. Therefore, if you are considering investing in Bitcoin, now might be a good time to consider buying, especially if you can handle volatility and have a long-term perspective. It is advisable to regularly reevaluate positions and take advantage of any significant price movements to reap profits or adjust strategies.
Bitcoinlong

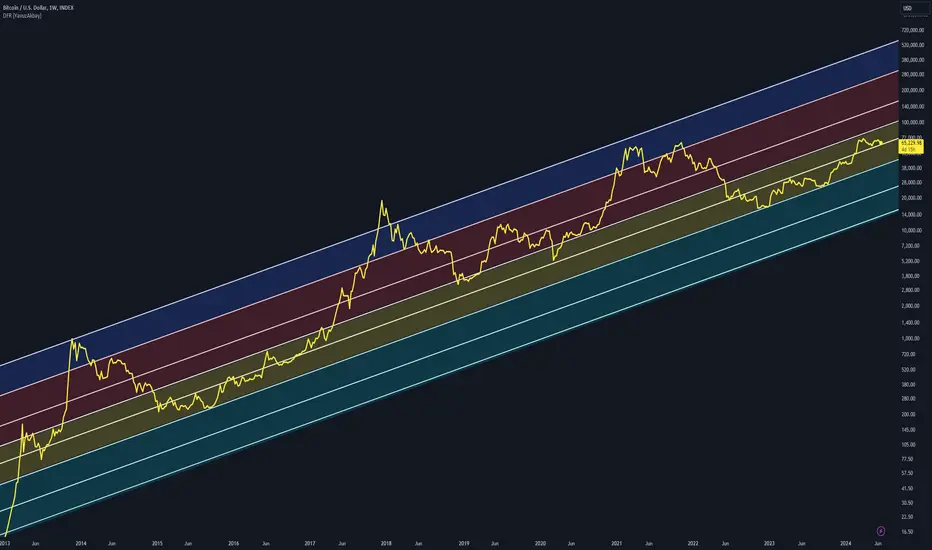
Bitcoin Log Channels CRITICALIn the long term, Bitcoin is in a logarithmic channel. The levels of this channel indicate how cheap and how expensive Bitcoin is. The aqua-colored channel represents the exceptionally cheap region that Bitcoin has never entered in history. The yellow channel has always represented times in history when Bitcoin has been cheap. Therefore, if the 62k level is broken right now, Bitcoin will enter the cheap channel. If this happens, it will give Bitcoin one last buying opportunity before the next bull. The red area is the area that is usually seen in the bull market and where Bitcoin is relatively expensive. It is recommended to hold, not buy, in this area. The blue area is where Bitcoin peaks. It is usually advisable to sell within the blue channel.
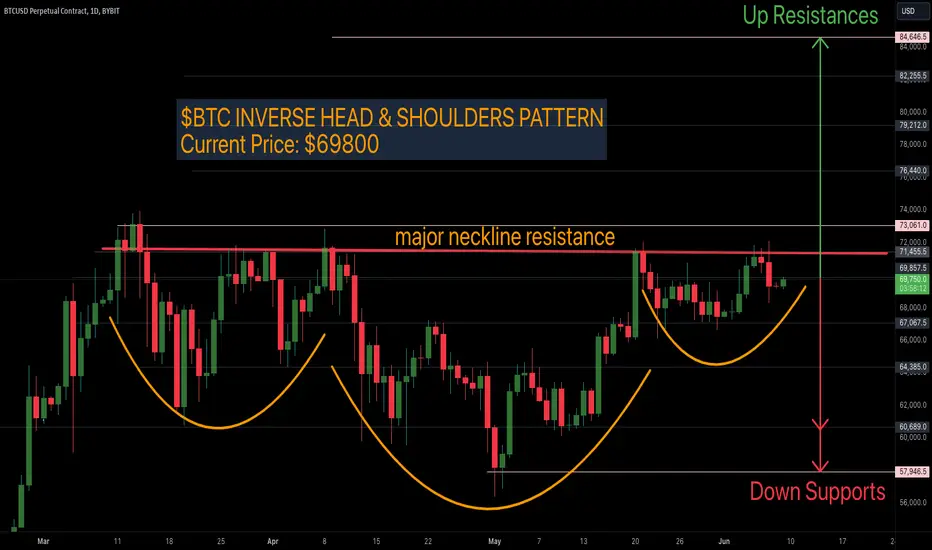
$BTC Bitcoin Update: Head and Shoulder Pattern!CRYPTOCAP:BTC Bitcoin price is forming an inverse head and shoulder pattern!
Current Price: $69800
Major neckline resistance around $71,500
More precisely between 71500 - 73000
If $Bitcoin is going to move to higher prices then price action needs to break neckline resistance to make for price discovery up to 84k. Up resistances: 76400, 79200, 82200, 84600. This will cause altcoins to rally for higher prices.
Else if #Btc continues to reject $71500, then expect retest of previous supports at 67000, & 64300. Consequently altcoins will further lose in value.
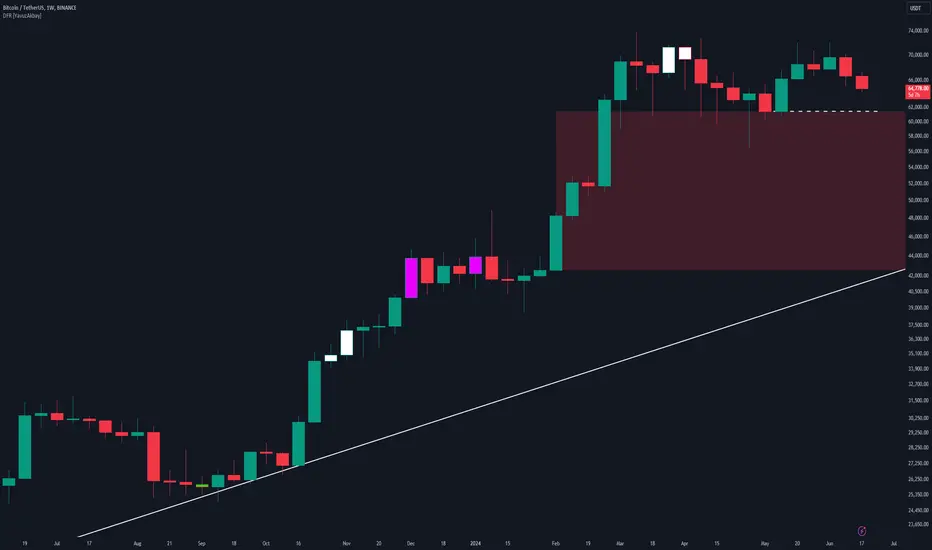
Bitcoin AnalysisIf the $61,000 support is broken, there is a fair value gap down to $42.00. All traders should be cautious as volatility may reach maximum levels in this gap. This is also a sign that the double top pattern is working. The $61,000 support is very important.
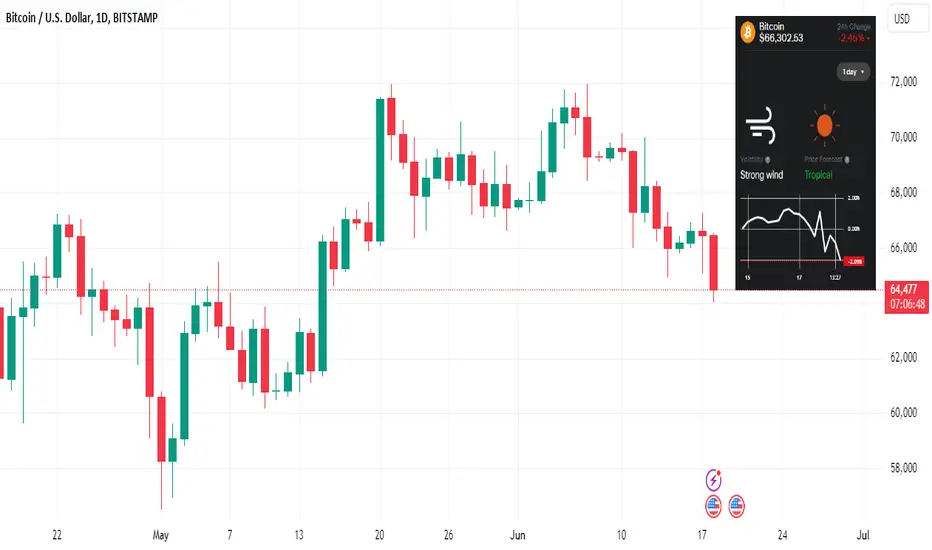
BTC rebound imminentMixed trading signals are anticipated for the next 24 hours in the crypto market. Bitcoin is experiencing tropical conditions, pointing to strong buy signals and a rebound from these levels.
Bitcoin fell below $66,000 on Monday morning, extending last week's decline due to new U.S. economic data. After nearing all-time highs above $71,000 earlier this month, Bitcoin and the broader crypto market have cooled, with Bitcoin briefly dipping below $65,000 over the weekend.
Follow us for more crypto weather reports!
Elliott Wave Analysis on Bitcoin (BTCUSD)Elliott Wave Analysis on Bitcoin (BTCUSD)
Wave (I) and Wave (II) on Weekly Time Frame
Starting from the beginning of the Bitcoin chart, the first significant move up in price has been labeled as Supercycle wave (I). This wave represented the initial major bull run in Bitcoin's history, culminating in a peak, followed by a corrective phase, labeled as Supercycle wave (II). This corrective wave ended at the low observed in November 2022.
- Supercycle Wave (I): This wave exhibited impulsive characteristics with five clear subdivisions (waves 1, 2, 3, 4, and 5).
- Supercycle Wave (II): This was a corrective wave, taking the form of an ABC correction, and concluded in November 2022.
Wave (III) on Weekly Time Frame
Since the low of November 2022, Bitcoin has been unfolding Supercycle wave (III). This wave is expected to be a major bullish phase, often characterized by strong upward momentum and significant price increases. Wave (III) typically shows the following characteristics:
- Strength and Momentum: Wave (III) is usually the longest and most powerful wave in a five-wave cycle.
- High Volume: Accompanied by increased trading volume, indicating strong market interest.
- Impulsive Nature: This wave should subdivide into five smaller waves on a lower time frame, confirming its impulsive nature.
Subdivisions of Wave (III) on Daily Time Frame
Within the context of Wave (III) on the weekly time frame, we are currently analyzing the subdivisions on the daily time frame. The current structure suggests the following:
- Wave ((1)) of Wave (III): This wave is unfolding and subdividing into five smaller waves.
- Wave (1), (2), and (3) of ((1)): These waves have been completed.
- Wave (4) of ((1)): Recently completed around April 2024.
- Wave (5) of ((1)): Expected to breach the all-time high to confirm the start.
Current Status and Invalidation
- Current Status: Bitcoin is potentially in Wave (5) of ((1)) of Wave (III), which needs to breach the all-time high for confirmation.
- Invalidation Point: If the low of April 2024 (where Wave (4) finished) is breached, this would invalidate the current count. It would suggest that Wave (4) is still unfolding, possibly as a double correction.
Characteristics and Structure of Wave (III)
1. Wave ((1)): Typically the smallest wave but should be identifiable as a five-wave move.
2. Wave ((2)): A corrective wave, usually retracing between 50% to 61.8% of Wave ((1)).
3. Wave ((3)): Often the largest and most powerful wave, usually extends to 161.8% of Wave ((1)).
4. Wave ((4)): Another corrective wave, typically shallow, often retracing 23.6% to 38.2% of Wave ((3)).
5. Wave ((5)): Completes the impulse sequence, may extend or truncate but should be a five-wave move.
Conclusion
The Elliott Wave analysis on Bitcoin (BTCUSD) indicates a bullish market ahead, driven by the development of Supercycle wave (III). This analysis is based on the assumption that the low of April 2024 will hold, confirming the end of Wave (4) of ((1)) and the start of Wave (5) of ((1)). If this low is breached, the market might still be in Wave (4), unfolding as a double correction.
I am not Sebi registered analyst.
My studies are for educational purpose only.
Please Consult your financial advisor before trading or investing.
I am not responsible for any kinds of your profits and your losses.
Most investors treat trading as a hobby because they have a full-time job doing something else.
However, If you treat trading like a business, it will pay you like a business.
If you treat like a hobby, hobbies don't pay, they cost you...!
Hope this post is helpful to community
Thanks
RK💕
Disclaimer and Risk Warning.
The analysis and discussion provided on in.tradingview.com is intended for educational purposes only and should not be relied upon for trading decisions. RK_Charts is not an investment adviser and the information provided here should not be taken as professional investment advice. Before buying or selling any investments, securities, or precious metals, it is recommended that you conduct your own due diligence. RK_Charts does not share in your profits and will not take responsibility for any losses you may incur. So Please Consult your financial advisor before trading or investing.

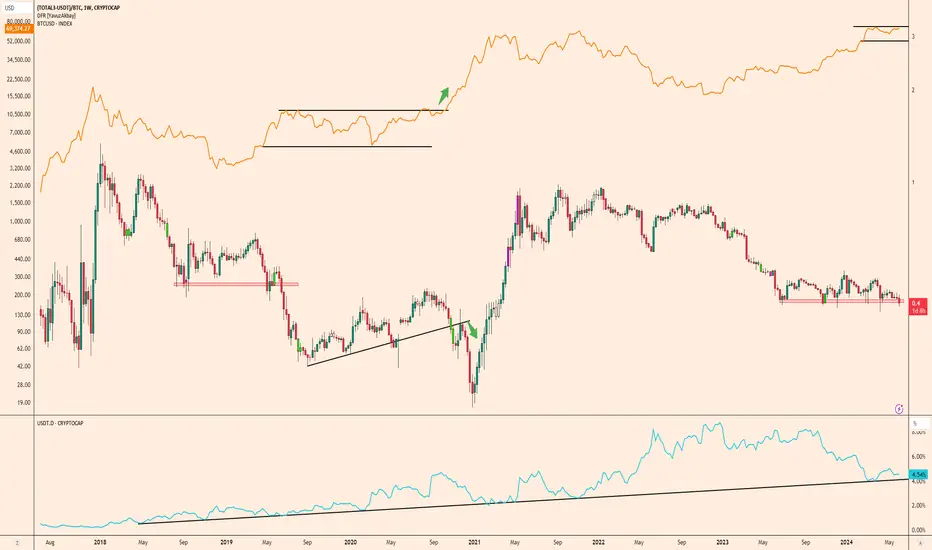
USDT.D Logarithmic Trend Compared to Bitcoin TrendIn the long term, USDT dominance is in an uptrend. Within this trend, it often rises slowly, suppressing Bitcoin and altcoins, sometimes sideways, sometimes causing price declines. Then, with the sudden drops that follow, it puts Bitcoin and altcoins into a very sharp bull season. Right now, USDT is in an uptrend. I think that Bitcoin will enter a sideways channel as long as USDT remains in an uptrend. After this channel, a drop in USDT will put Bitcoin back into the bull season.

BTC's next moveIf BTC doesn't reach $66k, then this scenario will most likely play out. However, this isn't a bear trend; it's just complex sideways movement.
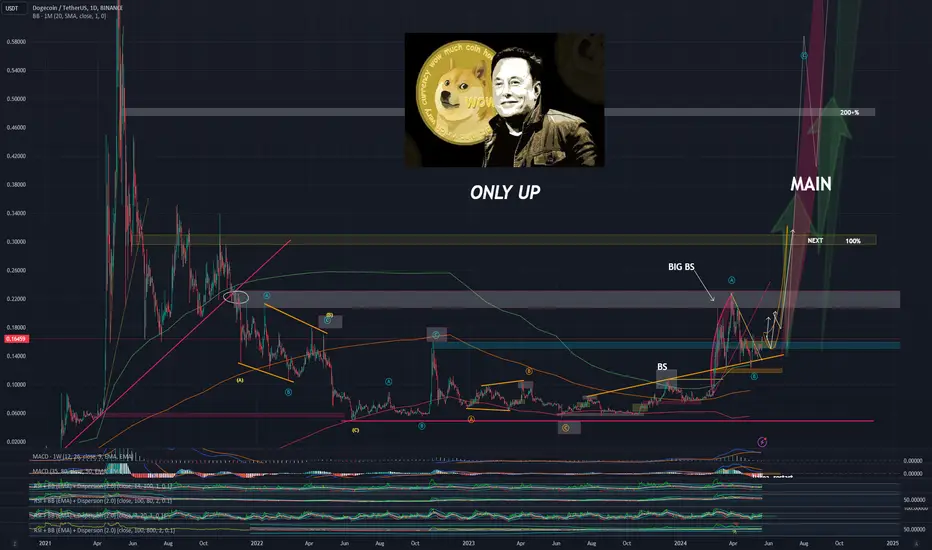
Don't miss it! DOGE analysis UPDATEEverything will pump soon and everything is still cheap today
BTC has reached BS or 70k and many other important factors are only good.
Only up
MoralDisciple
A powerful crypto exchange that just started. UPDATEEverything is pumping and rising soon, US500, EURUSD, GOLD, BITCOIN ETC
It is a coin of a major crypto exchange and definitely a good choice. The crypto industry is in its infancy
Only up!

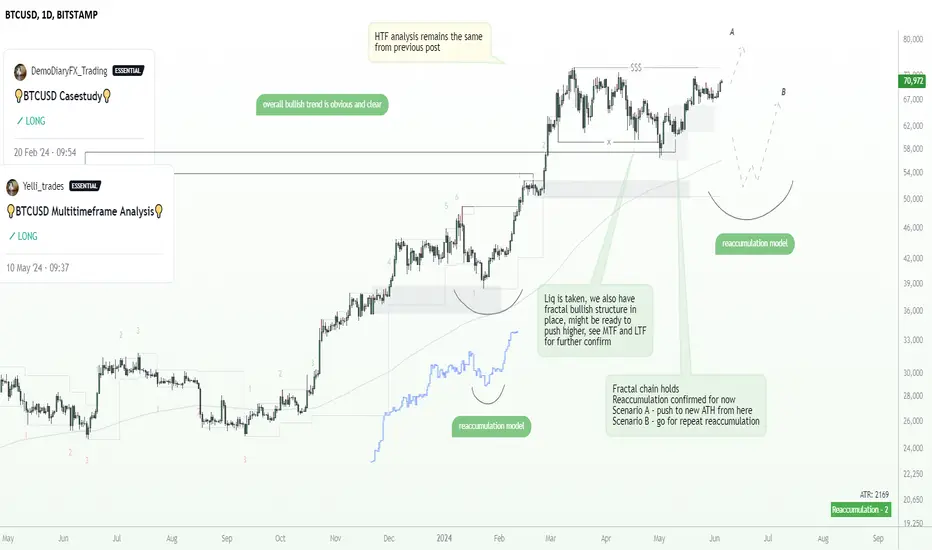
Bitcoin is going to shoot up to $112k+ in June / JulyAll details are drawn on the chart.
Basically BTC is in a huge bull market with a clear imbalance of demand and supply. There was 3-month long reaccumulation period at all time high of $69500 with all outstanding supply bought up. Price is gonna shoot up to $112k at minimum very swiftly.

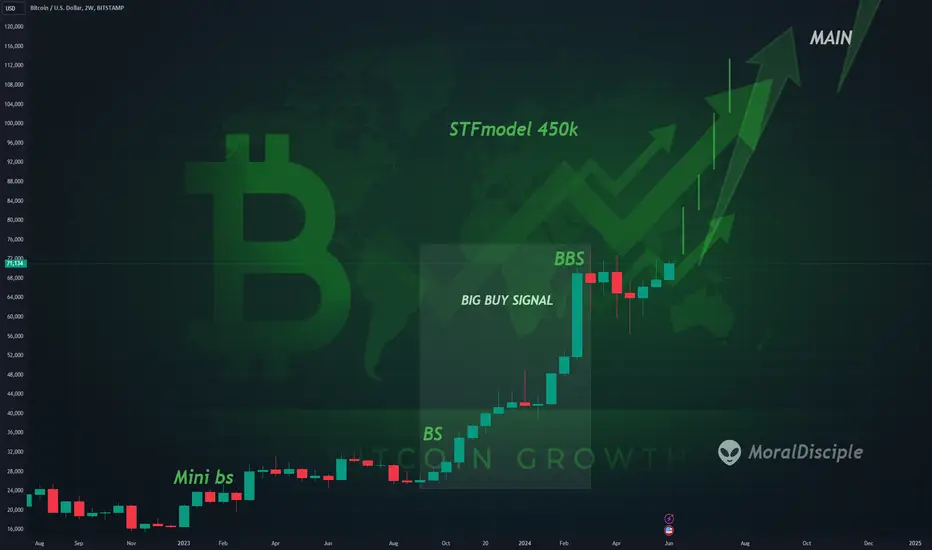
100k for this summer! Always greenBitcoin is designed to grow forever and works like the US500 but only with higher volume.
BTC volume is incredible and I won't be surprised if we see 100k++ within 3 months or summer.
3-17 June 2w closes in green!!
More details on the MD channel or in future updates.
I wish you success and see you at the top! MD
BTCUSD BITCOIN USDTHELLO dear its easy just like how i pattern
target 72000$ second T 83000$
thanks.
it is not buy signal
it is my thoughts do your analysis and after that trade!
BTCUSD: High chance to see 75k+ soon. Here's why!Please see previous btc ideas for more context
☝️Do not act based on my analysis, do your own research!!
The main purpose of my resources is free, actionable education for anyone who wants to learn trading and improve mental and technical trading skills. Learn from hundreds of videos and the real story of a particular trader, with all the mistakes and pain on the way to consistency. I'm always glad to discuss and answer questions. 🙌
☝️ALL ideas and videos here are for sharing my experience purposes only, not financial advice, NOT A SIGNAL. YOUR TRADES ARE YOUR COMPLETE RESPONSIBILITY. Everything here should be treated as a simulated, educational environment. Important disclaimer - this idea is just a possibility and my extremely subjective opinion. Do not act based on my analysis, do your own research!!
Bitcoin looks good for a 20% upmove from current levelsKUCOIN:BTCUSDT has been hovering around and below 70k+ levels for few months now and looks prime to make an upmove after breaking this zone.
If we draw a trendline using the highest close values then we have got a marginal close above the trendline this week and today, #BTC is again trying to push past it. If it manages to convincingly breakout above this trendline, we might see a 20% upmove from current levels.
Keep an eye!

Bitcoin on track As you can see Bitcoin is trying to bounce from the support area i drawed yesterday. Nothing new for us, and i want to see a lower low as a confirmation of a possible reversal pattern. I am entering long now with a tight stop just below local bottom targeting the 70K area. Will keep updated

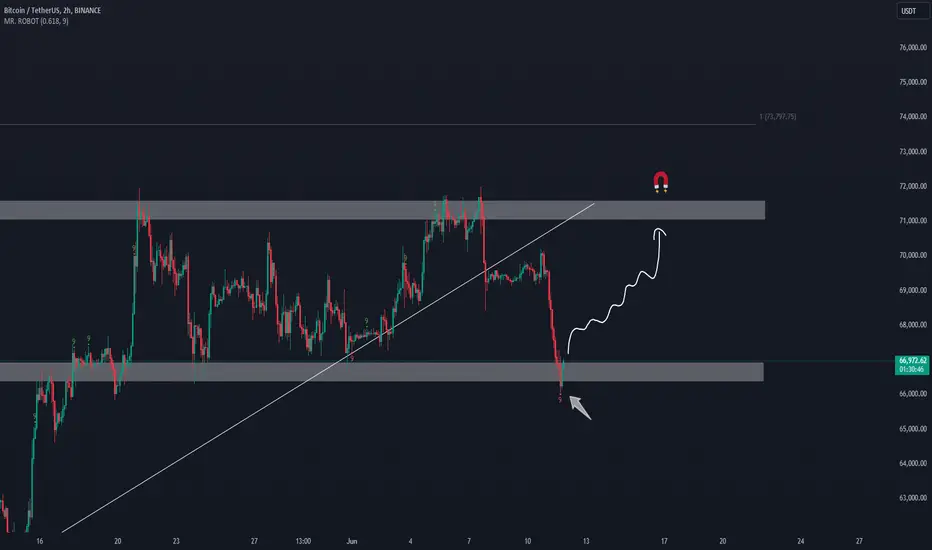
BTCUSDT#BTC #Bitcoin Chart Update: We've reached an important support level and are poised to move upwards from here. There's no reason to panic sell at a loss. When looking at Bitcoin liquidations over 3-day, 7-day, and 1-month periods, we see significant amounts of liquidity, amounting to billions of dollars, accumulating around the 71k level. Almost all indicators and data point to an upward trend. We can position ourselves accordingly.
77k is on the horizonThe formation of a rising pattern is about to end, it could be a flag, which could take us to 77K , if its not a flag we can go lower but at the end bull trend is intact.
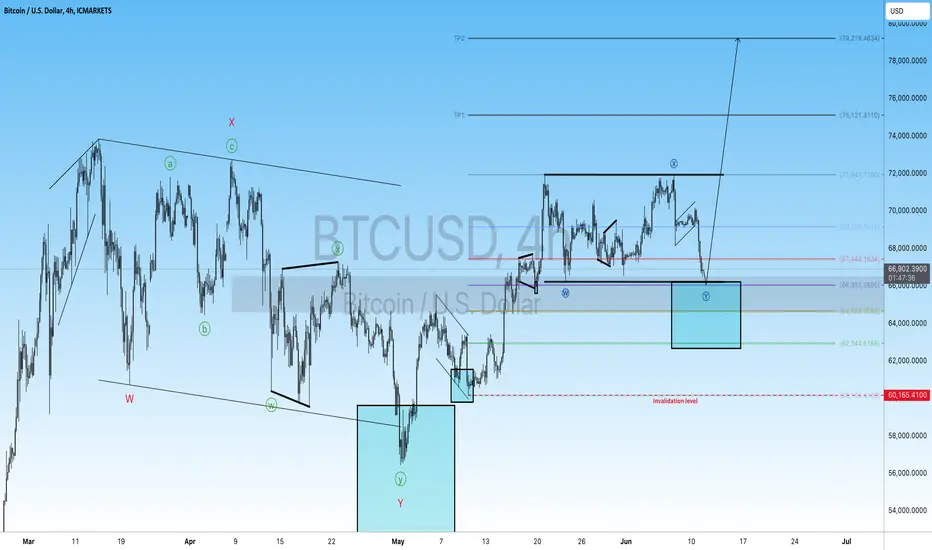
BTCUSD BUY (80k soon!!)Hi fellow traders, BTCUSD will be ready to make a move higher from the blue box after it completes the flat correction. Target the 79219.46 level. Good luck and trade safe!

Bitcoin's Stalled Breakout: A Test of Bullish Resolve
Bitcoin (BTC) ended last week with a whimper, failing to decisively break out of a bullish technical pattern and overcome key resistance levels. This has left many investors questioning the short-term trajectory of the world's leading cryptocurrency. After a price drop on Friday and a lackluster weekend, what can we expect from Bitcoin in the coming days and weeks?
The Failed Breakout and Bullish Doubts
The recent price action centered around a prominent technical pattern known as a bull flag. This pattern typically precedes a bullish continuation, with a price consolidation period following an uptrend. However, Bitcoin's attempt to break above the flag's resistance level at the end of the week proved unsuccessful. This failed breakout has cast doubt on the immediate bullish momentum and raised concerns about a potential reversal.
Technical Indicators: A Mixed Bag
Adding to the uncertainty are technical indicators that paint a conflicting picture. Some, like the Relative Strength Index (RSI), are hovering around neutral territory, suggesting neither overbought nor oversold conditions. This could be interpreted as a sign of potential buying pressure waiting to be unleashed.
However, other indicators like the "death cross" – formed when the 50-day moving average dips below the 200-day moving average – have emerged, historically hinting at a possible short-term price decline.
The ETF Inflow vs. Hedge Fund Shorting Tug-of-War
Beyond technicals, a fascinating dynamic is playing out between two opposing forces in the market: inflows into Bitcoin Exchange-Traded Funds (ETFs) and short positions taken by hedge funds.
On the bullish side, significant inflows into Bitcoin ETFs have been observed. This suggests institutional interest in the cryptocurrency remains strong, potentially providing a buying force that could propel the price upwards.
However, this optimism is countered by reports of hedge funds taking large short positions on Bitcoin. These bets essentially profit if the price falls. This shorting activity could act as a headwind, potentially hindering any significant price gains.
Short-Term Bounce vs. Long-Term Trend
While a short-term bounce from current levels seems likely, predicting the long-term direction of Bitcoin remains a challenge. The failed breakout and bearish technical indicators raise concerns about a potential downward correction. However, the underlying fundamentals, including strong institutional interest and Bitcoin's limited supply, suggest long-term bullish potential.
The Bottom Line: Patience and a Multifaceted Approach
For investors, the current situation necessitates a patient and multifaceted approach. Monitoring both technical indicators and on-chain data to gauge investor sentiment can provide valuable insights. Additionally, staying informed about regulatory developments and broader market trends is crucial, as these external factors can significantly influence Bitcoin's price.
Ultimately, while the immediate future of Bitcoin is uncertain, one thing remains clear: the battle between bulls and bears is far from over. The coming weeks will be telling, revealing whether Bitcoin can gather enough strength to overcome the recent setbacks and continue its upward trajectory.

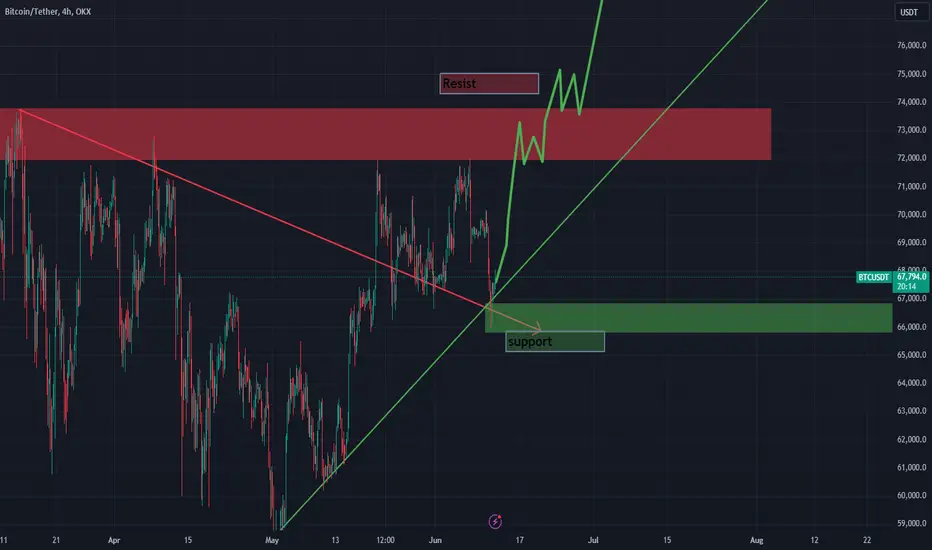
Breaking $72,000 as a Catalyst for a Surge to $180,000+As we closely monitor Bitcoin's price movements, a critical resistance level at $72,000 stands out. If Bitcoin successfully breaks through this barrier, it could signal the beginning of a significant upward trajectory. The implications of surpassing $72,000 are substantial, potentially driving momentum that propels Bitcoin to new all-time highs.
Reflecting on historical trends and market cycles, it's evident that Bitcoin is on the verge of entering a new bull market phase. Analyzing the patterns and growth from previous years, there are compelling indicators suggesting that Bitcoin's next peak is on the horizon. I anticipate that we will see Bitcoin's value soar between April and September of 2025, reaching levels above $180,000.
Several factors support this bullish outlook. The increasing institutional adoption, growing acceptance as a store of value, and technological advancements within the blockchain space all contribute to the potential for significant price appreciation. Moreover, the macroeconomic environment, characterized by inflation concerns and a search for alternative assets, further bolsters the case for Bitcoin's continued growth.
In conclusion, breaking the $72,000 mark is more than just a price milestone; it could be the trigger for a substantial bullish run. With the potential peak projected between April and September 2025, reaching above $180,000, Bitcoin's future looks exceptionally promising. Investors and enthusiasts alike should keep a close eye on these key levels and prepare for the opportunities that lie ahead in this dynamic and evolving market.

Altcoin/Bitcoin AnalysisAs I always say, when I look at the ALT/BTC parity, not the Bitcoin price, I see a downward break in the 40th week of 2019. This breakdown may happen again, it is possible. After this breakout, I expect to see a scenario in which Bitcoin becomes in a channel. (70 - 50k) This scenario would also not be contrary to the macro perspective of the markets globally. Another chart that supports this scenario is the USDT dominance chart. We can think that this chart will reduce the price of Bitcoin as it rejects the uptrend and rises to decide the continuation of the trend. Seeing the rise of Bitcoin dominance in this process signals to me that some altcoins in particular will be hit hard. Therefore, there will be great bleeding in the altcoin market, except for the solid altcoins. However, the altcoins that survive this process will make ATH much more performant as Bitcoin reaches its 100k target.