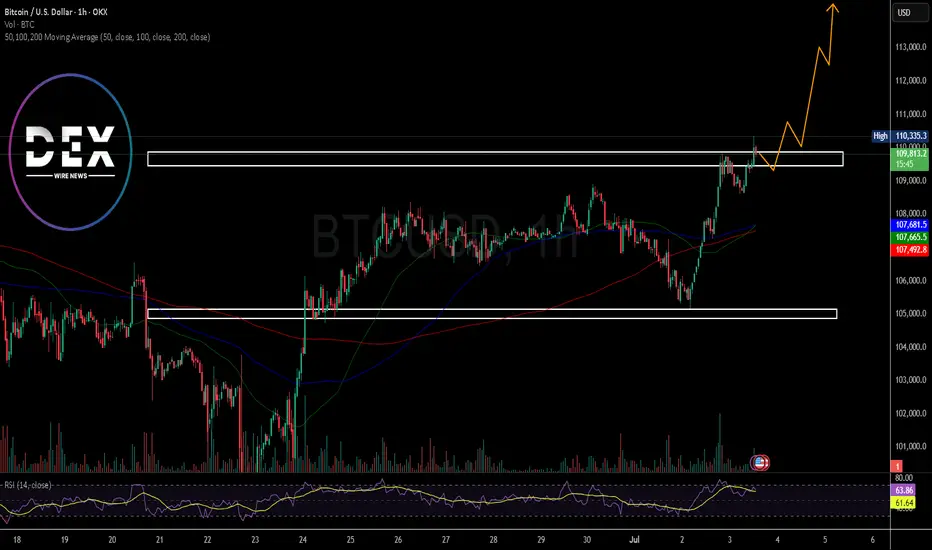
Breaking: Bitcoin Just Broke the $110k Resistant Next Top $115kThe price of the first crypto currency ever created saw a noteworthy uptick to reclaim the $110k price point however, the move was short-lived as the asset retraced to $109k mark but present price chart depicts a move to the $115k resistant point in the short term.
With the Relative strength index (RSI) at 63, Bitcoin might be inches away from claiming the $115k pivot amidst build up momentum and institutional adoption. further bullish metrics include the asset trading above the 50, 100 and 200-day Moving Averages (MA) respectfully.
Bitcoinmarkets
Bitcoin Supply Shock Is No Longer a Theory, But a Reality
In the intricate and often frenetic world of digital assets, the market is constantly sending signals. Some are loud, ephemeral flashes of volatility that capture headlines for a day. Others are quiet, seismic shifts that build slowly beneath the surface, unnoticed by the masses until they erupt with earth-shattering force. Today, the Bitcoin network is broadcasting one of these profound, underlying signals. It speaks of a disappearance, a vanishing act on a scale never before seen, pointing toward a supply shock so significant that it threatens to redefine the very concept of price discovery for the world’s premier cryptocurrency.
The paradox currently facing market observers is the disconnect between Bitcoin’s somewhat range-bound price, which has struggled to decisively conquer the territory above $120,000, and the tectonic movements occurring in its fundamental market structure. While the price action might suggest a market in equilibrium, a state of indecisive calm, the data tells a story of immense and growing tension. It is a story of a collision course between two unprecedented forces: a relentless, programmatic wave of institutional demand and a rapidly dwindling, fiercely guarded supply.
The central piece of evidence, the smoking gun for this impending crisis, is the state of Bitcoin reserves on cryptocurrency exchanges. These platforms, the bustling marketplaces where buyers and sellers meet, have seen their Bitcoin inventories plummet to a seven-year low. Less than 15% of the total circulating Bitcoin supply now resides on these exchanges, a figure that is as statistically stark as it is historically significant. This isn’t merely a data point; it is a profound statement of intent from the global cohort of Bitcoin holders. It signifies a monumental shift from short-term speculation to long-term conviction, a collective decision to withdraw assets from the realm of immediate liquidity and into the deep, fortified vaults of cold storage. This great disappearance is the quiet prelude to a very loud event, and to understand its implications, one must dissect the powerful forces of both supply and demand that are pulling the market to its breaking point.
The Vanishing Act: Where Has All the Bitcoin Gone?
To grasp the gravity of the dwindling exchange reserves, one must first understand the role of an exchange in the life cycle of a Bitcoin. An exchange is a trading floor. Assets held there are, by their very nature, liquid and available for sale. A holder who moves their Bitcoin onto an exchange is signaling an intent to trade or sell, either immediately or in the near future. Conversely, moving Bitcoin off an exchange and into a personal, self-custodied wallet—often called cold storage—is a deliberate act of preservation. It is a declaration that the owner has no immediate intention of selling. They are choosing to become a long-term holder, a saver, effectively removing their coins from the active, tradeable supply.
For years, the flow of Bitcoin onto and off of exchanges has served as a reliable barometer of market sentiment. During the euphoric peaks of past bull markets, a predictable pattern emerged: as prices soared, a flood of Bitcoin would move onto exchanges as long-term holders finally decided to take profits. This influx of supply would help to satisfy the frenzied buying demand, eventually capping the rally and leading to a market correction.
This cycle, however, is fundamentally different. The opposite is happening. Despite prices reaching new all-time highs, the flow has been overwhelmingly outward. Coins are leaving exchanges at a historic pace, creating a supply-side vacuum. This exodus is not a new phenomenon, but the acceleration over the past 18 months has been breathtaking. It reflects a maturing market and a hardened investor base that has learned the lessons of previous cycles. They have witnessed Bitcoin’s resilience, its ability to weather brutal bear markets and emerge stronger each time. They are no longer content with selling for a 5x or 10x profit, only to watch the asset climb another tenfold in the subsequent years. They have transitioned from treating Bitcoin as a speculative trade to embracing it as a long-term savings technology, a digital store of value in an increasingly uncertain macroeconomic world. The coins are not lost; they have simply gone home, locked away by owners who have no interest in selling at today’s prices.
The Wall Street Leviathan: A New and Insatiable Source of Demand
While the available supply of Bitcoin has been quietly disappearing into private wallets, a new and powerful predator has entered the ecosystem, armed with an insatiable appetite. The launch of spot Bitcoin Exchange-Traded Funds (ETFs) in the United States marked the single most significant structural change in the history of the Bitcoin market. These regulated financial products, offered by the largest asset managers in the world, have constructed a permanent, one-way bridge connecting the traditional financial system to the digital asset space.
This bridge is not for casual tourism; it is a superhighway for capital. The ETFs, led by BlackRock’s behemoth iShares Bitcoin Trust (IBIT), have unleashed a torrent of institutional and retail money that is systematically draining the remaining available supply. The mechanics of these ETFs are crucial to understand. Unlike futures-based products, a spot ETF must acquire and hold the underlying asset—in this case, real Bitcoin—to back the shares it issues to investors. This means that for every dollar that flows into an ETF like IBIT, its managers must go into the open market and buy a corresponding amount of Bitcoin.
The scale of this operation is staggering. In a stunning testament to the demand for this new product, BlackRock’s Bitcoin ETF has, in its short 18-month existence, begun to generate more revenue from annual fees than its long-established and immensely popular S&P 500 fund. This is not a niche product for crypto enthusiasts; it is a mainstream financial blockbuster, attracting billions from investors seeking a simple, regulated way to gain exposure to Bitcoin.
This creates a relentless, programmatic buying pressure that the market has never before had to absorb. Every single trading day, the ETFs collectively purchase a significant amount of Bitcoin. This demand is constant and largely price-agnostic. It is driven by asset allocation decisions, not short-term market timing. This programmatic buying acts like a giant hydraulic pump, sucking up any loose supply available on exchanges. The daily demand from these Wall Street giants often outstrips the new supply of Bitcoin created by miners, creating a structural deficit that can only be filled by one source: the existing coins held by others. And as we’ve seen, those holders are increasingly unwilling to part with their assets.
The Diamond-Handed Super-Majority: A Trillion-Dollar Standoff
The collision between the insatiable demand of the ETFs and the shrinking available supply raises a critical question: why aren't the existing holders selling? With so much new money flooding into the market, basic economics would suggest that the rising price should entice current owners to sell and realize their gains. Yet, the data reveals a fascinating psychological standoff.
According to research from the on-chain analytics firm Glassnode, a "super-majority" of Bitcoin holders are currently sitting on a colossal $1.2 trillion in unrealized profits. This means that a vast portion of the network acquired their coins at prices far below the current level and are deep in the green. In any other market, such a massive overhang of profit would be seen as a significant risk, a powder keg of potential sell pressure waiting to be ignited.
But in the world of Bitcoin, it has become a fortress of conviction. Glassnode’s analysis concludes that the current price, even in the six-figure range, "is not compelling enough for investors to continue selling." This is a revolutionary insight into the mindset of the modern Bitcoin investor. Their price targets have shifted dramatically. They are not looking to sell at $120,000 or even $140,000. For many, these levels are seen as mere stepping stones on the path to a much higher valuation, one that properly reflects Bitcoin’s role as a global, non-sovereign store of value.
Further research into profit-taking behavior confirms this trend. The amount of realized profit—that is, coins being sold at a gain—in the current cycle has yet to match the levels seen during the peak of the 2024 rally. This suggests that the holders who were willing to sell at those prices have already done so. The remaining cohort is composed of the most steadfast believers, the "diamond hands," who are holding out for a much more significant repricing. Some analyses suggest that the Bitcoin price would notionally need to rise another 30%, toward the $140,000 mark, just to reach a point where this cohort even begins to feel tempted to part with their holdings in a meaningful way. This creates a powerful reflexive loop: the less they sell, the less supply is available, and the more explosive the potential price move when demand continues to pour in.
The Macroeconomic Perfect Storm
The conviction of Bitcoin holders and the flood of institutional capital are not occurring in a vacuum. They are a direct response to a global macroeconomic environment that is creating a perfect storm for a hard, scarce asset. The primary driver of this is the unprecedented expansion of the global money supply. The M2 money supply—a broad measure of currency that includes cash, checking and savings deposits, and money market funds—has reached a record high.
Governments and central banks around the world have engaged in years of quantitative easing and fiscal stimulus, effectively printing trillions of dollars to prop up their economies. While often necessary in the short term, this relentless monetary expansion has a corrosive long-term effect: it debases the value of fiat currencies. As the supply of dollars, euros, and yen increases, the purchasing power of each individual unit decreases.
In this environment, rational economic actors begin to search for a safe harbor, a place to protect their wealth from the slow-motion erosion of inflation. Historically, this role was filled by assets like gold. Today, a growing number of individuals, corporations, and even nation-states are turning to Bitcoin. Its mathematically enforced scarcity—a hard cap of 21 million coins that can never be altered—stands in stark contrast to the infinite printability of government-issued money.
This narrative has been supercharged by the recent performance of the US dollar itself. The world’s reserve currency experienced a dramatic 10.8% drop in its worst first-half performance since 1973, signaling a potential shift in global currency dynamics. As the dollar weakens, assets priced in dollars become cheaper for foreign investors, and the appeal of a non-sovereign alternative like Bitcoin grows. This macroeconomic backdrop provides the fundamental "why" behind the Bitcoin trade. It is no longer just a technological curiosity or a speculative bet; it is increasingly viewed as an essential component of a diversified portfolio, a hedge against the very real risks of monetary debasement and geopolitical instability. It is this understanding that underpins bullish price targets that sit around $170,000 and beyond.
Navigating the Uncomfortable Calm
With such a powerfully bullish confluence of factors, the question remains: why has Bitcoin been seemingly stuck in a consolidation pattern, unable to break out and sustain a move into the higher price ranges? Why did the market see a wobble that brought the price down to $105,000, causing anxiety among newer entrants?
The answer lies in the nature of market equilibrium. Even in the most ferocious bull market, there are always sellers. Miners, who must sell some of their newly minted Bitcoin to cover their operational costs, represent a constant source of supply. Early investors may take some profits to diversify their wealth. Short-term traders will try to play the ranges, and even some of the capital in the ETFs will inevitably be redeemed, forcing the funds to sell a corresponding amount of Bitcoin.
The current price range below $120,000 represents the battleground where the relentless, programmatic buying from the ETF leviathan is meeting and absorbing this natural, daily sell pressure. The market is in a state of accumulation and consolidation, building a strong base of support before its next major move. The fact that crypto market sentiment has held steady, even during price dips and the start of the third quarter—a period historically known for its weak seasonality—is a testament to the market's newfound maturity. The "weak hands," or investors with low conviction, have likely been shaken out, leaving a stronger, more resilient base of holders.
This period of sideways price action is likely to be deceptive. The historical seasonality of Bitcoin suggests that summer can often be a period of lackluster performance, lulling market participants into a state of complacency. The idea that Summer 2025 will "catch everyone off guard" stems from this dynamic. While the price chart may look boring, the underlying supply and demand forces are becoming ever more tightly coiled. The pressure is building, and the longer the market consolidates, the more violent the eventual breakout is likely to be.
The Inevitable Collision
The story of Bitcoin in 2025 is the story of an inevitable collision. On one side, you have the most powerful force of demand the asset has ever known: a fleet of Wall Street ETFs, led by the world's largest asset manager, programmatically buying Bitcoin every single day. This demand is structural, relentless, and here to stay.
On the other side, you have the most convicted group of holders in Bitcoin’s history. They are a super-majority, sitting on over a trillion dollars in profit, who have explicitly signaled through their actions and on-chain data that they have no intention of selling at these prices. They are withdrawing their coins from the market at a historic rate, creating a supply desert.
The dwindling reserve of Bitcoin on exchanges is the ticking clock in this grand drama. It is the visible measure of the supply shock in progress. Each day, the ETFs arrive in the market to fill their orders, only to find the shelves are increasingly bare. The deficit they create must be filled by prying coins from the diamond hands of long-term holders. But those holders have made their price clear, and it is not $120,000.
Therefore, the current market is not in a state of calm, but in a state of profound tension. It is the quiet moment before the lightning strike. The forces of an institutional-grade demand shock and a historic holder-induced supply squeeze are on a direct and unavoidable collision course. The question is no longer if this tension will resolve, but when and with what magnitude. The great disappearance of Bitcoin from the open market is the final signal that the supply problem is no longer a distant forecast. It is here, and it is about to change everything.
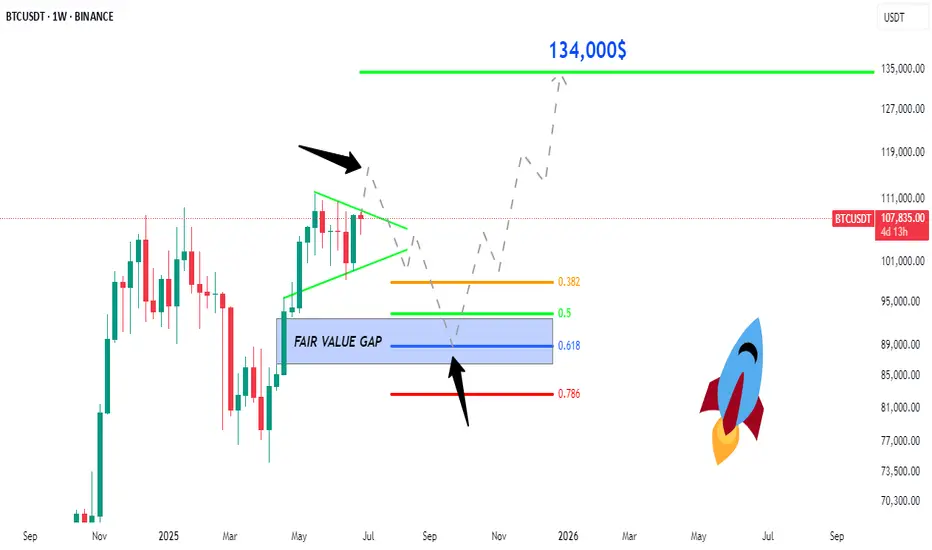
BTC: Price to 134,500$ , FVG, Fib 0.5 and 0.618 ratio ?Price to 134,500$:
Bitcoin is now moving in a triangle pattern, which is getting smaller. The price is around $107,758. Here is possible move is a breakout to the downside first, where the price may drop to fill the "Fair Value Gap" area, which is marked in purple. This area is between the Fibonacci levels of 0.5 and 0.618. After that, Bitcoin could go up again and reach the price of $134,000.
Trade Ideas:
I marked 2 areas with arrow let the price reach here and wait for confirmation in both areas. Specially in Fair Value Gap area.
Trade Signal:
I will provide both trade signal here so follow my account and you can check my previous analysis regarding BITCOIN. So don't miss trade opportunity so follow must.
BINANCE:BTCUSDT BITSTAMP:BTCUSD COINBASE:BTCUSD COINBASE:BTCUSD BINANCE:BTCUSDT.P CRYPTO:BTCUSD BYBIT:BTCUSDT.P BINANCE:BTCUSD
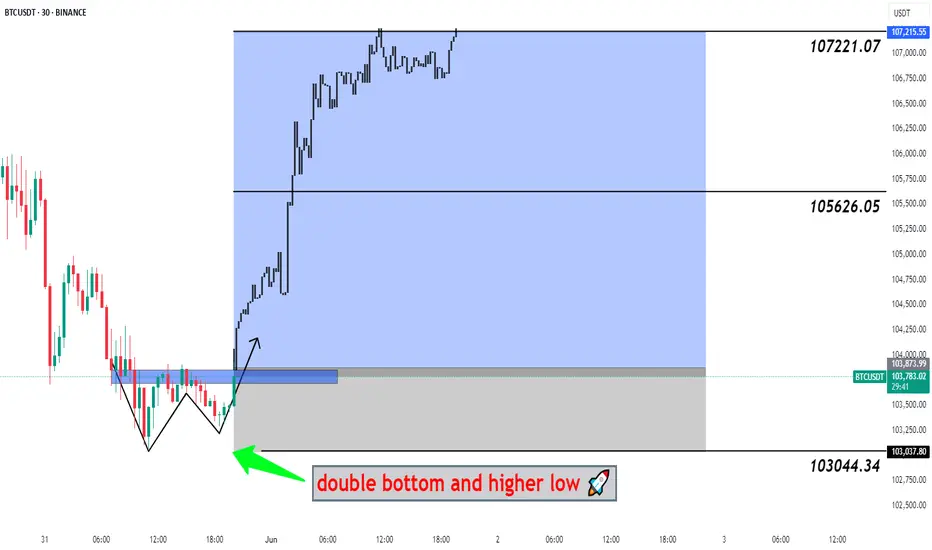
#BTCUSDT Big Pump Next Hour - Bitcoin, BTCUSD, BTCUSDT 📉 Double Bottom Pattern Forming – Potential Reversal Setup
The current price structure is showing signs of a Double Bottom – a classic bullish reversal pattern. After an extended downtrend, this pattern suggests that the market may be preparing for a trend reversal from this key demand zone.
🔹 Trade Setup
Entry, Targets, and Stop Loss (SL) are marked on the chart.
Entry: Upon breakout confirmation above the neckline.
Stop Loss: Just below the recent swing low to manage downside risk.
Targets: Calculated using the measured move method from the bottom to the neckline .
🔹 Risk & Money Management (Professional Approach)
To maintain consistent profitability and protect capital, strict risk management is essential. For this setup:
🔸 Position Sizing: Based on a fixed % of total capital (typically 1–2% of account equity per trade).
🔸 Risk-to-Reward Ratio: Minimum of 1:2, ideally higher.
🔸 Stop Loss Discipline: No arbitrary changes after entry. SL only adjusted for breakeven or trailing stops once price moves favorably.
🔸 Trade Management: Secure partial profits at key levels, trail stops as structure forms.
🔸 Capital Allocation: Avoid overexposure. Trade fits within overall portfolio strategy.
💬 Let the setup come to you. React, don’t predict.
🔁 Like, comment, or share your thoughts below!
BINANCE:BTCUSDT BITSTAMP:BTCUSD COINBASE:BTCUSD BINANCE:BTCUSDT.P INDEX:BTCUSD CRYPTOCAP:BTC.D CRYPTO:BTCUSD BYBIT:BTCUSDT.P BINANCE:BTCUSD
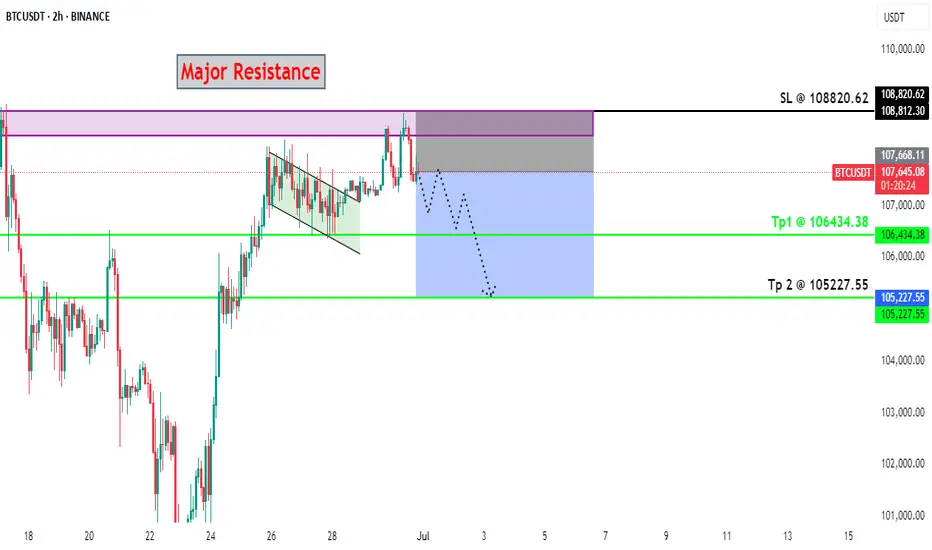
BTC - High Probability Trade Idea Here we have a major resistance at this upper level. And market seems to create a "Double Top Patter". So its indicating a possible bearish move.
Target and Sl on chart. Follow risk and money management.
BINANCE:BTCUSDT BITSTAMP:BTCUSD BINANCE:BTCUSDT.P INDEX:BTCUSD BYBIT:BTCUSDT.P BINANCE:BTCUSD
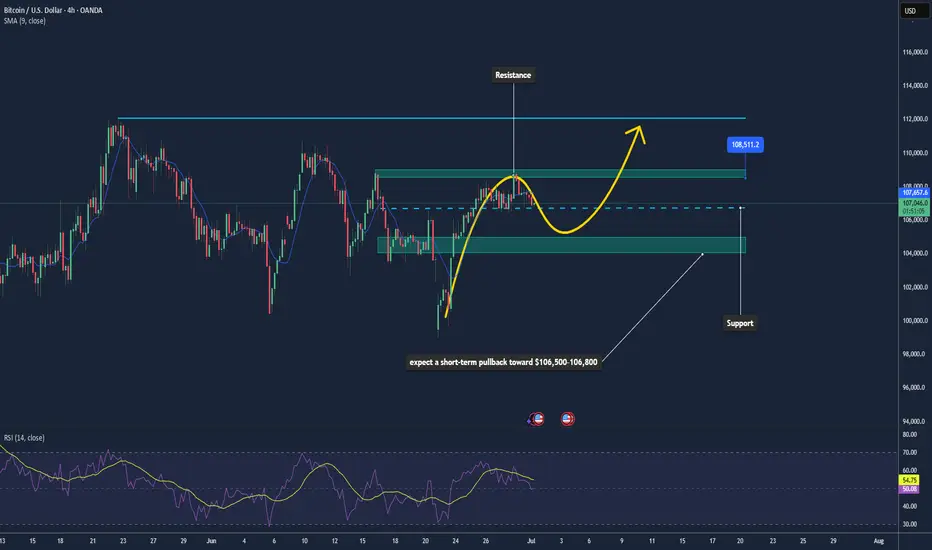
Bitcoin May Break Higher if $108K Clears📊 Market:
BTC trades around $106,860, driven by strong ETF inflows and weaker USD ahead of Fed rate decisions.
📉 Technical:
• Resistance: $107,400–108,000 → breakout may target $110,000+
• Support: $106,500–106,800 → next at $105,500
• EMA: Price above EMA9 → short-term uptrend
• Momentum: RSI > 80, Stoch high → upside potential but overbought
📌 Outlook:
BTC could rise if $108K breaks. If not, expect a pullback to $106,800.
💡 Trade Setup:
🔺 BUY BTC/USD: $107,000–107,200
🎯 TP: 1000–2000 pts
❌ SL: $106,500
🔻 SELL BTC/USD: $108,000–108,200
🎯 TP: $106,800–107,000
❌ SL: $108,500
Whales Dump on Wall Street, Fueling Bitcoin's 'Inevitable' SurgeIn the high-stakes world of cryptocurrency, where fortunes are made and lost in the blink of an eye, a new narrative is taking shape. With Bitcoin's price hypothetically hovering around a robust $107,000, a significant portion of market analysis now suggests that a new all-time high is not just a possibility, but an inevitability. This confidence stems from a complex interplay of technical strength, unprecedented institutional demand, and a massive, yet healthy, transfer of wealth from early adopters to the new titans of finance.
The market is currently witnessing a fascinating dynamic: while the price consolidates above the monumental $100,000 psychological barrier, long-term holders, often referred to as "OG whales," are systematically selling their holdings. This activity, which could be misconstrued as bearish, is being interpreted by many as a necessary and constructive phase. Instead of suppressing the price, this distribution is meeting a voracious appetite from Wall Street, primarily through the mechanism of spot Bitcoin Exchange-Traded Funds (ETFs). This creates a state of equilibrium, a period of sideways consolidation where the market digests enormous gains and builds a foundation for its next explosive move. The target on the horizon is a liquidity cluster around $109,000, a key level that, if decisively flipped to support, could unlock a path to uncharted territory.
This article will delve into the multifaceted dynamics of this hypothetical market scenario. It will explore the significance of consolidating above $100,000, dissect the "great transfer" of Bitcoin from early believers to institutional giants, and analyze the technical and on-chain metrics pointing toward an imminent breakout. Finally, it will consider the potential risks and counterarguments that could challenge the prevailing bullish thesis, providing a comprehensive overview of a market at a pivotal crossroads.
Part 1: The New Paradigm - Consolidating Above $100,000
The act of breaking and holding a price level as significant as $100,000 represents more than just a numerical achievement; it is a profound psychological and structural shift for Bitcoin. In this hypothetical scenario, the market is not just visiting this level but is actively building a base above it, a process known as consolidation. This phase is crucial, characterized by sideways price movement within a defined range, often accompanied by decreasing trading volume, as the market takes a collective breath and establishes a new sense of fair value.
The Psychology of a Six-Figure Asset
For years, $100,000 was a distant, almost mythical target for Bitcoin. Surpassing and, more importantly, sustaining this level transforms market perception. It solidifies Bitcoin's status as a mature, global macro asset, moving it further away from its speculative past. This psychological victory attracts a new wave of capital from more conservative investors, wealth funds, and corporations who may have been hesitant to enter before such a milestone was reached. The consolidation phase above this level acts as a proof of stability, demonstrating that the asset can absorb significant profit-taking without collapsing, thereby building trust and confidence for the next wave of adoption.
Market Structure and Institutional Support
This period of stability is not happening in a vacuum. It is underpinned by a fundamental change in market structure, primarily the advent and overwhelming success of spot Bitcoin ETFs. These regulated financial products have provided a seamless bridge for Wall Street to pour billions of dollars into Bitcoin, creating a formidable wall of buy-side demand. In this scenario, where Bitcoin oscillates between $102,000 and $110,000, spot ETFs would be consistently recording massive net inflows, absorbing the supply being offered by sellers.
This dynamic is a textbook example of healthy consolidation. It is a tug-of-war where the immense selling pressure from profit-takers is effectively matched by the persistent buying pressure from new institutional entrants. This prevents a sharp price decline and allows the market to methodically transfer coins from one cohort to another without inducing panic. Technically, this phase often forms recognizable patterns like sideways ranges, bullish flags, or ascending triangles, all of which suggest that pressure is building for an eventual breakout to the upside. The decreasing volume during this time indicates that the market is reaching an equilibrium before the next major directional move.
Historical Precedent in a New Era
Bitcoin has experienced consolidation phases after breaking previous major milestones, such as $1,000 and $20,000. However, the current hypothetical consolidation above $100,000 is fundamentally different in both scale and participants. Previous cycles were largely driven by retail investors and a smaller group of early adopters. The current cycle is defined by the heavyweight presence of institutional players who bring not only massive capital but also a long-term strategic investment horizon.
The amount of capital required to absorb selling pressure at a six-figure price point is orders of magnitude greater than in any previous cycle. The fact that the market can achieve this stability highlights the depth and maturity it has developed. While past consolidations were precursors to further retail-driven mania, the current phase is about the systematic absorption of early investor supply by the largest financial institutions in the world, setting the stage for a rally built on a much stronger and more diverse foundation. This isn't just a pause; it's the construction of a launchpad for the next chapter in Bitcoin's story.
Part 2: The "Great Transfer" - Long-Term Holders vs. Wall Street
At the heart of the market's current dynamic is a historic transfer of wealth. This is the moment where the earliest and most steadfast believers in Bitcoin, the "OG Whales" or Long-Term Holders (LTHs), are realizing their life-changing gains by selling to the new behemoths of the financial world: Wall Street institutions. This process is not the bearish signal it might imply, but rather a critical market function that fuels the bull run's continuation.
Defining the Players: "OG Whales" and Long-Term Holders
Long-Term Holders (LTHs) are typically defined in on-chain analysis as addresses that have held their Bitcoin for more than 155 days (approximately five months). These are investors who have weathered significant volatility and have a deep conviction in the asset. "OG Whales" are a subset of this group, representing individuals or entities who accumulated vast amounts of Bitcoin in its nascent stages, often at prices of three figures or less. For them, selling at over $100,000 represents astronomical returns on their initial investment.
Their motivation to sell is rational and expected. It is a common market pattern for patient bottom buyers to take profits as the market approaches and surpasses new all-time highs. They understand that the euphoria surrounding these record prices is what attracts the necessary buy-side demand to absorb their large sell orders. This selling, or "distribution," is a hallmark of every Bitcoin bull market peak. The key question is whether the demand is strong enough to absorb this supply without crashing the price.
Deconstructing the "Dumping on Wall Street" Narrative
The essence of this transfer is that since the launch of spot Bitcoin ETFs, LTHs have been the primary source of selling pressure. They are, in effect, providing the liquidity that the newly launched ETFs require to meet the relentless demand from their clients.
This dynamic is precisely why the price has been able to stabilize at such high levels. The institutional buying frenzy is absorbing the supply unloaded by LTHs. This is not a malicious act of suppression but a symbiotic relationship: LTHs need massive buyers to sell to, and Wall Street needs massive sellers to source coins from. This is simply the natural ebb and flow of a market cycle where supply and demand are meeting at a new, higher equilibrium.
On-Chain Evidence of a Healthy Distribution
Several on-chain metrics provide a clear window into this phenomenon, confirming that the current selling is a sign of a healthy bull market, not an impending top.
• Spent Output Profit Ratio (SOPR): This metric shows the degree of realized profit for all coins moved on-chain. In this scenario, the LTH-SOPR would be extremely high, indicating that the coins being sold were acquired at a much lower cost basis and are now being sold for massive profits. While this signals profit-taking, it is typical of a bull market and, on its own, does not signal a top.
• Realized Profit: On-chain data would show a massive spike in realized profits, confirming that sellers are locking in gains. The market's ability to absorb these profits and continue consolidating is a sign of immense strength.
• Coin Days Destroyed (CDD) / Value Days Destroyed (VDD): These metrics measure the activity of older coins. A spike in VDD is synonymous with the LTH cohort spending their coins. This typically peaks shortly after breaking all-time highs because sellers need the liquidity that new buyers bring. The fact that this selling is being met with such strong institutional demand prevents it from turning into a bear market trigger.
• Long-Term Holder Supply: While some LTHs are selling, the overall supply held by this cohort may still be growing or stabilizing. This is because investors who bought six months prior are continuously "aging" into LTH status. This indicates that while the oldest hands are selling, a new generation of convicted holders is forming, providing a solid foundation for the market.
In essence, the "great transfer" is a feature, not a bug, of the current bull market. It is a sign of Bitcoin's maturation, where the asset is moving from the strong hands of early pioneers to the deep pockets of the global financial system. This process allows the market to de-risk, shed its over-leveraged players, and build a stronger base for what many believe is the inevitable next leg up.
Part 3: The Path to $109K and Beyond - Technical and Liquidity Analysis
With the market having established a strong foundation above $100,000, all eyes turn to the next key resistance levels. Technical and on-chain analysis points to a significant cluster of liquidity around the $109,000 mark, which is viewed as the final hurdle before Bitcoin can enter a new phase of price discovery. The argument for the "inevitability" of a new all-time high rests on a confluence of bullish technical patterns, resetting momentum indicators, and the overwhelming force of market liquidity.
Understanding Liquidity at $109,000
In financial markets, liquidity refers to the ease with which an asset can be bought or sold without causing a significant price change. On a price chart, liquidity is concentrated at levels with a high density of buy and sell orders. The area around $109,000 to $111,000 represents a major liquidity cluster. This is composed of:
• Sell Orders (Asks): A large number of investors who bought at lower prices have placed take-profit orders at this psychological and technical level.
• Short Position Liquidations: Traders who are betting against Bitcoin have placed their stop-losses above this resistance. If the price breaks through, these short positions are automatically closed with a buy order, creating a "short squeeze" that adds explosive fuel to the rally.
Analysis of order book data shows significant liquidation levels stacked just above this zone. Successfully breaking through and absorbing this sell-side liquidity would remove a significant barrier, clearing the path for a rapid move higher. A decisive flip of the $109,000 level from resistance to support is what bulls are watching for as the ultimate confirmation of upward momentum.
Bullish Technical Indicators
The consolidation phase has allowed Bitcoin's technical indicators to cool off and prepare for the next advance.
• Chart Patterns: On higher timeframes, the price action is forming classic bullish continuation patterns. There is potential for formations like an inverted head-and-shoulders pattern or a bullish engulfing candlestick, both of which have historically high success rates in predicting upward moves. A bullish engulfing pattern on the daily chart, for instance, has shown a high probability of leading to new local highs when appearing in a broader uptrend.
• Momentum Oscillators: Indicators like the Relative Strength Index (RSI) and the MACD (Moving Average Convergence Divergence) have likely reset from "overbought" conditions during the consolidation. This reset is healthy and necessary, allowing momentum to build again from a neutral base rather than an overheated one. It signals that the market has shed its speculative froth and is ready for a more sustainable trend.
• Moving Averages: Throughout the consolidation period, the price would find strong support at key moving averages, such as the 21-week exponential moving average (EMA) or the 50-day simple moving average (SMA). These levels act as dynamic support, with dip buyers consistently stepping in, reinforcing the strength of the underlying trend.
•
The "Inevitability" Thesis Synthesized
The argument that a new all-time high is "inevitable" is built on the convergence of these powerful forces:
1. Unprecedented Demand: The constant, price-agnostic inflows from spot Bitcoin ETFs provide a demand floor that the market has never experienced before.
2. Supply Absorption: The selling pressure from long-term holders, which would have crushed the market in previous cycles, is being successfully absorbed by this new institutional demand.
3. Healthy Reset: The market has undergone a healthy consolidation, allowing technicals to cool off, leverage to be flushed out, and a strong support base to be built.
4. Psychological Breakthrough: The conquest of the $100,000 level has fundamentally altered market perception and opened the door to price discovery, with the next logical target being the liquidity pool at $109,000.
While no outcome in financial markets is ever truly guaranteed, the confluence of persistent institutional buying, constructive on-chain dynamics, and bullish technical setups creates a powerful case that Bitcoin is coiling for a significant breakout. The move through $109,000 is seen not as a question of "if," but "when."
Part 4: Risks and Counterarguments
Despite the overwhelmingly bullish sentiment in this hypothetical scenario, a prudent analysis requires examining the potential risks and counterarguments that could challenge or delay the ascent to new all-time highs. The cryptocurrency market remains susceptible to a variety of internal and external shocks, and overconfidence can be a precursor to sharp corrections.
Macroeconomic Headwinds
Bitcoin's increasing integration into the global financial system means it is more sensitive to macroeconomic conditions than ever before. A sudden and severe global recession, an unexpected spike in inflation leading to aggressive monetary tightening by central banks, or major geopolitical conflicts could trigger a "risk-off" event across all asset classes, including Bitcoin. Investors might flee to the perceived safety of cash or government bonds, causing even the strong institutional demand for Bitcoin to waver. It is often noted that traders wait for clarity on key macroeconomic data and policy updates before committing to a trend, and any negative surprises could trigger a sell-off.
Overwhelming Profit-Taking
The thesis of a new all-time high hinges on the ability of institutional demand to absorb the selling from long-term holders. However, there is a risk that this supply could become too overwhelming. The profits held by early investors are immense, and there may be a price point—perhaps on the approach to $110,000 or just beyond—where profit-taking accelerates to a pace that even the ETFs cannot sustain. If a large cohort of whales decides to sell in unison, it could create a supply shock that temporarily breaks the market structure and forces a deeper correction.
Market Exhaustion and Valuation Metrics
While consolidation is healthy, a prolonged sideways period can sometimes signal exhaustion rather than accumulation. On-chain metrics that compare Bitcoin's market value to its realized value are crucial for gauging how overheated the market is. These tools help identify periods of extreme overvaluation. If such metrics were to enter their highest zones, it would suggest that the market is reaching peak froth, making it vulnerable to a sharp reversal, regardless of the positive narrative. It is understood that while Bitcoin's price has a strong correlation to global liquidity, internal market dynamics can cause it to decouple, especially during periods of extreme valuation.
Regulatory and Black Swan Risks
The risk of unforeseen "black swan" events always looms over the market. This could include a sudden and harsh regulatory crackdown in a major jurisdiction, the collapse of a major crypto exchange or institution, or the discovery of a critical flaw in the Bitcoin protocol itself. Furthermore, the concentration of Bitcoin within a few large ETF products, while providing demand, also introduces a new vector of risk. If these institutions were to face regulatory pressure or decide to offload their holdings for strategic reasons, the resulting sell pressure could be catastrophic.
In conclusion, while the path to a new all-time high appears clear and well-supported by current dynamics, it is by no means guaranteed. A combination of adverse macroeconomic shifts, overwhelming selling pressure, extreme valuations, or an unexpected black swan event could easily derail the bullish momentum. Investors and analysts must remain vigilant, balancing the optimistic on-chain and technical data with a realistic appreciation of the inherent risks in this volatile asset class.
Conclusion
The hypothetical scenario of Bitcoin consolidating above $100,000 while eyeing a breakout to $109,000 and beyond represents a pivotal moment in the asset's history. It paints a picture of a market that has achieved a new level of maturity, driven by a paradigm shift in its investor base. The central thesis—that a new all-time high is now "inevitable"—is not born from baseless hype, but from a powerful confluence of observable market forces.
The successful establishment of the six-figure price level as a support floor, rather than a speculative peak, is the first pillar of this argument. This consolidation is made possible by the voracious and sustained demand from Wall Street institutions, which are using spot Bitcoin ETFs to absorb the immense selling pressure from early adopters. This dynamic, the "great transfer" of Bitcoin from OG whales to institutional treasuries, is not a sign of a market top but a healthy and necessary distribution that de-risks the market and fuels the next leg of the bull run.
The on-chain analysis provides a framework for understanding this phase not as stagnation, but as a constructive consolidation where the market builds energy for a parabolic advance. This narrative is supported by bullish technical patterns, resetting momentum indicators, and a clear liquidity target at $109,000, which, once breached, could trigger a powerful short squeeze and propel Bitcoin into a new phase of price discovery.
However, this bullish outlook must be tempered with an awareness of the significant risks that remain. Macroeconomic instability, the sheer scale of potential profit-taking, and the ever-present threat of regulatory or black swan events could challenge the prevailing trend.
Ultimately, this analysis reveals a Bitcoin that is at a crossroads, but one where the path forward appears more clearly defined and well-supported than ever before. The interplay between the old guard of crypto and the new titans of finance is forging a stronger, more resilient market. While no outcome is certain, the evidence strongly suggests that Bitcoin is not at the end of its run, but is merely pausing to build a higher launchpad for its journey into the financial mainstream.
Bitcoin Closed the week with a strong Green candle...now ?PA has been trying to get over that bold trendline since Feb 2024.
It is the same line that PA used back in 2021, to bounce up to the Cycle ATH in Nov 2021.
And we have begun th e week just on Top of it, as we can see in the Zoomed in version of the chart below.
This week is a Big one in many ways.
We also have the Month close today and currently, we have a Big Green candle for that .
If we close with that, historically, it points towards an unsettled summer or a Big push en-route.
More on that tomorrow.
The weekly MACD still has room to climb but I still think we are to see a repeat of where that arrow points.
Th weekly RSI is also in Mid ground and can move in either direction
One thing that has really caught my eye however, is the Volume Delta
See how this is reducing - Could this be the Calm before the Storm ?
And that storm could be Bullish or Bearish. We do have a number of lines of resistance overhead that could prove difficult.
So, hang in there.
My personal opinion is that we are going to see apull back in the near future,,,,,and if we close the month green today, that WILL be next week

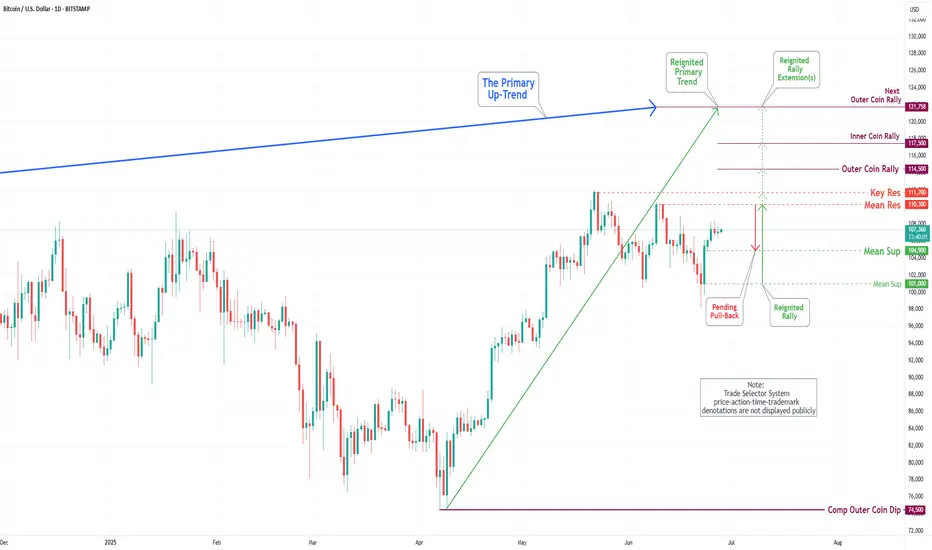
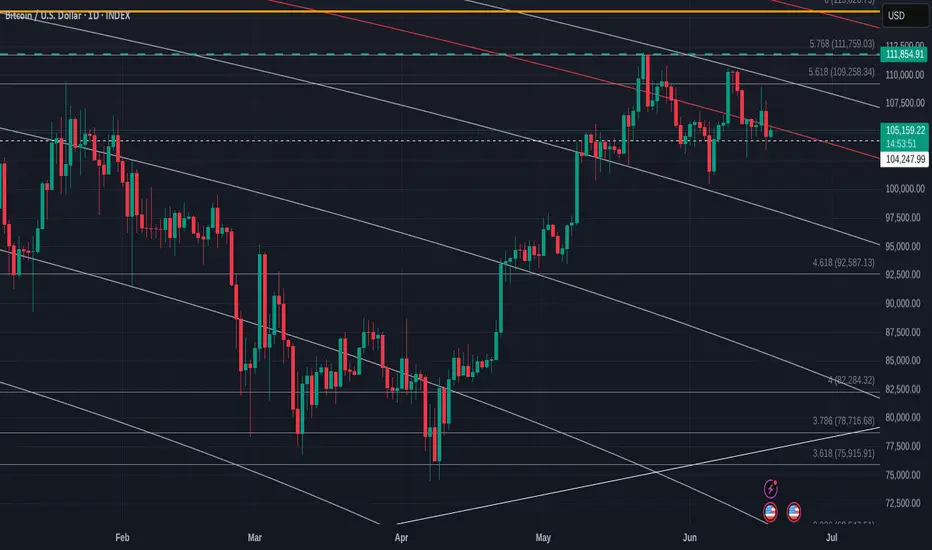
Bitcoin(BTC/USD) Daily Chart Analysis For Week of June 27, 2025Technical Analysis and Outlook:
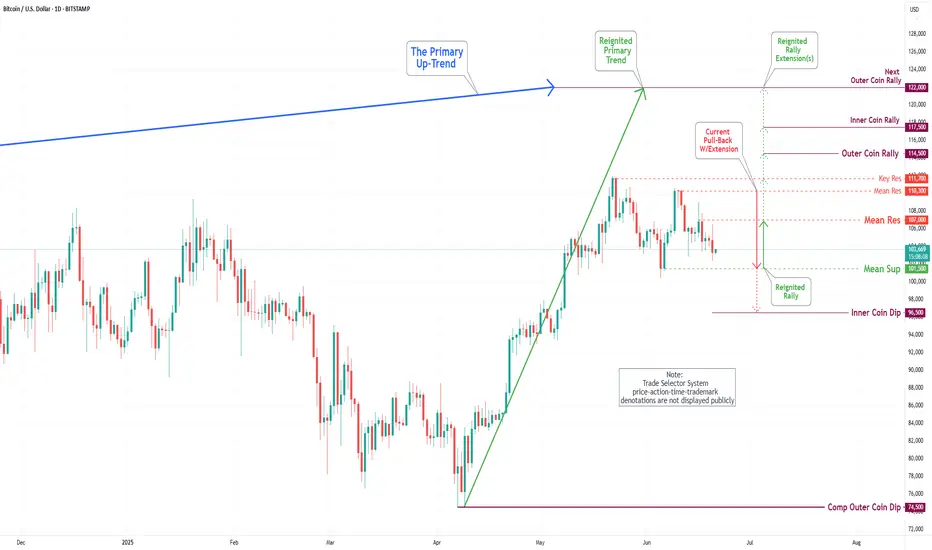
Throughout this week’s trading session, Bitcoin has demonstrated an upward trajectory and is positioned to achieve the specified targets of Mean Resistance 110300 and Key Resistance 111700. This progression may ultimately culminate in the realization of the Outer Coin Rally 114500 and beyond. Nevertheless, it is crucial to recognize the possibility of a subsequent decline from the current price to the Mean Support level of 104900 before a definitive upward rebound.
Bitcoin Targets $105K as Portfolio Share Soars But...
The year 2025 is proving to be a watershed moment for Bitcoin. The world's premier cryptocurrency has solidified its position as the bedrock of digital asset portfolios, now accounting for nearly one-third of all holdings, a testament to its growing acceptance as a legitimate macro-asset. Yet, this rising dominance belies a fractured and complex market landscape. While institutional giants and sovereign wealth funds systematically increase their Bitcoin allocations, a counter-current is flowing through the retail sector, where investors are rotating into high-potential altcoins, spurred on by the promise of new investment vehicles. This bifurcation is unfolding against a backdrop of dramatic price swings, conflicting technical forecasts, and a potent mix of macroeconomic and geopolitical catalysts, painting a picture of a market at a pivotal crossroads.
The headline statistic is striking: as of mid-2025, Bitcoin's share in investor crypto portfolios has climbed to nearly 31%, a significant increase from the previous year. This growth has persisted through months of volatility, including harrowing dips below the psychological $100,000 mark and powerful rallies reclaiming levels above $105,000. The market is being pulled in opposing directions. On one hand, bullish tailwinds are gathering force. A ceasefire in the Middle East has calmed geopolitical jitters, restoring appetite for risk assets. Simultaneously, hints from the U.S. Federal Reserve of a potential July interest rate cut have investors anticipating a surge of liquidity into the market.
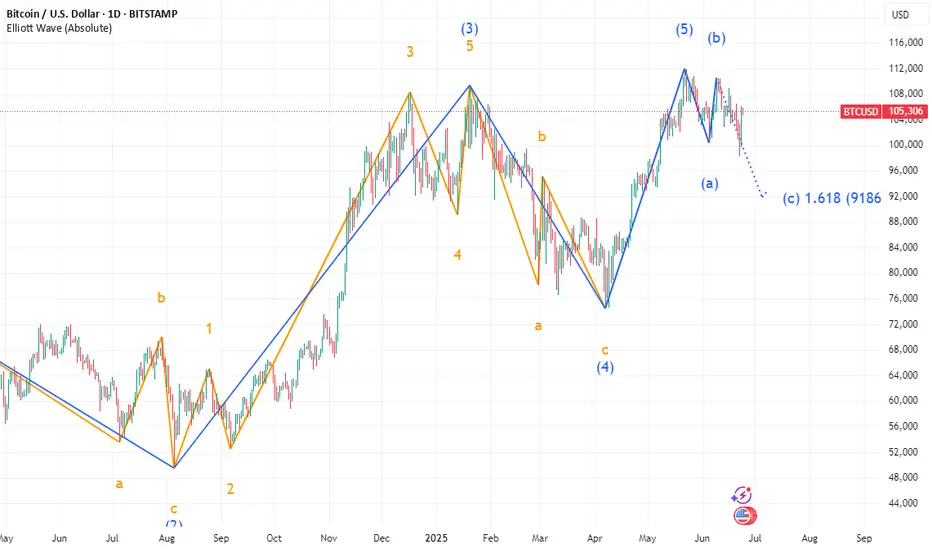
However, a sense of unease permeates the technical charts. Some analysts warn of a "final crash" still to come, drawing parallels to the market structure of 2021. On-chain analysis has identified the $97,000 to $98,000 range as a critical market pivot, a line in the sand that could determine the next major trend. Meanwhile, other models, like the Elliott Wave count, predict a corrective crash to as low as $94,000 before any new highs can be sustainably achieved.
This is the story of Bitcoin in 2025: a maturing asset cementing its institutional role while navigating the turbulent waters of retail speculation, macroeconomic shifts, and its own volatile price cycles. The journey toward becoming a third of all crypto holdings has not been a straight line, but a dramatic tug-of-war that will define the future of the digital asset class.
Part 1: The 31% Benchmark - Bitcoin's Ascendant Portfolio Dominance
The steady climb of Bitcoin to nearly 31% of investor portfolios is the defining trend of 2025. This figure, a cornerstone of market analysis this year, underscores a profound shift in investor conviction. Through a period marked by six-figure price tags and gut-wrenching volatility, the average investor has not been scared away but has instead deepened their commitment to the original cryptocurrency. This suggests a maturing "buy the dip" mentality, where price corrections are increasingly viewed not as a crisis, but as an opportunity to accumulate a long-term store of value.
The primary engine behind this trend is unmistakable: institutional adoption. The floodgates, first opened by the launch of spot Bitcoin ETFs, have become a torrent of institutional capital in 2025. Sovereign wealth funds, major financial institutions, and public companies are now systematically accumulating Bitcoin, treating it as a core component of their treasury and investment strategies. Observations of institutional trading desks indicate this buying pressure from large-scale investors intensified in the first half of the year, even as retail activity showed signs of slowing. This institutional stamp of approval is reflected in the growing number of Bitcoins held in various corporate treasuries and exchange-traded funds.
This institutional embrace of Bitcoin has been fueled by several factors. First, an increasingly innovation-friendly regulatory environment in the United States has provided the clarity that large, compliance-focused firms require. Second, Bitcoin’s performance has been undeniable. Following recent shifts in the political landscape, Bitcoin has outperformed many major global assets, including stocks, treasuries, and precious metals, solidifying its reputation as a powerful portfolio diversifier.
This "flight to quality" within the crypto space has also created a distinct rotation story. As institutions fortify their Bitcoin positions, they appear to be de-risking by moving away from more speculative assets that were darlings of the previous cycle. The most notable casualty of this shift has been Solana. Once a high-flyer, Solana's narrative has "cooled" in 2025. Its portfolio weight among investors has seen a sharp decline since late 2024, as institutional capital pivots toward assets with perceived staying power and clearer narratives. While some analysts see this cooling phase as a potential accumulation opportunity before a new leg up, the dominant trend has been a rotation out of Solana and into the perceived safety of Bitcoin.
Part 2: The Great Divide - A Tale of Two Investors
The crypto market of 2025 is characterized by a stark divergence in strategy between its two main cohorts: institutional players and retail investors. While their actions collectively push Bitcoin's portfolio share higher, their underlying motivations and asset choices paint a picture of two different worlds.
The Institutional Playbook: Slow, Steady, and Strategic
For institutions, Bitcoin has become the undisputed king. Their approach is methodical and long-term, driven by a desire for a non-sovereign, inflation-resistant asset that acts as a hedge against macroeconomic instability. The attributes of scarcity, immutability, and portability are paramount in their decision-making. The advent of regulated products like spot ETFs has been a game-changer, providing a familiar and secure access ramp for deploying significant capital.
These large players are not chasing the explosive 100x gains that define crypto lore. Instead, they seek sustained, risk-adjusted returns from an asset that is increasingly uncorrelated with traditional markets during times of stress. Their strategy is one of accumulation, and their exit from more volatile altcoins like Solana is a clear signal of a de-risking mandate. They are building foundational positions in the asset they view as "digital gold," positioning themselves for a future where Bitcoin is a standard component of diversified global portfolios.
The Retail Rebellion: Chasing the Next Big Narrative
In stark contrast, retail investors appear to be reducing their direct Bitcoin holdings. This is not necessarily a rejection of Bitcoin's value, but rather a strategic reallocation of capital toward what they perceive as the next frontier of high growth. Having witnessed Bitcoin's journey to a multi-trillion-dollar asset, many retail participants are now hunting for "the next Bitcoin"—assets with a lower market capitalization but a powerful, near-term catalyst that could trigger exponential gains.
Part 3: The Analyst's Crystal Ball - Price Targets and Technical Tremors
Navigating the Bitcoin market in 2025 requires a steady hand and a tolerance for conflicting signals. While macro-environmental factors are painting a bullish picture, technical and on-chain analyses are flashing cautionary signs, creating a tense equilibrium between hope and fear.
The Bullish Case: A Confluence of Catalysts
The bulls have strong reasons for optimism. A key level on every trader's chart is $105,000. This price is seen as a critical "trend switch"; a decisive break and hold above this zone would signal the end of the recent consolidation and the beginning of a new, powerful phase of the bull market. This optimism is underpinned by powerful external forces.
First, the U.S. Federal Reserve has been signaling a potential interest rate cut as early as July. Historically, lower interest rates reduce the appeal of traditional yielding assets like bonds, pushing investors toward riskier, high-growth assets. This injection of liquidity into the financial system has often preceded significant rallies in Bitcoin, and the market is pricing in this possibility.
Second, a significant de-escalation of geopolitical tensions has bolstered market confidence. The announcement of a ceasefire between Israel and Iran caused an immediate and positive reaction in risk assets. Bitcoin surged past $105,000 on the news, demonstrating its sensitivity to global stability. During times of acute conflict, markets often experience a flight to safety, but when tensions ease, that capital flows back into assets like Bitcoin, which thrive on renewed risk appetite.
The Bearish Counterpoint: Echoes of the Past and On-Chain Warnings
Despite the bullish macro-outlook, clouds remain on the horizon. Some market commentators are warning that the current market is mirroring the patterns of 2021, suggesting that one "final crash" may be necessary to flush out leverage and establish a firm bottom before a sustainable move to new all-time highs.
This thesis is supported by specific technical models. Proponents of Elliott Wave Theory, a method of analysis that posits markets move in predictable, repetitive wave patterns, suggest a significant correction is due. Some Elliott Wave counts predict a corrective move down to the $94,000 level, which would represent a substantial pullback from current prices. Such a move would be seen as a healthy, albeit painful, corrective wave before a final, explosive impulse higher.
Adding weight to this cautious outlook is deep on-chain analysis. A close look at blockchain data pinpoints the $97,000 to $98,000 zone as the market's next true "pivot." This range represents a massive concentration of supply where a large volume of Bitcoin was previously acquired. This means a large cohort of investors has a cost basis in this zone. As the price approaches this level from below, it will likely meet significant selling pressure from investors looking to break even. A failure to decisively break through this wall of supply could trigger a sharp rejection and validate the bearish corrective scenarios.
The Derivatives Dilemma: A Market in Flux
Further complicating the picture is the state of the Bitcoin derivatives market. Reports indicate that futures buying activity has declined sharply, suggesting that the speculative fervor that often fuels rallies may be waning. This can be interpreted in two ways. The bearish view is that speculators are losing confidence, and the market lacks the momentum for a continued push higher. However, a more bullish interpretation is that the market is purging excessive leverage, creating a more stable foundation for a rally built on spot buying—the very kind of buying being done by institutions. This faltering derivatives activity, contrasted with strong institutional spot accumulation, could mean the current rally is in "stronger hands" than previous, more speculative-driven cycles.
Part 4: The Broader Ecosystem - A Story of Diverging Fates
The cross-currents shaping Bitcoin's trajectory are creating ripple effects across the entire crypto ecosystem, with the diverging fortunes of XRP and Solana serving as perfect case studies for the market's 2025 themes.
Beyond the Majors: The Speculative Fringe
As always, the crypto market maintains a speculative fringe. The emergence of assets like "BTC Bull Tokens" represents the high-leverage, high-risk plays that appear during bull markets. These instruments are designed to offer amplified returns on Bitcoin's price movements and attract the most risk-tolerant traders. Their existence underscores the full spectrum of the market—from sovereign wealth funds methodically buying Bitcoin for their treasuries to degens betting on leveraged tokens, the digital asset ecosystem remains a place of immense diversity and opportunity.
Conclusion: Bitcoin's Maturation in a Fractured Market
The year 2025 will be remembered as the year Bitcoin truly came of age as an institutional asset, firmly planting its flag and claiming one-third of the crypto investment landscape. This growing dominance, driven by the steady, strategic accumulation of the world's largest financial players, has provided a powerful anchor in a volatile market.
Yet, this newfound maturity has not tamed the market's wild spirit. It has instead created a great divide. While institutions build their Bitcoin fortress, retail investors are on the hunt for the next narrative-driven explosion, pouring capital into assets like XRP with the hope of front-running a transformative ETF approval.
The market is consequently balanced on a knife's edge. Bullish macroeconomic and geopolitical tailwinds are pushing for a breakout to new all-time highs beyond the pivotal $105,000 level. At the same time, technical and on-chain analyses warn of a potential final washout, a corrective crash to the mid-$90,000s that may be necessary to reset the market for a sustainable ascent.
Bitcoin's path forward will be carved by the resolution of these opposing forces. Can the quiet, persistent demand from institutions absorb the selling pressure from short-term traders and navigate the technical resistance zones? Or will the speculative fervor and corrective patterns that have defined its past cycles pull it down once more before it can climb higher? Whatever the outcome, 2025 has made one thing clear: Bitcoin is no longer just a speculative digital curiosity. It is a global macro asset at the heart of a complex and evolving financial ecosystem, and its journey is far from over.
Bitcoin Closed week RED and opens Green but is back in channel
As the title says, BTC PA has fallen back in channel that offers a potential low in the High 80K should confidence fail.
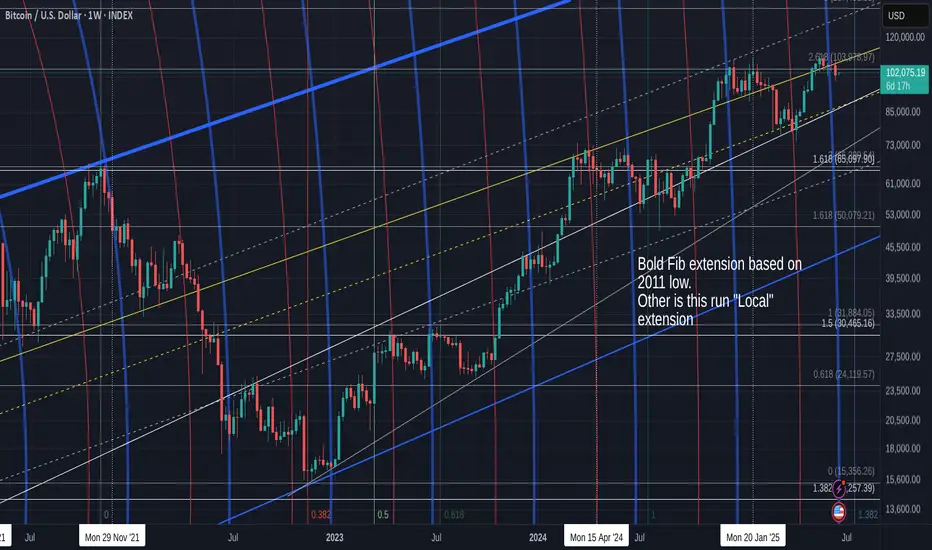
PA also lost support on the Local 2.618 Fib extension.
This is a shame and poses potential problems reclaiming that.
I will say, that I do not consider this a long term Bearish beginning but it could certainly add to the "Calm" Summer I have talked about.
I say "Calm", that does depend on the world not entering a level of Madness.
The Zoomed chart below shows more detail
Here we can see clearly how PA got rejected off that upper trend line, fell through the 2.618 and is currently being rejected by it.
The potential for a further drop does exist and if we repeat the "Pattern" we have since the beginning of 2024, of bounce off Lower trend line, get rejected from Upper zone, re test lower as support and bounce again, we can expect to revisit 89K
This idea is supported from this LINEAR Daily chart
The dashed Trend line that is arrowed has origin in Sep 2024 and was also used again in April 2025.
That intersection the arrow points to is the intersection with the current supporting Fib circle at around 88500 USD
None of this is certain but these levels exist as support.
PA also has the ability to move higher
The Weekly MACD below shows us how MACD is turning down towards its signal line ( red)
We did this before in Jan 2024 ( Arrow) and The MACD bounced.
We talked about this possibility a few weeks ago But on a Daily MACD, things do look a little different.
The FEB 2024 looked like this, Bullish, rising and above Neutral
Currently, the Daily MACD looks like this
We just fell below Neutral and the Signal line just hit it
We may seea bounce but we need to have the idea that this may continue to drop a little further.
But the White bar on the Histogram shows us some recovery is currently in progress
We will have to watch the rest of this month closely. This time next week is last day of month.
I have mentioned a number of times that a small RED Month candle would be potentialy good.
We are currently Only just GREEN, so a further Drop in price is actually almost expected this week.
Interesting days ahead
BTC posibility if fundamental favoursBTC posibility if fundamental favours.
This baby has beenrushing downhill for afew days now.
As always, my thoughts are on the chart.
Please trade this RR of 1:1.69 with care
Bitcoin(BTC/USD) Daily Chart Analysis For Week of June 20, 2025Technical Analysis and Outlook:
In the recent trading session, Bitcoin exhibited an upward trend; however, it subsequently experienced a significant decline from the established Mean Resistance level at 110300. On Friday, Bitcoin exhibited notable price action, characterized by a pump-and-dump scenario. At this juncture, Bitcoin is retracing downwards as it seeks to approach the Mean Support level at 101500 and the ultimate Inner Coin Dip at 96500. It is essential to acknowledge the potential for an upward rally from the Mean Support levels of $101500 and/or the Inner Coin Dip at $96500. Such a rally could culminate in a retest of the Mean Resistance level at $107000.
EIGEN/USDT – Falling Wedge Breakout Setup | 4H ChartEIGEN is currently showing a bullish falling wedge pattern near a strong horizontal demand zone, indicating a potential reversal move.
Technical Breakdown:
Entry Zone: $1.17 – $1.18 (current market price)
Stop-Loss: Below $1.14 (last wick low/invalidation of wedge)
Target Price: $1.74, $2.51 (+118%) from CMP
Resistance 1 (Minor): $1.33
Resistance 2 (Major Target): $1.74
Support Levels:
• $1.17 (Immediate support)
• $0.749 (Major demand zone if breakdown)
Target & Risk-Reward
Target Price: $1.74, $2.51 (+118%) from CMP
Stop-Loss: $1.14
Risk per token: ~$0.03
Potential Profit per token: ~$0.56
Risk:Reward Ratio: ~1:6.5
Potential Gain: +118% from entry
Indicators:
Falling wedge breakout looks imminent
RSI (14) at 39.5 — recovering from oversold zone
Demand zone previously triggered rallies — the probability of a bounce is high
Strategy:
Wait for a 4H candle close above the wedge trendline + volume confirmation to validate the breakout. Scaling in near support with a tight stop-loss can offer a strong risk-reward play.
Not Financial Advice – This is a technical view for educational purposes. Always DYOR & manage risk accordingly.
Like & follow if you found this useful!
#EIGEN #Altcoins #Breakout

Bitcoin Daily Linear chart getting Squeezed on FED day - Caution
Those Fib circles are showing their strength again.
See how PA is pushed by them 99% of the Time.
And right now, we see PA ina tight Squeeze between horizontal Local support and that falling red 236 fib circle.
The Apex of that Bearish pennant is near the end of this month.
And, Today, depending on how Markets react to the FED Rate decision, PA could break away from this
A Push higher will meet resistance around 109K
A Drop lower would find support around 100K - 98K
And if I am going to show a Bearish side, a drop to the 4.618 at 92K is VERY possible given Macro events
We live in Hope that the Bulls Will show up
BTC/USDT in Consolidation: How To Trade the RangeBitcoin (BTC/USDT) is currently in a clear consolidation phase on the 4-hour chart 📊. Price action is trapped within a well-defined range, and for now, no dominant trend has emerged — we’re simply trading sideways between key support and resistance levels 🔁
In the video, we dive into how to tactically approach this kind of environment by trading the lower time frame trend shifts within the range — focusing on lower timeframe moves from range highs to range lows, and vice versa ⬆️⬇️
We also reference the broader macro picture — looking at the NASDAQ (US100) and the Magnificent 7 (MAGS) for potential clues about Bitcoin’s next directional move 🧠💡. Risk-on or risk-off sentiment in these key tech equities often correlates with Bitcoin’s momentum, making them critical confluence factors for BTC traders.
For now, the strategy is to remain range-conscious and reactive, rather than predictive. Until we get a confirmed breakout or breakdown, patience and precision remain key 🎯

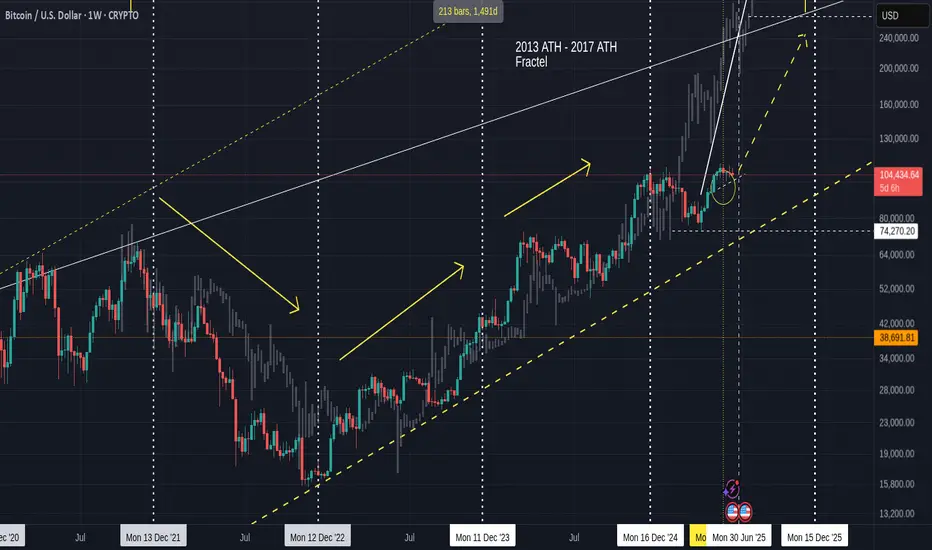
Bitcoin in expected price zone, may go lower then UP ?
This is the old fractal chart and I have faded out the Fractal from 2013 to 2017,
Everything ese remains unchanged since Feb this year.
We hit the expected price range indicated by the circle and we are still in that area but I expect, once the month closes and we have a small red month candle, then we can start printing Green again.
The daily version of this chart shows us more local detail
We have left the area of resistance and so now, we have a free move BUT I think we may dip down to that line of support around 100K - 98K
This would not be a bad thing to do before the end of the month as it would cool off the PA / RSI and MACD and so give confidence to the serious investor while scaring the pats off the New guys and Gals.
The Daily MACD still has a way to dip before it may find support on the neutral line
This level could see PA near that line of support but it is possible for MACD to drop while PA ranges.
So we could see that Dip to line of support and it may offer the last 100K buying zone for a very long time ..
But we do have Stupid people trying to start WW3 with Lies and Greed - this could possibly destabilise things.
Be Cautious
The market recently managed to close above the Breaker Block!Bitcoin Market Update (Extended & Insightful):
The current update for Bitcoin remains largely the same as the previous one. However, there have been some slight yet significant shifts in the market behavior.
The market recently managed to close above the Breaker Block (BPR), which initially seemed like a bullish signal. But as it approached the overhead supply zone, it faced strong rejection and started to decline again. This shows that sellers are still active at higher levels.
Right now, the market is treating the BPR as an inversion level, meaning it’s testing it as potential support. This level is crucial for determining Bitcoin's next move.
🔍 So, what’s the best approach now?
Patience is key at this point. The ideal strategy is to wait and watch. Let the market clearly break either the upper supply zone (which would confirm bullish momentum) or the lower BPR zone (indicating a bearish trend). Only then can we expect a strong directional move.
Until one of these key levels is decisively broken, Bitcoin is likely to continue consolidating within this range — moving sideways without a clear trend.
🧠 DYOR — Do Your Own Research!
Always analyze before making any trading decisions.

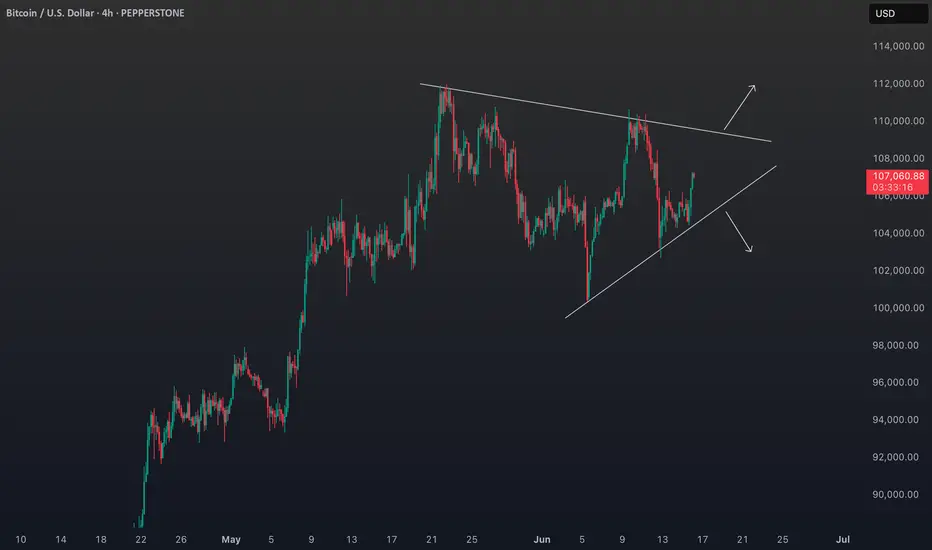
Bitcoin (BTC)and NASDAQ: Intermarket Analysis and the Road AheadIn this four-hour BTCUSD chart, Bitcoin is currently consolidating within a symmetrical triangle pattern ⏳. The price is oscillating between a series of lower highs and higher lows, with the most recent swing high and swing low serving as key reference points for traders. This pattern reflects a market in indecision, awaiting a catalyst for a breakout.
Volume has picked up as price approaches the previous low, suggesting that buyers are stepping in to defend this area, rather than capitulating.
The next significant move will likely be determined by whether price can break above the last swing high or fall below the last swing low. A breakout above the previous high could open the door for a renewed uptrend, while a breakdown below the previous low may signal a deeper correction.
Geopolitical & Fundamental Backdrop 🌍
Bitcoin’s current consolidation is happening against a backdrop of heightened macro and geopolitical uncertainty. Recent global events, such as tensions in the Middle East and shifting US economic data, have contributed to increased volatility across risk assets. Institutional interest in Bitcoin remains strong, and the asset continues to be viewed as a hedge against inflation and currency debasement. However, short-term sentiment is sensitive to headlines and policy shifts.
NASDAQ & Correlation with Bitcoin 📈
The NASDAQ and Bitcoin remain closely correlated, especially during periods of heightened risk-on or risk-off sentiment. The NASDAQ has recently been consolidating after a strong rally, with price action also defined by a series of lower highs and higher lows. The index’s outlook is currently neutral to cautiously bullish, mirroring Bitcoin’s technical structure. If the NASDAQ can break above its recent high, it could provide a tailwind for Bitcoin and other risk assets. Conversely, a move below the last swing low in equities could trigger further caution in crypto markets.
Summary & Outlook 🚦
BTCUSD is at a pivotal juncture, with the next move likely to be determined by a break above the previous high or below the previous low on the four-hour chart.
Macro and geopolitical factors are creating short-term volatility, but the long-term structure remains constructive as long as the broader uptrend of higher lows is maintained.
The NASDAQ’s consolidation and its correlation with Bitcoin suggest that risk sentiment in equities will continue to influence crypto. Watch for confirmation from both markets before taking a directional bias.
Disclaimer:
This analysis is for informational purposes only and does not constitute financial advice. Cryptocurrency and stock markets are highly volatile and subject to rapid change. Always do your own research and consult with a financial advisor before making investment decisions.
Bitcoin closed week RED but that is OK, it was closeFor the last 3 weeks, Bitcoin has been in a tight range and each candle has been small body and long wicks, showing indecision and uncertainty
This close up chart shows how these 3 weekly candles have occurred at the intersection of a Fib circle (blue) and This alone could explain these "wicky" candles... The Bulls have been fighting hard to keep PA up and to not let it slide down that fib circle, as is normal the majority of the time.
.
We shall find out this week because, now, there is not a lot to stop the Bulls trying harder.
The FED will let us know the decision on interest rates on 18th.
This will likely cause a reaction in markets and I think we are most likely to see Rates remain static.
PA is currently on Support and remains above the 2.618 Fib extension.
All is Good
The MVRV (Green) and Z Score (yellow) can be complicated to fully understand but what is important to understand here is how the Yellow Z Score is still above the Green MVRV. this remains Bullish. We should notice how Both are falling and we wait for them to cross back over that falling line of resistance.
Currently, This chart shows us that Bitcoin has a slightly undervalued price. The higher we go, the more Oversold, Undervalued/ the top is the opposite, overbought / over valued.
The MACD is showing us a s;light levelling off
For me, I think this is similar to what we saw in the end of 2024. The MACD may go back down to the Red signal line and bounce....Again, we have to wait and see. Remember, that just because MACD drops, BTC PA does not always follow. We can range across instead
Over all, I am still Bullish long term but we may see some continued uncertainty in this market. The FED decision later this week will have an impact for sure
Bitcoin remains strong though but should circumstances allow, we could revisit 90K on that trend line below current position. I am not to sure this will happen but a good idea t be ready if it does.
What is certain is how PA has never really been in such a "soft" controlled action.
The nearest we have is way back in 2016 to 2016.
At this time period, we also saw BTC PA rise in a slow steady rise, no sharp pushes higher till the final push to ATH.
Currently, we seem to have repeated a similar Acton though. now, for longer
So, we wait and we will find out..

BTC “Golden Cross” Looms, but Geopolitics Could Delay ItBitcoin’s “Golden Cross” Looms, but Geopolitical Shocks Could Delay the Breakout
Deep dive into price action, derivatives, on-chain data, and the tug-of-war between Middle-East risk and crypto bull-run momentum
________________________________________
Table of Contents
1. Executive Summary
2. Scene-Setter: BTC at $105 K in a World on Edge
3. Technical Spark: What a Golden Cross Really Means
4. Price Action: From $103 K Dip to $106.8 K Hurdle
5. Options Market: A Sudden Lurch Toward Puts
6. Macro Overhang: Why Israel–Iran Turmoil Matters to Bitcoin
7. On-Chain Pulse: 656 % Cycle Gain, Yet Supply Is Tighter Than 2021
8. Mining Fundamentals: Difficulty Eases, Margins Improve
9. Corporate Treasuries: The Quiet, Sticky Bid
10. Targets & Scenarios: $97 K Downside vs. $229 K Upside
11. Strategy Playbook for Traders & Investors
12. Conclusion: Delayed, Not Derailed
13. Disclaimers
________________________________________
1. Executive Summary
• Bitcoin (BTC) is trading in a tight $103 K–$108 K band, unable to confirm a breakout as Middle-East tensions push investors into hedging mode.
• A Golden Cross—the 50-day SMA crossing above the 200-day—could flash within 10 trading sessions, historically adding +37 % median upside over the subsequent 90 days.
• Options flow has flipped decisively toward puts, with the 25-delta skew hitting –10 %, its most bearish since the FTX collapse, signaling short-term anxiety even as long-term bets remain bullish.
• On-chain metrics (exchange balances at six-year lows, HODLer supply at all-time highs) reveal structural demand; Glassnode notes a 656 % cycle advance despite a trillion-dollar market cap.
• Analysts’ upside targets range from $140 K (Q3) to $270 K (October) and even $229 K based on the Golden Cross fractal. Yet a clean break of $104 K support opens room to $97 K first.
________________________________________
2. Scene-Setter: BTC at $105 K in a World on Edge
Bitcoin entered 2025 with a blistering rally—spot ETFs hoovered nearly 200 K coins in four months, miners sold aggressively into strength, and macro tailwinds (Fed easing, USD weakness) fueled risk appetite. Then two macro curveballs hit:
1. Sticky U.S. core inflation revived “higher-for-longer” rate fears.
2. Israel–Iran hostilities spooked global markets, sending Brent crude to $76 and sparking a dash for USD liquidity.
BTC, once heralded as “digital gold,” behaved like a high-beta tech stock: it slipped 7 % in 48 hours, tagging $103,200 before bargain hunters stepped in. As of this writing, price sits near $105,800—right on the 100-hour SMA. Whether we escape the range depends on which force proves stronger: geopolitical dread or the long-term structural bid.
________________________________________
3. Technical Spark: What a Golden Cross Really Means
A Golden Cross occurs when the 50-day simple moving average (SMA-50) crosses above the 200-day (SMA-200). In Bitcoin’s 14-year history, we have logged nine such events:
Year Days to Cross 90-Day Return 180-Day Return
2013 51 +88 % +202 %
2015 73 +34 % +67 %
2019 46 +193 % +262 %
2020 38 +77 % +112 %
2023 59 +29 % +48 %
Median 90-day gain: +37 %
Median drawdown post-cross: –12 %
We are ~$700 shy of triggering the cross (SMA-50 at $97.9 K, SMA-200 at $98.1 K and rising). Assuming volatility stays muted, the lines converge within two weeks, potentially firing a widely watched buy signal. But remember: the cross is lagging; smart traders anticipate, not react.
________________________________________
4. Price Action: From $103 K Dip to $106.8 K Hurdle
Key intraday levels (Kraken feed):
• Support 1: $104,000 – prior weekly low + bullish order-block
• Support 2: $101,200 – 0.786 Fib retrace of the Feb–Mar impulse
• Bear Pivot: $97,000 – 200-day EMA + high-confluence volume node
• Resistance 1: $106,800 – last week’s swing high; three failed probes
• Resistance 2: $108,500 – May monthly open
• Bull Pivot: $113,000 – neckline of the March distribution range
Monday’s bounce broke a declining trend-line from $110 K, printing a higher low—constructive, yet bulls require a daily close >$106.8 K to invalidate the short-term bearish structure.
________________________________________
5. Options Market: A Sudden Lurch Toward Puts
Deribit data (largest BTC options venue):
• Put/Call Ratio: 0.62 last Friday → 0.91 today
• 25-Delta Skew (1-month): –10 %, lowest since Nov-2022
• Max-Pain for April 26 expiry: $104 K (huge open interest)
Translation: traders rushed to buy protective puts as Iran war headlines crossed. Market-makers, short those puts, delta-hedged by shorting spot or perpetual futures, adding downward pressure—classic gamma feedback loop.
Yet term structure remains contango; June and September IVs price higher topside. Institutions appear to sell near-dated panic, accumulate long-dated calls—a bullish medium-term stance.
________________________________________
6. Macro Overhang: Why Israel–Iran Turmoil Matters to Bitcoin
1. Risk-Off Correlation: Despite “digital gold” narratives, BTC’s 30-day correlation with the Nasdaq-100 sits at 0.64; equities slide → crypto follows.
2. USD Liquidity Drain: War premium lifts oil, stoking inflation and forcing the Fed to delay cuts; higher real yields pressure non-yielding assets.
3. Regulatory Optics: Heightened national-security chatter emboldens lawmakers keen to scrutinize crypto, a perceived sanctions-evasion channel.
4. Regional Flows: The Middle-East hosts some of the largest sovereign-wealth pools; risk aversion could pause their crypto allocations.
5.
Hence, every missile headline becomes a volatility catalyst. Still, flash-risk events fade quickly if energy supply stays intact, offering windows for BTC to re-assert its secular trend.
________________________________________
7. On-Chain Pulse: 656 % Cycle Gain, Yet Supply Is Tighter Than 2021
Glassnode frames Bitcoin’s ongoing bull as “one of the most explosive relative to market cap gravity.” Highlights:
• Cycle Return: 656 % from the $14 K November-2022 bottom—impressive given the asset is now >$2 T in free-float value, dwarfing 2017’s sub-$100 B base.
• Exchange Balances: Just 2.02 M BTC on centralized venues—13-year low.
• Realized Price (short-term holders): $92,500—suggests marginal buyers remain well in profit.
• Entity-Adjusted Dormancy Flow: At 275 K BTC/day vs. 2021’s 550 K—implying HODLers are less willing to spend.
Put simply: even after a seven-fold rally, supply scarcity persists.
________________________________________
8. Mining Fundamentals: Difficulty Eases, Margins Improve
The April 20 adjustment saw difficulty dip 1.2 %, the first contraction since January. Why it matters:
• Post-Halving Breathing Room: Block subsidy fell to 1.5625 BTC; a difficulty rollback cushions miner profit margins, lowering forced selling risk.
• Hashrate Plateau: Network hashrate hovers at 640 EH/s, only 3 % off the ATH—miners remain confident.
• Transaction Fees: Average fee per block = 0.37 BTC, still elevated by historical standards thanks to BRC-20 activity.
Miners thus appear cash-flow stable, reducing downside pressure on spot markets compared to previous post-halving eras.
________________________________________
9. Corporate Treasuries: The Quiet, Sticky Bid
Since MicroStrategy cracked the dam, 68 public companies now hold BTC on balance sheets, totaling 412,000 coins (~$43 B). Recent newcomers:
Company Purchase Date BTC Added Avg Cost
SemiconX Feb-2025 2,500 $94,800
Nordic Logistics Mar-2025 800 $98,200
Atlantech Energy Apr-2025 1,200 $101,500
Traits of corporate treasuries:
• Long-Dated Liabilities: Align with Bitcoin’s four-year halving cadence.
• Low Turnover: None of the 68 have sold core holdings despite 80 % drawdowns in 2022.
• Regulatory Transparency: SEC filings broadcast purchases, inviting copycat demand.
This sticky bid stabilizes spot markets during macro squalls.
________________________________________
10. Targets & Scenarios: $97 K Downside vs. $229 K Upside
Bearish Path (30 % probability)
• Trigger: Israel–Iran broadens, Fed signals no cuts in 2025.
• Price Action: Break $104 K, bulls capitulate at $97 K (200-day).
• Depth: Could wick to $88–90 K (0.618 retrace) if macro gloom persists.
Base Case (50 % probability)
• Trigger: Skirmishes contained; oil cools, Fed cuts twice by December.
• Price Action: Golden Cross confirms, BTC grinds to $128 K by September.
• Highs: $140 K tap as ETF inflows resume.
Bullish Path (20 % probability)
• Trigger: Middle-East cease-fire + ETF FOMO round two + dovish Fed pivot.
• Fractals: Prior Golden-Cross extensions averaged +120 % at extreme.
• Price Action: $150 K by summer, $229 K (Fib 2.618 from 2022 low) by year-end.
• Blow-Off: $270 K October spike before the next cyclical bear begins.
________________________________________
11. Strategy Playbook for Traders & Investors
Horizon Bias Instruments Risk Management
Intraday (0–48 h) Range scalp $104–$107 K Perp futures (5× max), options gamma scalping Hard stop $103 K; position <1 % equity
Swing (2–8 wks) Buy pullbacks ahead of Golden Cross Spot, dated futures roll, 1-month $110 K calls Stop $97 K daily close; size 5–10 %
Position (3–6 mo) Accumulate for $140–150 K target Spot, June/Sept call spreads ($120/150) Hedge via 25 % put collar
Long-Term (1–4 yr) Maintain core stash; ignore noise Cold storage, DCA Re-balance only when price doubles
Optional hedge: Long Gold / Short BTC ratio spread as a geopolitical shock absorber; ratio 1.3 currently, mean-reverts to 1.1 post-crises.
________________________________________
12. Conclusion: Delayed, Not Derailed
Bitcoin stands at a crossroads: a textbook Golden Cross beckons, ETF inflows smolder, miners relax, and corporate treasuries drip-feed demand. Yet war headlines and a cautious options market act as sandbags on the balloon. History says macro shocks slow, not stop secular bull cycles. Unless Middle-East conflict strangles global liquidity or the Fed slams the brakes far harder than priced, BTC’s higher-time-frame structure remains bullish. Expect turbulence, embrace risk controls—but don’t mistake a weather delay for a busted engine.
________________________________________
13. Disclaimers
This article is for educational purposes only and does not constitute financial advice. Cryptocurrency investing involves substantial risk; never invest more than you can afford to lose.
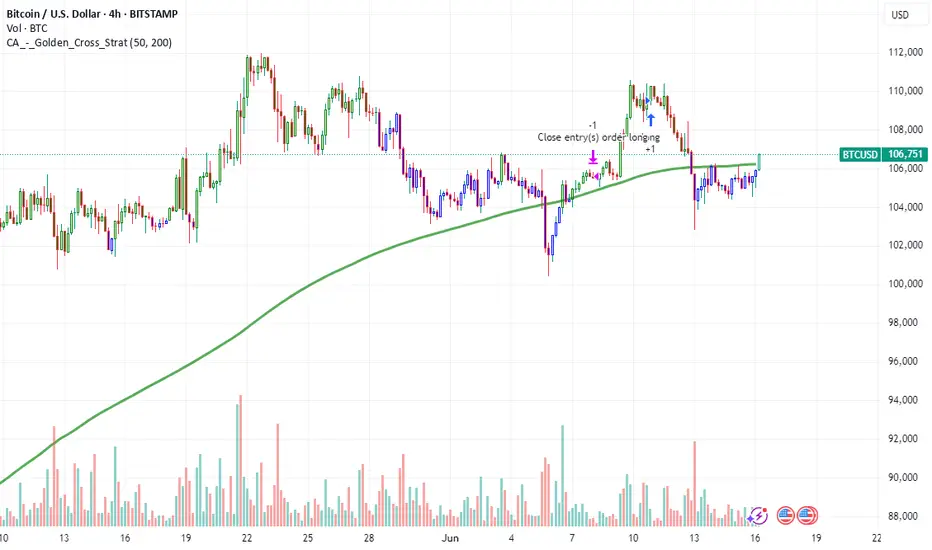
#BTC Double Top Breakdown? Key Levels to Watch: 100K, 92K, 74Bitcoin has recently formed a double top pattern near its all-time high at $112K–$110K, signaling potential exhaustion in the bullish momentum. After a strong rejection from the $106K resistance — a critical zone that has historically failed to close above on the daily timeframe — BTC is showing increasing bearish pressure.
All major indicators — RSI, MACD, and Stochastic RSI — are aligning to confirm this potential downtrend.
Here’s the projected bearish scenario if key supports break:
A break below $100K could trigger a fall to $97K, followed by a bounce and retest.
Rejection from $100K again may lead to a drop toward $92K.
Failure to reclaim $95K–$90K could send BTC directly down to $88K.
Another failed attempt near $90K might push Bitcoin to crash toward $74K, echoing the 2024 summer correction pattern.
This setup mirrors past seasonal moves and could mark a significant shift in market structure if confirmed.
📉 Watch these key zones:
$106K – Major resistance
$100K – Psychological and structural support
$92K / $88K / $74K – Potential targets if bearish continuation plays out
⚠️ Stay alert for retests and confirmations before entries.
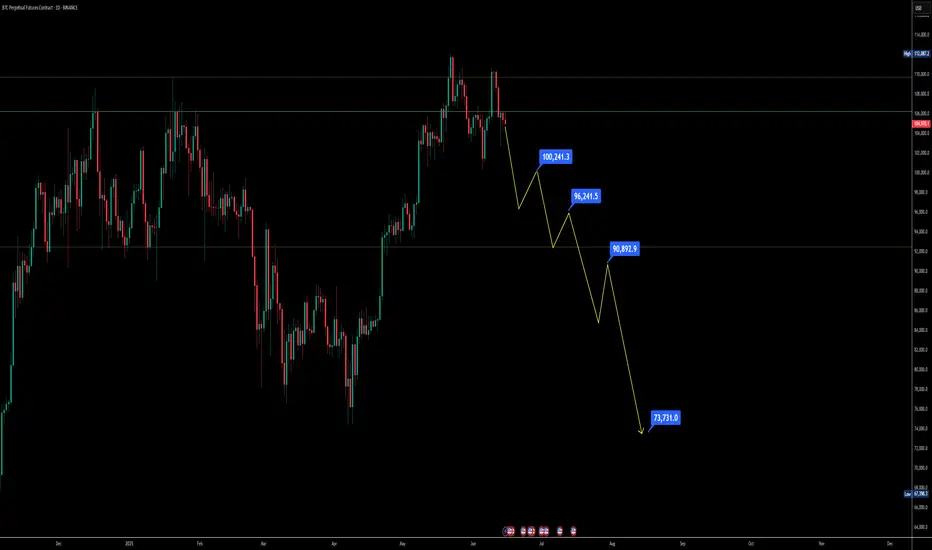
Bitcoin life cycle-stage One ending-Next cycle has to start NOW
There are 3 things to see in this chart
1) The Orange Arc of resistance. I have talked about this previously but to recap a little, it has its origins in Oct 2009 and has rejected EVERY ATH since then, as you can see on the chart. The Arc itself is part of a Fibonacci Spiral.
This Arc has begun to Squeeze PA against the lower trend line, that was formed in 2011.
And we are now in a position where PA MUST react or get pushed below the Long Term line of support.
This could be called Make or Break time for Bitcoin.
The Apex of this pennant is around Jan 2026
PA always reacts before the Apex.....99% of the time.
2) The Vertical Coloured bars are Trend Based Fibonacci Time, It begins on the 1st ATH in the channel that Bitcoin created. This channel is shown in the chart below
See how the Runs to the 2017 & 2021 ATH were all in a Bullish Green zone and how PA never retouched the lower trend line of support in this time
Since Mid 2021, we entered a Bearish Zone.
On the main chart, you will notice how this Fib Time has just ended.
3) The Trend based Fibonacci Extensions. Every single ATH rejected off a Fib extension.
The Root is at the 2009 Low and 1 is at the First ATH in the Bullish Fib time Zone.
The numbers here are all based off the 3,6,9 number sequence.
Lets look a little closer at the weekly chart
As we can see, PA got repeatably rejected off this orange Arc of Resistance and Current PA has been up there, trying to break through since 2024.
Many people have also commented on how PA has been so subdued this cycle and could this be reflected in the Fib Time showing us that we are in a Red Bearish Zone.
See how, from Mid 2021, when we entered a Strong Red zone, PA took a Deep dive off the Nov 2021 ATH.
Also note how this zone ended in late 2022 and in Jan 2023, PA began its current cycle Run. See the change in Colour ?
And Currently, while Bitcoin tries to break out of this squeeze, we were in a Red zone again....that just ended.
AND we can also see that we have not yet reached the 6 Fib Extension at 120,251 usd
The situation we face here is that if PA gets rejected off that Fib line, having just broken through the Arc, we could get pushed right back down under the Arc again. It is VERY STRONG RESISTANCE
This next move from Bitcoin HAS to be strong enough to take us up to the 9 fib line at 180,391 usd at a minimum. This way we can use the 6 Fib extension as support when PA cools off from a big push and so remain above the Arc and begin the Next long term cycle.
The Daily chart below shows us where we are right now
You can see how PA has repeatably tried to break above the Arc and been rejected Firmly Every time...so far, PA has avoided going right back down to the Lower trend line and has remained in near distance to this Arc..But we are running out of Time.
Recent attempts by PA have been Strong and I am sure that we will make it over but the real question is can we also get over that 6 Fib extension and stay above.
The weekly MACD certainly has enough strength to cope
Should we have a subdued Summer trading on Bitcoin, we will see this MACD cool off and be stronger before a sustained push near Autumn maybe.
To conclude, Bitcoin is under pressure to move out of its First Full Cycle.
It is getting Squeezed and now it is time for Bitcoin to prove it can cope with its new found "Adulthood"
The Next Big push, maybe later in the year, could very realistically reach 200K or more and this would place us Above that 9 Fibonacci extension I talked about earlier.
Of course, events could change and we could see PA collapse back below the Arc.
If this happens, all is NOT lost but it would certainly weaken the case for Long Term holders to continue doing so.
This then could create a Snownall effect and prices may tumble....And I will buy MORE....
Either way, we are in a HUGE moment for Bitcoin and I am privileged to be able see this all unfold...
Lets see what happens but, for me, I am Still VERY Bullish though Cautious....
We may have to revisit low 70K in the near future if Pa cannot get over this Arc and the 6 Fib extension
