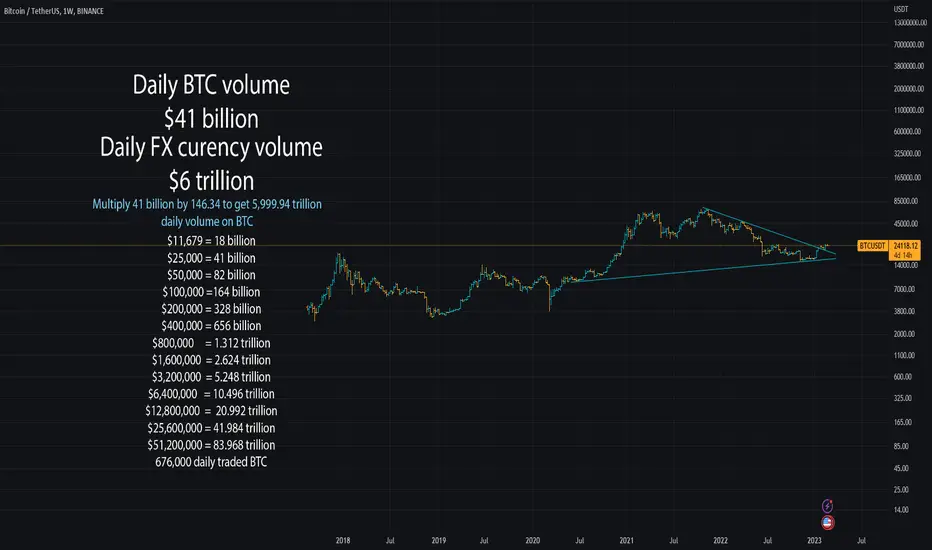
Projecting Bitcoin to $6,400,000 million (10.496 trillion VOL)
Working on creating an accurate model to project Bitcoins future movement, this would not include a market-cap its irrelevant, almost like me giving you a map to the treasure with an X without the path? what would be the point.
To make this simply take the daily FX volume averages from reports saying this can hit $6 trillion per day of transactional volume
Bitcoin as of the last weeks does somewhere around $41 billion of volume in USD per day yes that is 146.34 x smaller than just the FX currency market, not including bonds, equities, other assets.
Take the network price of 1 Bitcoin giving us $11,679 at around just under half the 41 billion you start to see the volume of money on the network is what drives the Bitcoin price.
Next we take the model and expand you start to see even at 5.2 trillion of volume we would hit a Bitcoin pricing the network at 3.2 million, and this would be assuming that the same circulating supply is the same for the next 10 years. The supply will likely reduce and be held offline reducing the daily traded BTC volume on average in the last years adding a multiplier to the Bitcoin valuation, something impossible to try to predict a nation state could turn around today and purchase 500,000 and keep them offline at a moments notice.
Instead of looking at the value of 1 Bitcoin $25,000 is expensive because you're looking at $25,000 nobody who owns gold jewellery knows the price of a 1kg gold bar or cares about the value.
A Bitcoin price of 6.4 million seems too expensive ? when in reality if Bitcoin captures international trade in multiple assets its not even the start of where it could go.
458,495.00 USD is the price of a single Berkshire Hathaway share, yet a share of Nike is 121.10 USD many people can own a share of Nike not many can own a share of Berkshire.
Reference 1 share of Berkshire in 1984 was $1,280 - $1,280 in 1984 is worth $3,685.64 today.
Bitcoinmarkets
Bitcoin PRE-FOMC Analysis - BTC Struggling to continue upBitcoin/1H is doing a parallel upward channel ( consolidating inside it )
We filled the gap ~28700 but with a doji candle - and has not yet touched it again . these two are sign of weakness for btc meaning down is more promenent
With FOMC tomorrow I think we gonna continue consolidate in that parallel channel today . Some High leverage around 28.4 to take (70M)
There are 3 stops if we start to go down wards that I have mentioned in the video
Some of the things I mentioned in this video will be repeated tomorrow I think,lol
Thanks for the support

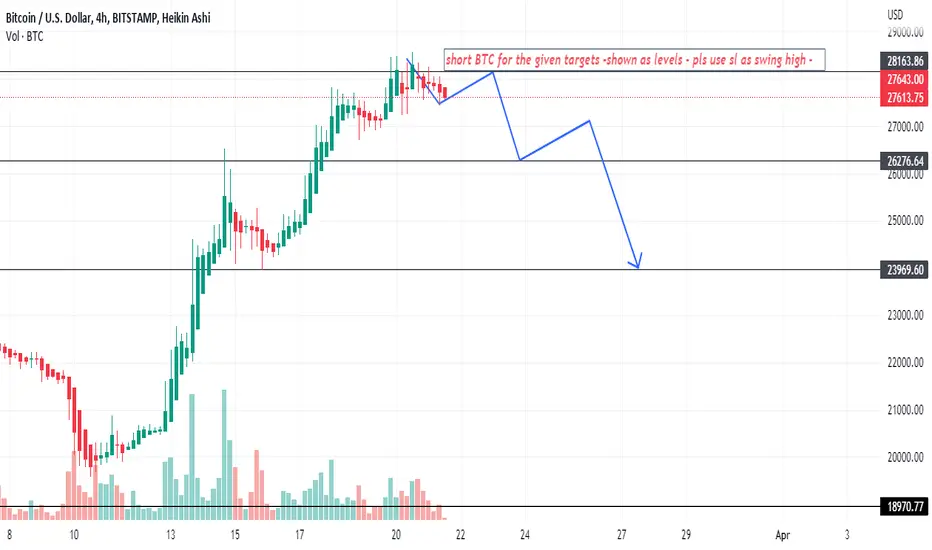
BTC/USD is bearish on 4hr Time Frame -TFBTC/USD is bearish on 4hr Time Frame (TF)
short BTC for the given targets -shown as levels - pls use sl as swing high -
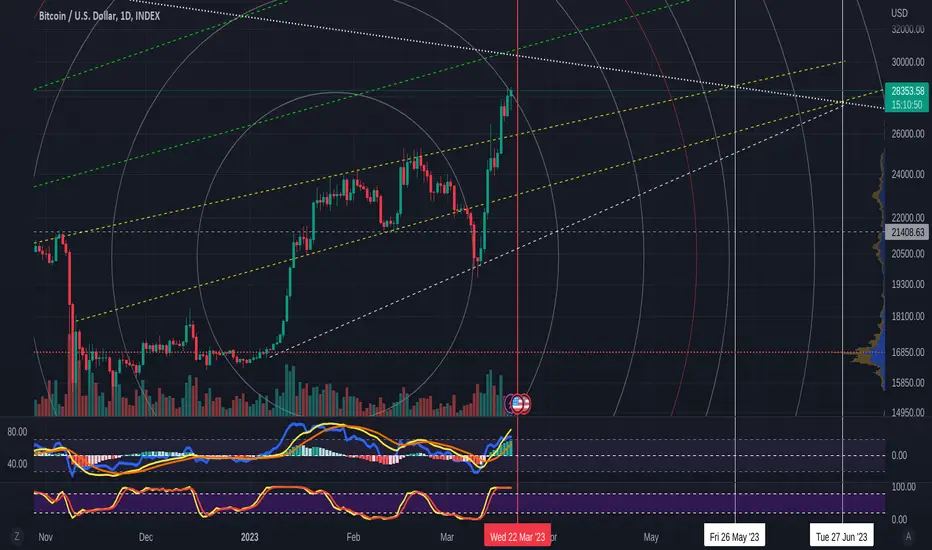
Bitcoin Daily - Facing strong resistance now
As we can see from the chart, PA is coming to a point where it is going to get squeezed from a number of places
Still Stuck under the 2.618 Fib circle and with FED on Wed, we could see PA cool off for a bit BUT, this is BITCOIN, 24/7 trading, it may run up to that Long term Resistance.
If rejected from t here, a return to $25K is possible but that would be bullish, as it allows PA to recover some strength
If PA breaks through that line, then I would expect it to then test as support before continuing.
It is impossible to say whats about to happen but one thing I am sure of, the talk of the $1 Million BTC in 90 days is just STUPID. Don't get wrapped up in that. For me, near $40K is possible over the next few weeks IF and its a big IF, fundamentals work in favour. From there, we Will see whats happening
PA is Very overbought on lower timeframes, Daily is approaching that and FOMO may take it further but PA has to cool off at some point before it continues.
While Banks struggle, GOLD is Bitcoins on ly challenger for the title of SAFE HAVEN NUMBER ! but BTC does have a higher % of gain, and people are seeing this
Trade safe
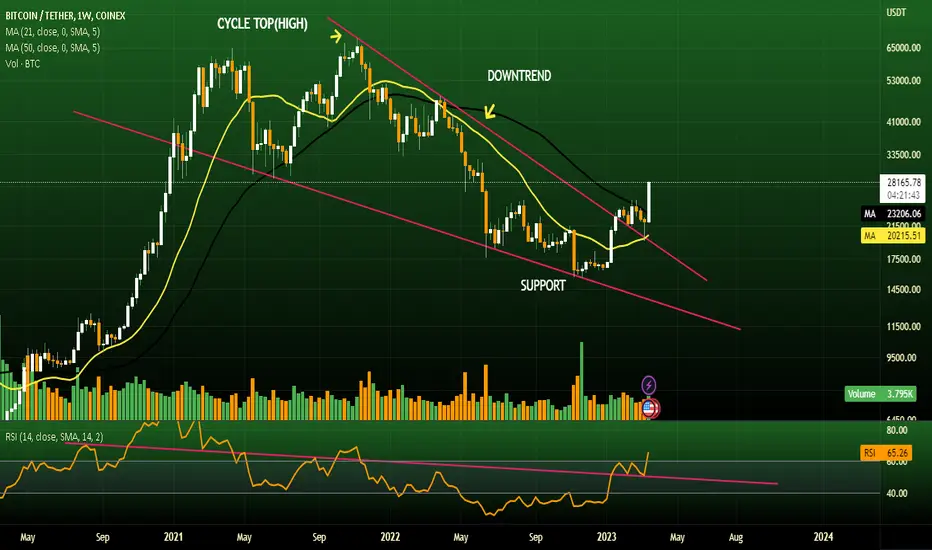
Bitcoin new bull-trend is just begins!!#BTC Weekly Chart
Falling Wedge Breakout and Retested are done 👍✅
BTC is above the Both MA's( 21MA & 50MA) after 9- months and RSI at 65 is also giving us some momentum from here.
Now Bulls need to break the 31k level for confirmation the new bull-run!!
🥰If you find this helpful and want more FREE forecasts in Tradingview😍.
Please show your support back🙏,
Hit the 👍 LIKE button,
Drop some feedback below in the comment✍️!
❤️🤝 Your Support is very much 🙏 appreciated!❤️🤝
💎 Want me to help you become a better Crypto trader?
Now, It's your turn!
Be sure to leave a comment; let me know how you see this opportunity and forecast.
Trade well, 💪
#bitcoin #crypto #nextmove #bullmarket #sideways #btcusdt #weeklyclosed
Does LPT has enough potentialsI currently Bullish overall in this trend long term
But in the short term an accumulation could be playing out
So for the levels am watching the most and wish to see fill or accumulate
Manipulate enough liquidity
then expand to the Bias that should resume
This is not a trade advice or trade signals
DYOR

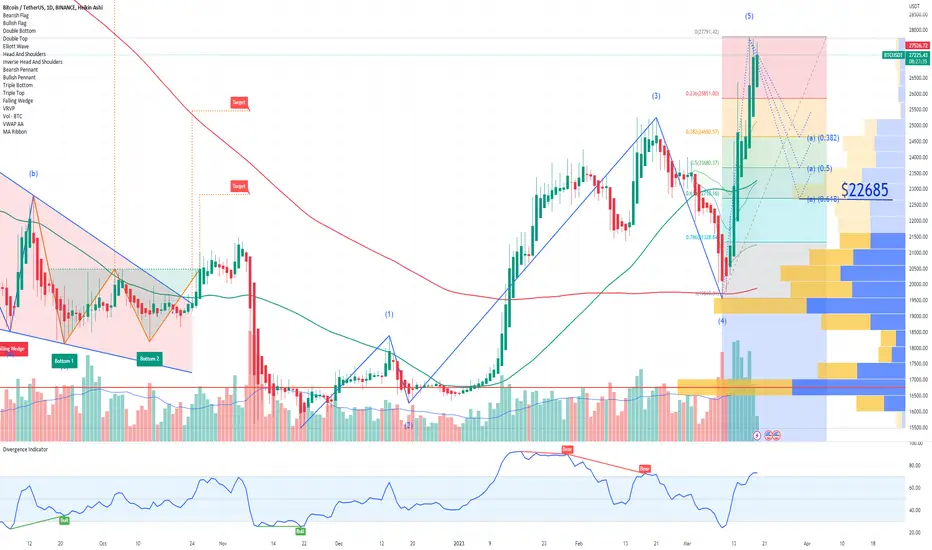
BTC Bitcoin Fibonacci Retracement Level for Next WeekAfter this chart pattern was completed:
Now the Fibonacci Retracement Level coincides with the Elliot Waves prediction theory, which reveals a potential Price Target of $22685 for Bitcoin next week.
Looking forward to read your opinion about it.
Bitcoin AnalysisAccording to the upward structure of Bitcoin, such a deal can be imagined
Step entry with appropriate size

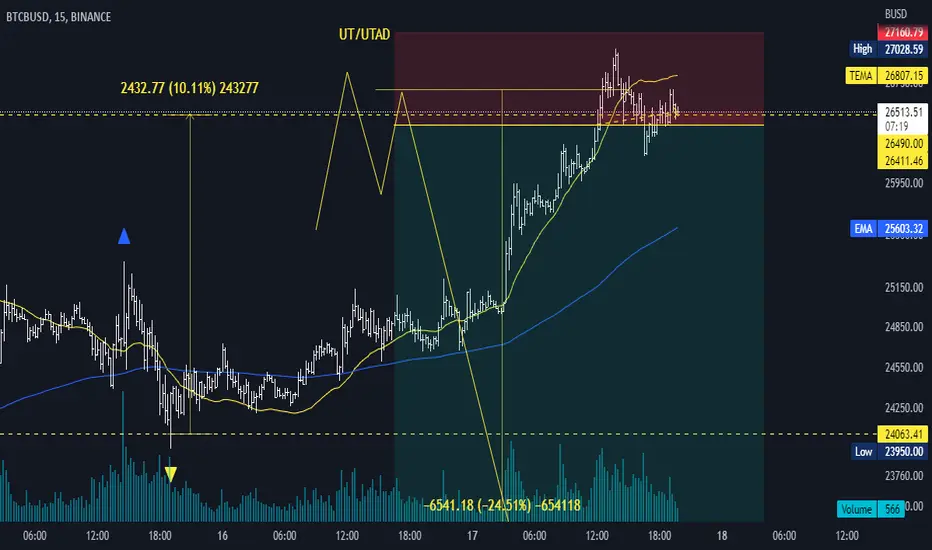
#Bitcoin - thoughts out loud #05Good evening , we are from Ukraine!
The price range has been reached. Next, I assess the weakness of the acquisition recovery. UT is fixed, UTAD is possible. I'm going to support the trade.
Thank you all for your attention, I wish you success .
Sometimes you win /sometimes you learn .
#Bitcoin
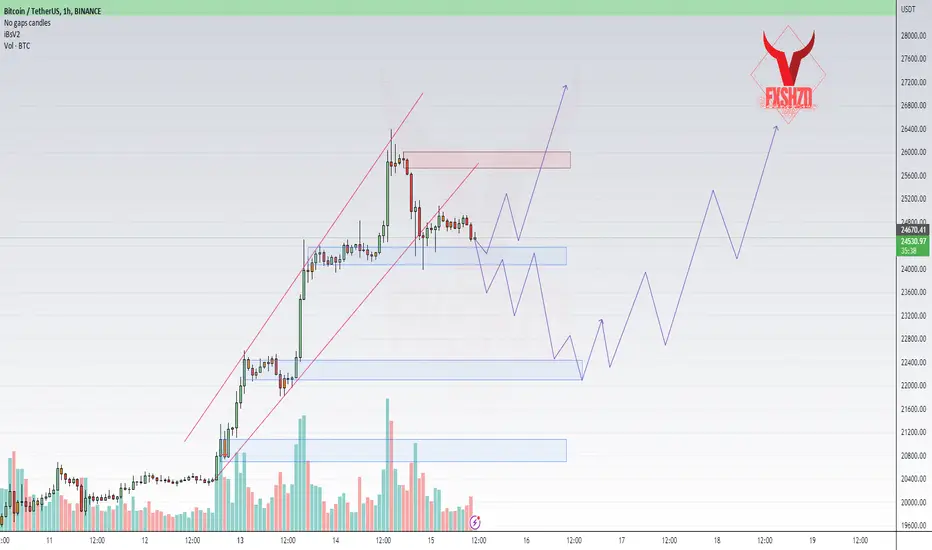
‼️ BITCOIN BULLISH ✅✅✅✳️‼️To update our last BTC idea,
We had two scenarios, as expected price chose the first scenario and it followed as we determined in the last analysis,
We have a strong supply zone around 28000, we expect the reaction to this zone, with a bit of corrective move,
For keep the position until 28000, but be careful try to manage your trades properly,
Any questions comment below,
@FxShzd

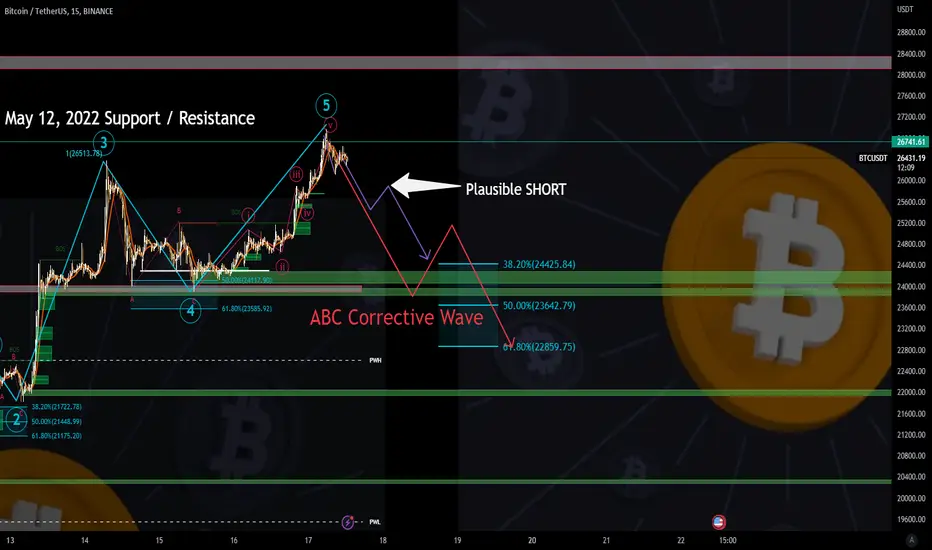
ACB CORRECTION | BITCOIN MARCH 17, 2023BITCOIN TA
There is a scenario where the 5th Wave is not complete and bitcoin could push up further to $28,400.
However, if it drops to the $25,600 level, there is a greater chance that we could be in the beginning of the ABC corrective wave.
Wave A will move down in 5 waves and a SHORT position may be available at the end of wave (iv).
TP level : $24,000
**Not Financial Advice** Please leave a LIKE and COMMENT and let me know your thoughts.
BITCOIN MOON
What do you think? We still early once Fed start printing $$. If only FED stop curving inflation then we FLy, If Fed still want to raise hike rates, then we go bottom next week. 25 or 50BPS?
But my theory would be rekt all banks because of their FEDNOW payments system or the CBDC? This year might be wild on CRypto Space and Stocks.
So stacking cash for the dipped weve been waiting.
This is not a financial advice, trade base on your own decissions.
Follow FOr more

Rejection from 50 weekly MA. If the price of Bitcoin is above the 50 MA and continues to rise, it may be seen as a good time to buy or hold onto Bitcoin as the trend is bullish. Conversely, if the price of Bitcoin is below the 50 MA and continues to fall, it may be a sign to sell or avoid Bitcoin as the trend is bearish.
Historically, 50 weeks MA played an important role in the last 2 cycles as well.

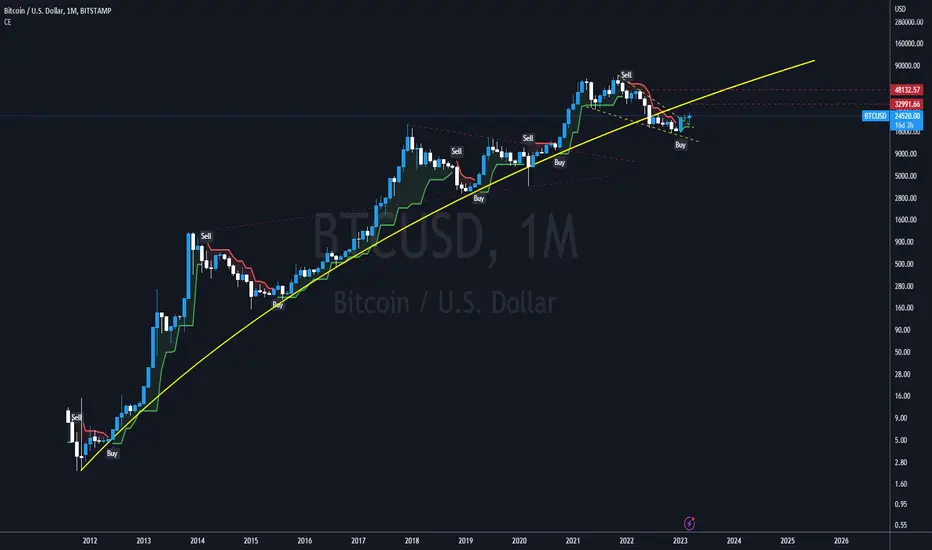
Bitcoin Weekly and regaining the 200As you can see from this long term chart on Bitcoin, it has the vast majority of its life ABOVE the 200 EMA ( Yellow)
In the week of 13th June 2022, the unthinkable happened and PA dropped below it and many believed that was it, BTC was Dead
For the last few Weeks, PA has been banging up against it and This week, PA has fully broken above. On the USDT chart, PA has remained positive above it while on this USD index chart, it has only Wicked up but the weekly candle is not closed yet.
Not only This but Bitcoin PA has slowly and Surely been taking back the losses incurred by the unprofessional in the space with the collapse of various organisations, like FTX.
Bitcoin is waking up but do not start running, this is just the start, we have a way to go yet and there are HUGE fundamentals that will continue to hammer recovery but World Wide Sentuiment is STRONG - Note the world WORLD WIDE - THAT is what makes Bitcoin Strong.

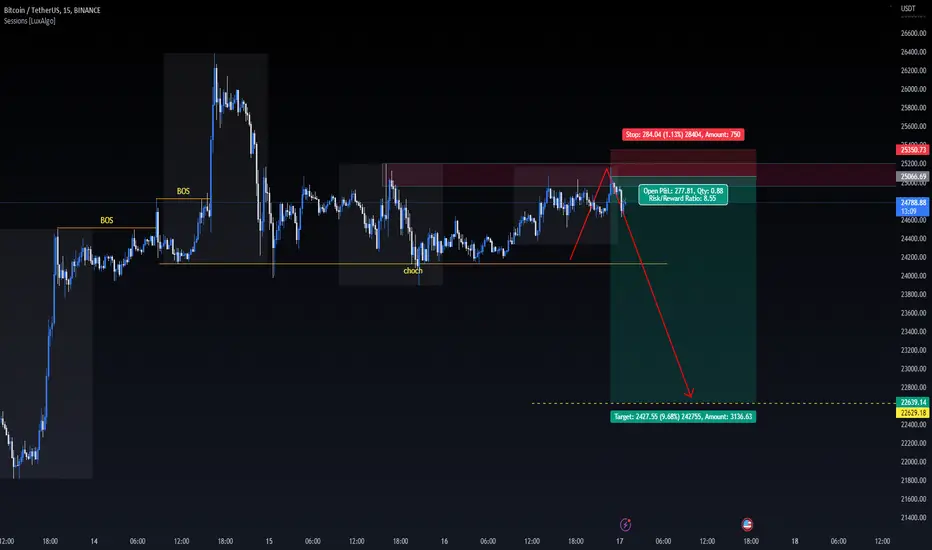
BTC -> Time 2 Short!I think we are going down ... So you can enter the short position right now, but place the stop loss in the place I specified! (I added the analysis a little late)
don't forget MM.
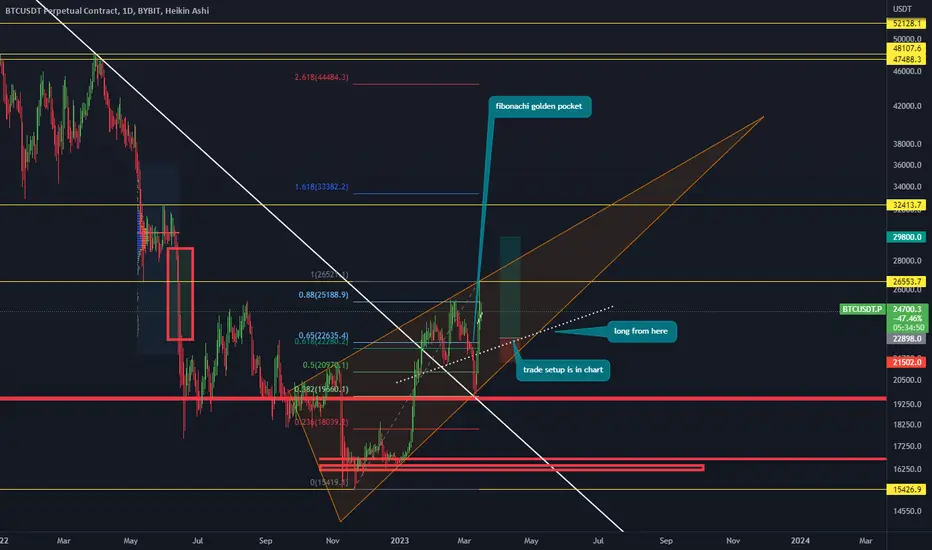
long setup for bitcoinlong trade setup for bitcoin target 29000+
lets see
price will come down to golden pocket 618 level
good place to bounce from here
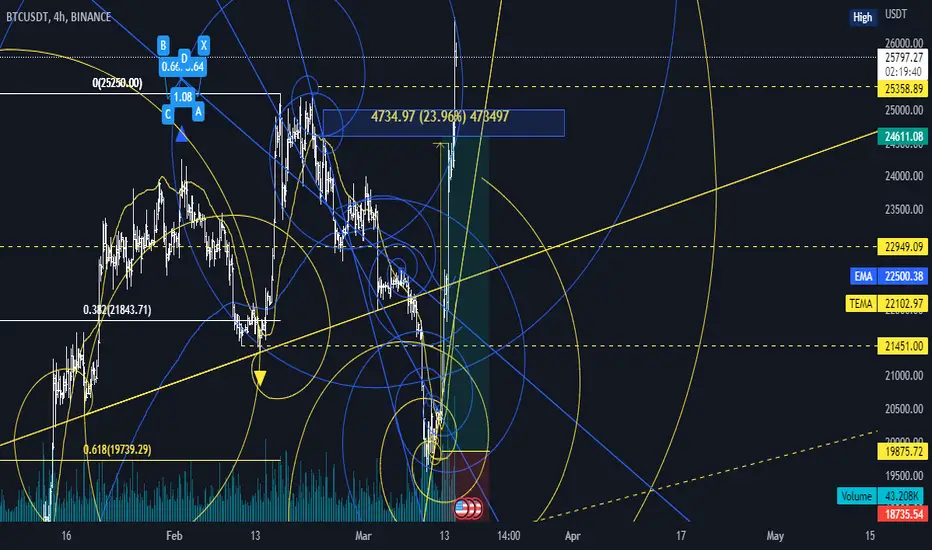
Can Bitcoin Fill The 28K Gap ?Signs are there!Bitcoin reaching the origin of the 30K slowly while having a gap from 27500 to 28400 to fill. Bitcoin can fill this before crashing but its another 17% up move. or this could be a jebait and the crash will happen today after a small retracement to the upside to liq all the high leverage shorters
BTC consolidating and holding the support (symmetrical triangle) could wick up before it wicks down
Some Crypto Banks Collapsed in the past days thus people cant convert their USDT to USD , what they do instead ? They buy BTC.
That is why btc pumped. will it go higher ? it might but at the end if you cannot convert ur crypto asset to fiat whats it good for ?
Thank you for all the support,commend,like,boost,follow

BTCUSD💥4H-TIMEFRAME ANALYSISBTCUSD💥4H-TIMEFRAME ANALYSIS
💗Hello ladies and gentlemen
This is my new idea for 💥Bitcoin
I hope my idea is clear
Support me by like and share thank you
Stay Safe💯💲💲💲
Good luck💰😍
BITCOIN DIFFERENT SCENARIOSFxShzd team here again with another analysis:
What we see on BTC, a bit complicated with just relying on technical analysis, as you may know, we are facing economic recession in first world countries,
BTC gets in power long term by any circumstances that cause to economic recession, I am telling maybe you see short term we have drop but in reality it is not like that
Just keep this scenarios for now, any rate that is related to inflation or economic effects BTC, for us is more important longtermly than a short specially in Crypto.
For now lets see if price can get lower, to give oppurtunity to more buyers to jump in, I expect to drop to a certain level just to help market to rise with more power
Becareful on BTC personally I am a holder on crypto
Lets see how price goes,
Any question do not hesitate write me bellow,
@FxShzd
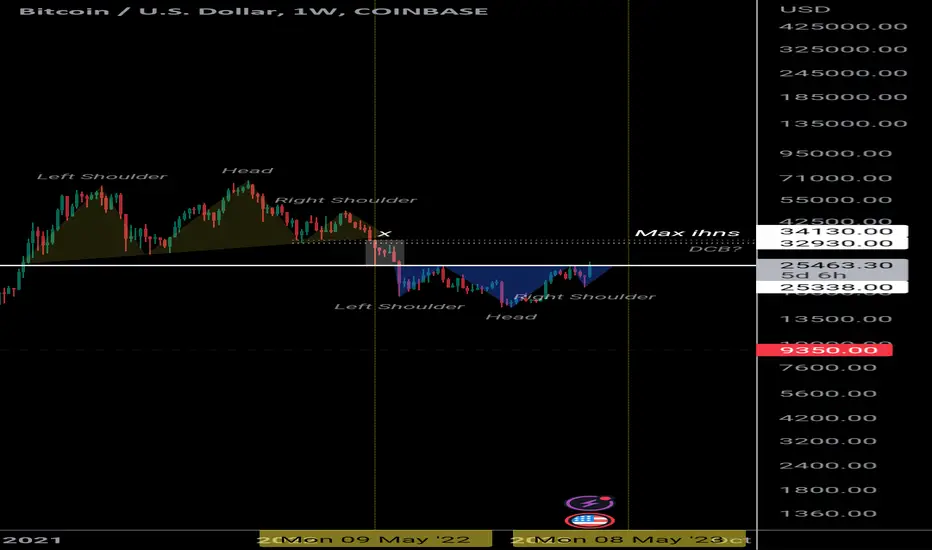
BTC 1W "Plankton VS Whale"BTC 1W
...we have managed to break down the price wall from 25 to 26k.
but now look at the whole... the pattern of IHNS has been born, and is preparing to fight against major HNS. This is the beginning, all this time we rise for a start.
Note:
above the current price there is a gap of around 28-29, it must be closed.
the current resistance zone is considered weak, where at the first time a big dump occurred, there was no resistance from buyers until there was a reaction again at a price of 17k.
today the price must hold and close 1D at 26.3 to continue to 28k-30k. If below that, price reduction is still possible. Maybe the gap below area 21 should be covered as well.
For this idea, there is a maximum target from IHNS with area X which can expedite the process, the target will be faced with a large resistance rejection zone from the HNS pattern. I thought there was going to be a dead cat bounce? it could happen if the gap in area 21 has not been closed then there will be a big short when the ihns target is reached.
Let see..
Monday 9 May 2022 - Monday 9 May 2023
Bitcoin analysisBitcoin is approaching a considerable resistance level where we will see a good level of transactions, from there it will depend if we see a new possible Ellit wave to reach new lower lows
