Bitcoin -> I Told You...Hello Traders,
welcome to this free and educational multi-timeframe technical analysis .
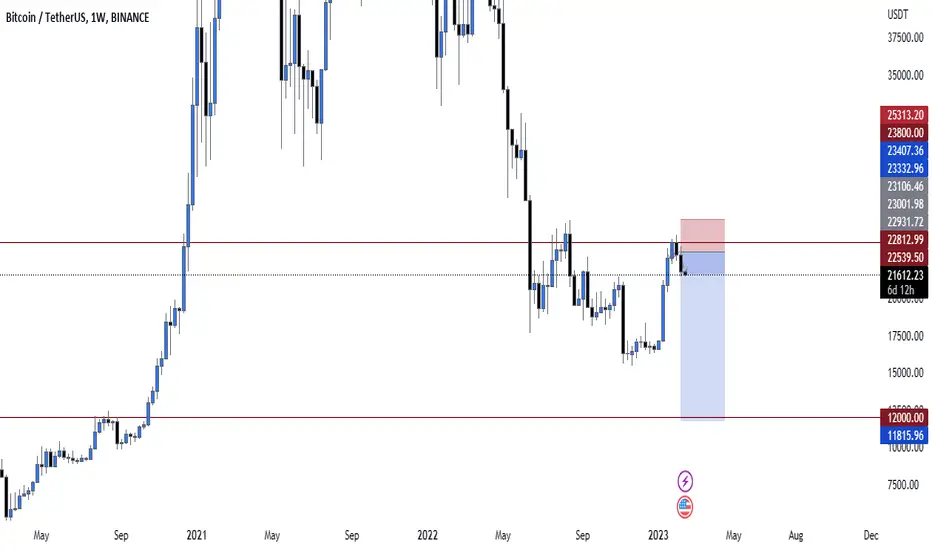
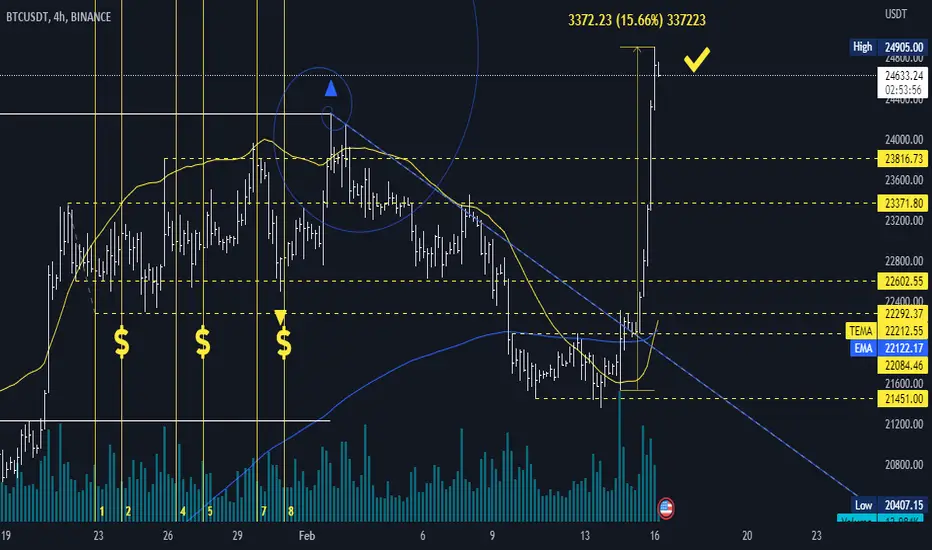
On the weekly timeframe Bitcoin just broke out of a quite obvious falling wedge formation and since then already had a quite nice pump of about 45% towards the upside.
We also just retested a strong previous weekly resistance, now turned support and as I mentioned in my last analysis I did expect the continuation towards the upside which is exactly what happened.
From a daily timeframe I am now just waiting for the market to break above the next resistance zone and then after a retest provide the continuation towards the upside.
Thank you for watching and I will see you tomorrow!
You can also check out my previous analysis of this asset:
Bitcoinmarkets

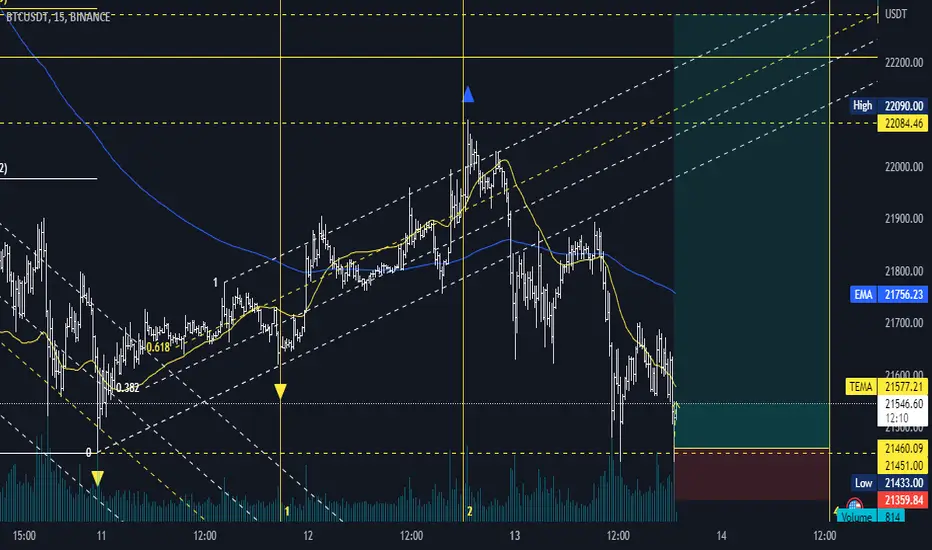
#Bitcoin - thoughts out loud #10.Good afternoon , dear colleagues!
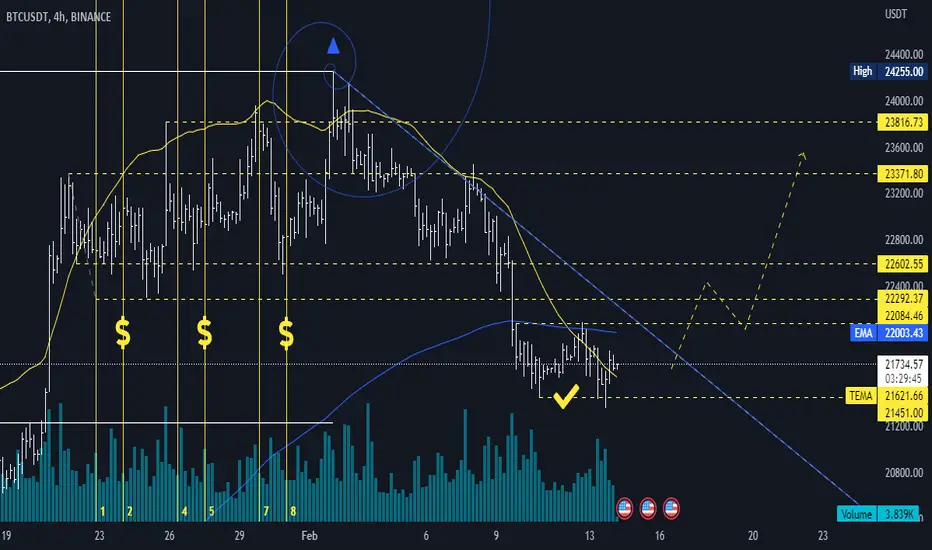
I want to continue my opinion and vision of the current situation on the cryptocurrency market on the example of this instrument.
I continue to accompany this asset with a subjective vision.
In my opinion, a deeper correction is needed to continue the asset's gains.
All trading patterns should be searched for on the younger time frames (15 minutes, for example).
But in any case, the market will equalize everything, because it is always right .
Thank you all for your attention, I wish you success, and remember:
Sometimes you win /sometimes you learn .
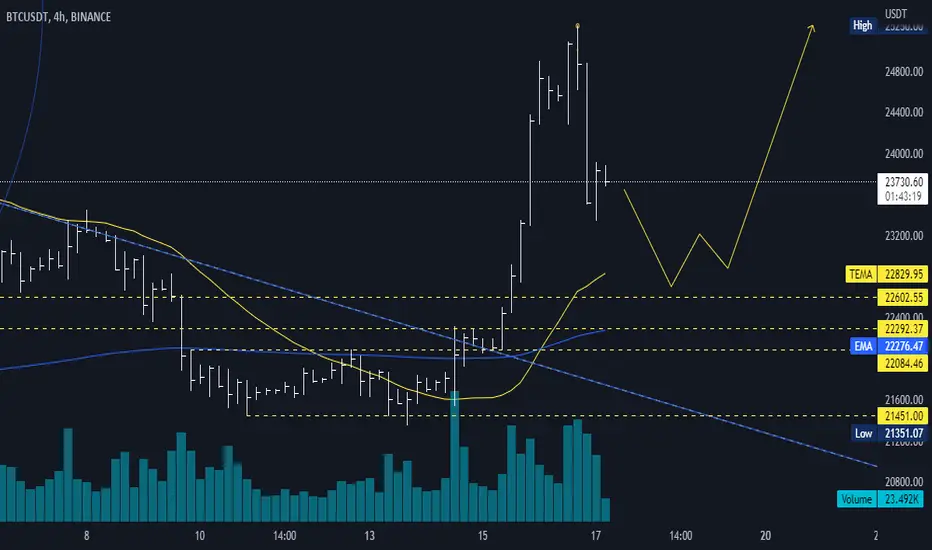
Crypto BTC update, playing top of the rangeWhole market is quiet... There are only a few top players who have confidence atm... Crypto let DXY go...
I think we'll stay in the range as we'll be testing the top for the first time... Waiting for a support or upward movement of BTC... A quick escape out of the range is possible in short time...
Only clean trades... No trade is also a winning trade...

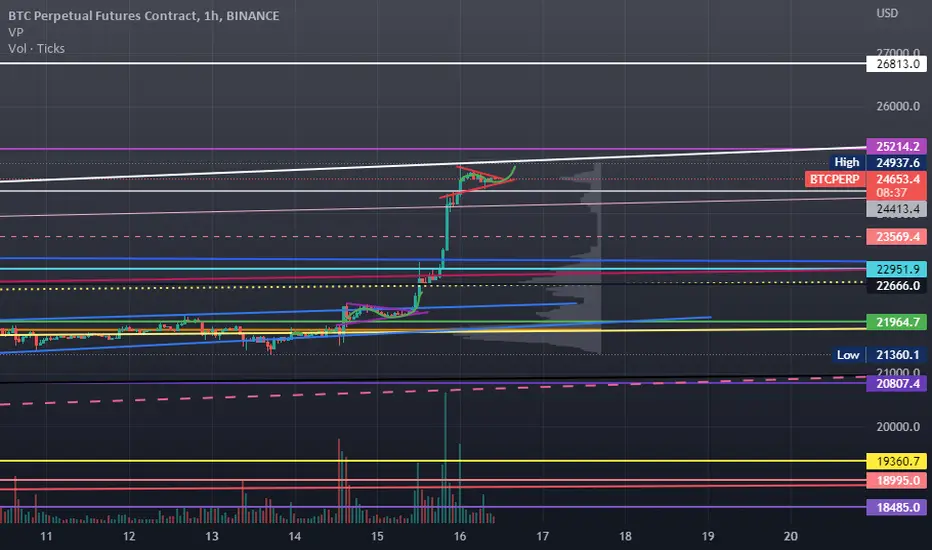
BTC Bulls Are Back or liquidity grab ?BTC/45M
Before the pump yesterday, WE formed a pennant (two purple lines bottom left) then we legged up insanely to ~24900 but did not touch the origin point of resistance ~25212.
now we are forming the same pattern (two red line top right).so this could go up to ~28600 with this momentum that its showing. Green drawing shows the wave of the pennant which both have the same wave.
pennants usually are sign of continuation and if they fail it could be a jebait or a complete retracement.
My personnal bias is down side due to market and world economy situation.
Also made a video today which unfortunately is in DXY category in link to related ideas
Please Comment,Boost,Follow if you find this interesting
Bitcoin Bull Market Back Or Fake Pump?BTC/3H Back to the rising broadening wedge
Please Boost,Follow,Comment it MOTIVATES me to do more for real!!
Yesterday we were inside a rising wedge but we Also were forming a pennant at the top of the wedge which was a sign of continuation to the upside.
we exited the wedge and we went to ~24900 (Touching the top of our rising broadening wedge). there is a resistant ~25214 which it jebaited it and not reached it YET , we could legup and liquidate all the high leverage shorters or crash back down
we could also go higher and touch ~28K then start forming a new range between 28k and 25k which is less likely to happen.
More liquidity to the downside than upside and that is the reason why we go up with less volueme than we go down.
Thanks for watching!

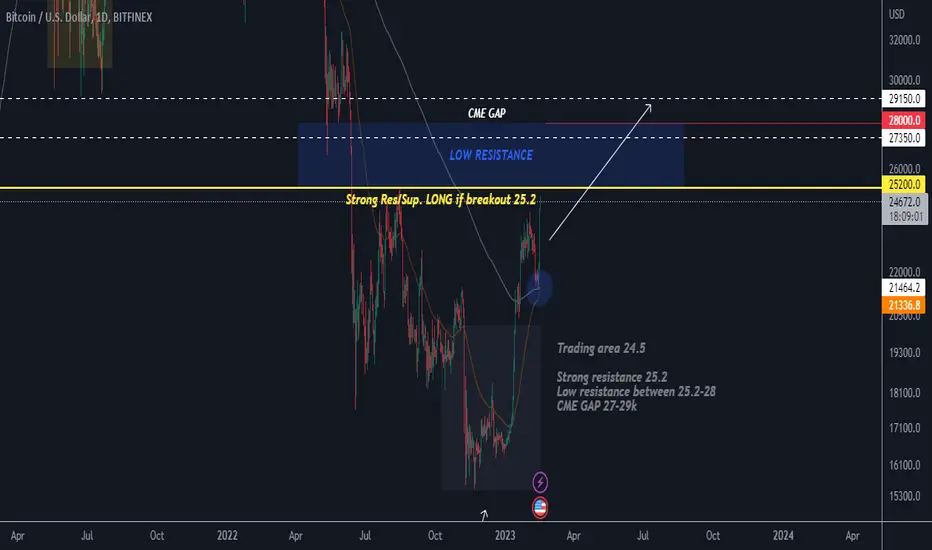
BTC 28-30KBTC 1D
I'm still HOLD LONG
Now, 25.2k is strong resistance.
BUT above this area till 28k is LOW RESISTANCE
PLUS CME GAP 27.3k - 29k
LONG or REBUY if BTC Breakout from 25.2k
#Bitcoin - thoughts out loud #9Good afternoon , dear colleagues!
I am pleased to welcome everyone who wants to get acquainted with my vision of the current situation on this assets .
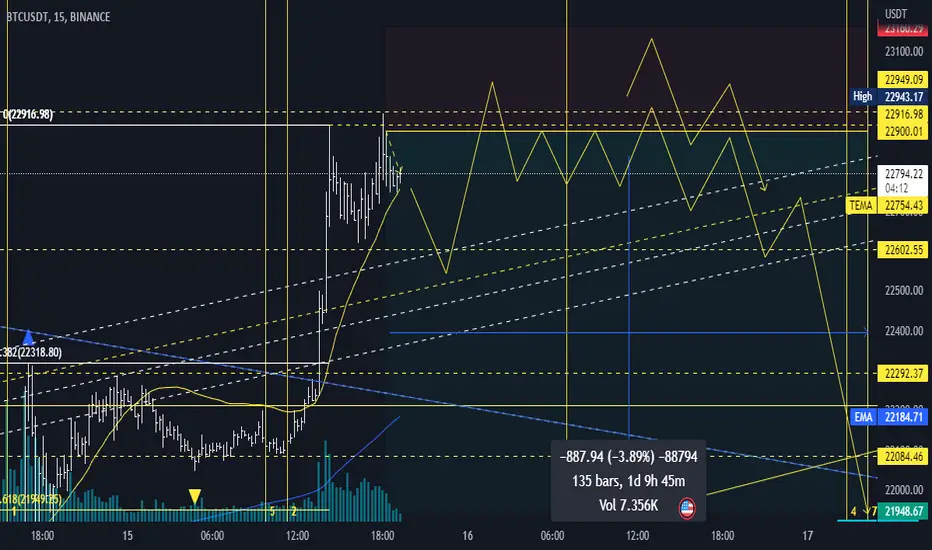
At this stage of the situation, we see this algorithm being clearly worked out. When an asset shows a strong movement without corrections.
The current situation only suggests that we need to wait for a possible corrective movement or flat movement.
Dear colleagues, I sincerely thank you all for your attention and wish you success!
And remember one thing:
"sometimes you win , sometimes you learn ".
Entry point
#Btc
#Bitcoin - thoughts out loud #7Good afternoon , dear colleagues!
I am pleased to welcome everyone who wants to get acquainted with my vision of the current situation on this assets.
Why long?
As we discussed in the previous opinion, we saw how the price followed the stop loss.
At this stage of the situation, professional operators need to lock in profits and buy the asset at more favorable prices to continue moving up. Due to the stop losses, retail traders fill buy orders and it is possible to re-enter the position for further upward movement, because we need fuel to move further. But there is one thing: if there is not enough demand in this range and professional operators are not interested in continuing to move up, we will most likely see a depreciation of the asset.
Dear colleagues, I sincerely thank you all for your attention and wish you success!
And remember one thing:
"sometimes you win , sometimes you learn ".
#Btc
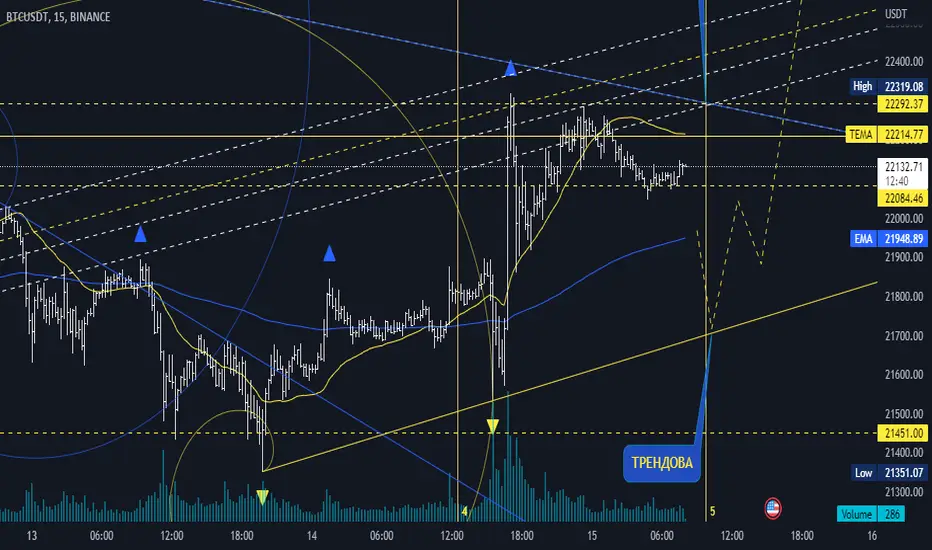
Evening trading at profit taking.Market participants take profits and close positions due to stop orders from weak market participants.
Warning, you need to be prepared for a false breakout of local highs.
If you have any questions, leave them in the comments and I will be happy to answer them.
Good luck to everyone and enjoy the trend!
#Bitcoin - thoughts out loud #8Good afternoon, dear colleagues!
I am pleased to welcome everyone who wants to get acquainted with my vision of the current situation on this assets.
After yesterday's impulsive movement, I expect the price of the asset to rise further. Yesterday, we witnessed professional operators testing the strength of the buyer, which was followed by an impulse movement. Today, the area of interest is 21600 - 21700 for further upward movement. But this is not the final price, it may fall even lower, because everything I write here is my subjective opinion, as the market will settle everything by itself, because the market is always right.
Dear colleagues, I sincerely thank you all for your attention and wish you success !
And remember one thing:
"sometimes you win , sometimes you learn ".
#Btc
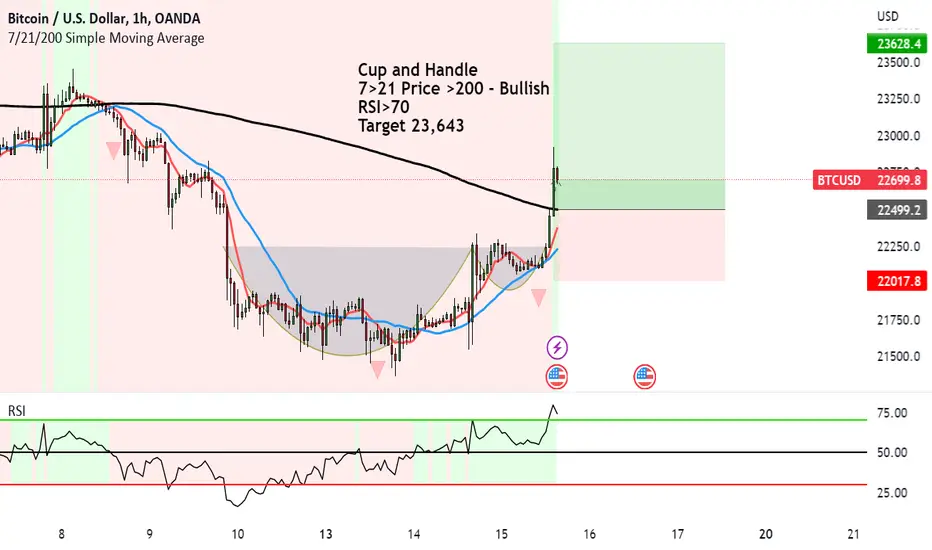
Bitcoin just hit a massive BUY signal to $23,643Cup and Handle has formed on Bitcoin.
We have finally had the break above the brim level.
Now that the buyers and demand are streaming in we can expect upside.
7>21 Price >200 - Bullish
RSI>70
Target 23,643
FUNDAMENTALS
There seems to be a strong correlation for when the Global markets rally, Bitcoin tend to follow. I don't know if it's because they are so tied up in central businesses and with the government, but I can make some assumptions why:
Increased Investor Confidence
When global markets are performing well, investors tend to have more confidence in the economy and, in turn, more confidence in investing in various assets, including Bitcoin.
This can lead to an increase in demand for Bitcoin, which can drive its price up.
Increased Institutional Investment
We also tend to see institutional investors becoming more interested in alternative investments like Bitcoin.
Strengthening of the US Dollar
When global markets perform well, investors may move their money into the US dollar, which can drive up its value.
As Bitcoin is often traded against the US dollar, a strengthening dollar can lead to an increase in the price of Bitcoin.
Similar to the gold standard, there is some effect with the Bitcoin US dollar standard.
Better Economic Activity
When global markets go up, it tells us that there is strong economic activtity which is picking up GDP and consumer and producer spending.
This extra money that investors have will then go to investments like Bitcoin, which will help with the increase in demand and price.
Trusting the big boys
Last year was a confidence destroyer with crypto currencies. We had companies failing, becoming bankrupt and price heading to zero. People lost billions of dollars and now they have no idea who to trust...
When it doubt, buy Bitcoin I guess.
When there's trouble in the crypto market who are you gonna call?
#BTC/USDT Quick Update + Trade Plan.#BTC:- Moving nice and slow to our target, the green box.
It's already up 4.5%, expecting our 7% Target to hit in the next 48 hours.
What do you think will happen when the price reaches that resistance?
I will update my next chart as per the price action.
Will analyze the chart accordingly.
For now, It's better not to FOMO into Alts and wait for some red (Likely this weekend).
Take profits, Stay cautious.
Just my 2 cents, always DYOR.
Do hit the like button to support my work.
Thank you
#PEACE

Bitcoin jebaiting longs before crashBitcoin trying to jebait more longers with its new extreme before dumps on the bulls and destroys the bull hopium once in for all
BTC/3H ,`still in the rising wedge`
Personally looking for a possible short from ~22600 to ~22900 or around ~21800 if it bleeds there does a bearish retest
Please Comment,Boost,Share. Really motivates me to do more.really does!!!
With CPI numbers being out and not looking for btc exited the top of the rising wedge but failed to hold it after retest , now we are inside it again and we could easily go down to the bottom of the wedge and then break down from there after a successfull retest ~21800
We could also hit ~22900 and then go down from there which is less likely to happen due to the weakness of bitcoin
Thanks for watching

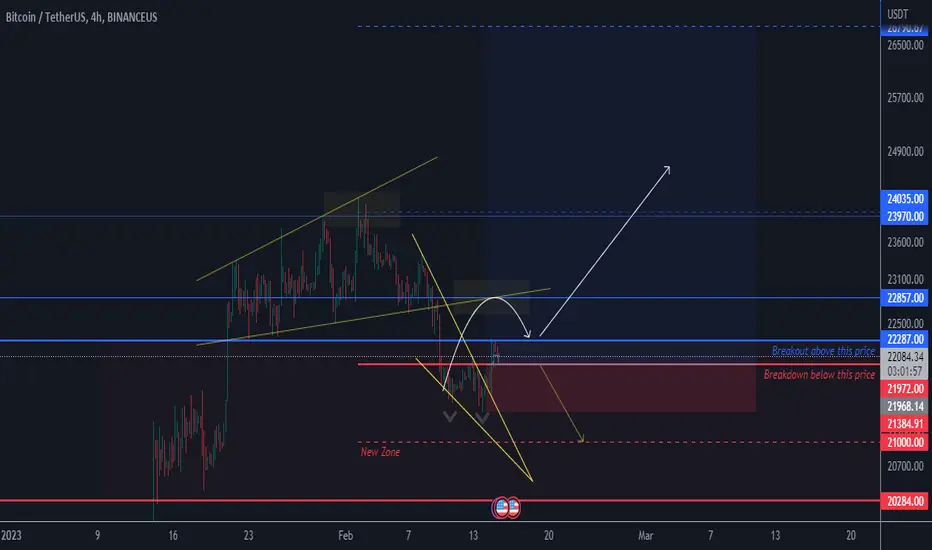
BTC ABOVE 23k AREA4h - 12h - 1D TF
Im hold LONG for now.
why?
btc 4h still retrace on ascending broadening.
retrace with falling wedge and breakout with double bottom after CPI.
and now 12h is double bottom retracement. bounce from here, next target is 22.8K
overall is bull pattern. and im HOLD LONG!
but if break above 21.9K btc will play around new zone (20k is dip)
but still LONG!
Bitcoin is an opportunity to open a long position During the day, I was waiting for the price to open this position
Bitcoin Sell Position tradeSell trade setup in bitcoin the markets gonna shift bearish
Entry : 23800 stop
Stop loss : 25300
take profit : 12000
long term hold