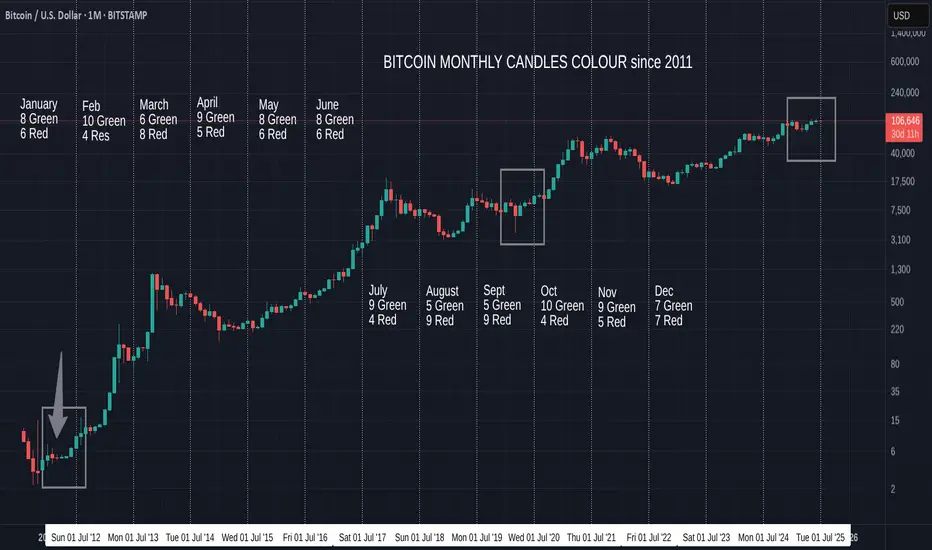
Bitcoin Monthly Candle Close colour and patterns since 2011
At the beginning of June , I wrote this
""On only 2 occasions have we had a GREEN JAN, RED FEB, RED MARCH, GREEN APRIL
And Both of them were on the way to ATH. (Boxes )
On both those occasions we also had a GREEN MAY, though the gains were minimal and one was followed by a Green June and the other by a Red June."
We just got the GREEN June and so this draws my eye to the sequence on the left, ( arrow )
If we are to follow this, then July should be a larger Green (Arrow) - BULLISH
In-fact, in both the sequences we have been following ( boxes), July was GREEN- BULLISH
And using just the month candle colours, we have a higher chance of another Green candle, with July having had 9 Green to 4 Red previously. - BULLISH
However
Of the previous 8 Green June Closes , only 3 went to a Green July - BEARISH
And I have to say, on NONE of the previous Green Junes were we so close to the current ATH.
July 2021 being the closest with a price at 41K, around 18K below the current ATH at the time.
We are currently only around 200 usd below Current ATH
This adds enormous resistance to the ability to rise
I wanted a RED June because I felt it was more sustainable and would lead to a cycle ATH at the end of the year. As can be seen in the middle Box
If we look back toward the 2012 Box on the left, we may now get a Hot July / August , September and then a Cool off for October, November & December.
But something tells me this will not happen.
The Candles for our current cycle in April, May and June are diminishing in size, the opposite of 2012
But they are similar to the 2020 box, except for the red June close.
This could lead to the desired "Cooling" in August & September and a new lift off in autumn.
And if you look at the chart Candle Colour Count, , August and September are usually RED by some majority
This also gives us the Bigger Green July candle that the "Odds" point towards.
So, as ever, we have to wait and see how this plays out.
Odds in favour of a Green July using previous cycle Data
PA position just below current ATH could lead to a slightly Bearish out look in the short term.
And if you are hoping to see ALTS Rally, PLEASE keep your eye on the BTC.D chart
This also points to wards BTC ATH in Q4 this year
And then, we have the BIG question.......Will we ever see a Classix Bear again ?
With so many Holding Bitcoin LongTerm.....How would a Bear market arrive ?
BUY BITCOIN
HOLD BITCOIN
But, as ever, we just have to wait and see,
Bitcoinmonthlyclose
BITCOIN Monthly Candle close patterns since 2011 - APRIL CLOSE
Again, we got the expected Monthly Close, This time GREEN
April is traditionally a Strong Green Month, now with 9 Green Closes to 5 RED - Nearly twice as many Green to Red.
MAY is a different story, Nearly 50 / 50 previous closes with GREEN having an advantage of 1.
BUT, With April closing Green after the previous months closes, things do look positive.
On only 2 occasions have we had a GREEN JAN, RED FEB, RED MARCH, GREEN APRIL
And Both of them were on the way to ATH. ( Arrows )
On both those occasions we had a GREEN MAY, though the gains weer minimal and one was followed by a Green June and the other by a Red June.
We have had 4 occasions with a MARCH RED, APRIL GREEN, MAY GREEN
Of the previous 9 GREEN April Closes, 5 were followed by a Green June
And of those 5, 2 were followed by consecutive Green candles closes for the following Months.
Though in 2020 sequence ( 2nd Arrow) after a GREEN May close, you can see the candles were not big and we had Red Green Green Red for 4 months then went Green consecutively.
Of the previous 7 Green MAY candles, 4 were Bigger than the previous month candle.
I am more inclined to look at the 2020 sequence in this for now and yet, at the same time, as posted in another chart, I am also still looking at the lead up to the 2017 ATH and for this to continue, we need a Bigger GREEN MAY close this month.
There is a very strong line of resistance just over head.
Currently, at time of writing, The opening MAY candle is GREEN but only just
This month is CRUCIAL

Bitcoin Monthly Candle close colour patterns since 2011We got the expected RED March close but it was a close thing.
but, this creates better Odds for a continued push to ATH.
We have had only 3 occasions when we had a Green Jan, Red Feb, Red March ( arrows)
2 of those went on to an ATH the following Year !
The other one was entering a Bear Market.
Of the previous 7 RED March Closes, 5 were followed by a Green April
And of those 5, 4 were followed by consecutive Green candles closes for the following Months.
As you can see, April, May and June do have more GREEN closes than Red on average but May and June is near 50/50
It could be said that March Candle close was a "Spinning Top", showing in-balance / indecision in the market. This is possibly driven by Macro events.
We had a similar situation in 2012 and April was Green, as were the following months.
We had 2 other occasions with small Red candle bodies in March, both were Hammer Candles, one inverted, that led to a red April, the other was not and let to a green April.
The March close we just had, had a Long Upper Wick. To me, this shows the BEARS had the upper hand, keeping driving down.
And thats OK, PA needed to reset but we now need a GREEN April
Statistically, April should close Green - We currently have a Score of 8 Green to 5 Red month closes for April.
April seems to have opened GREEN and I hope to see it close that colour though we do need Caution
Because of the Colour sequence over recent months, there are not many comparisons to use.

Bitcoin Monthly & Weekly Bottom 2021
Bitcoin Monthly & Weekly RSI Close for 2021
Buy Low sell High, last chance.
