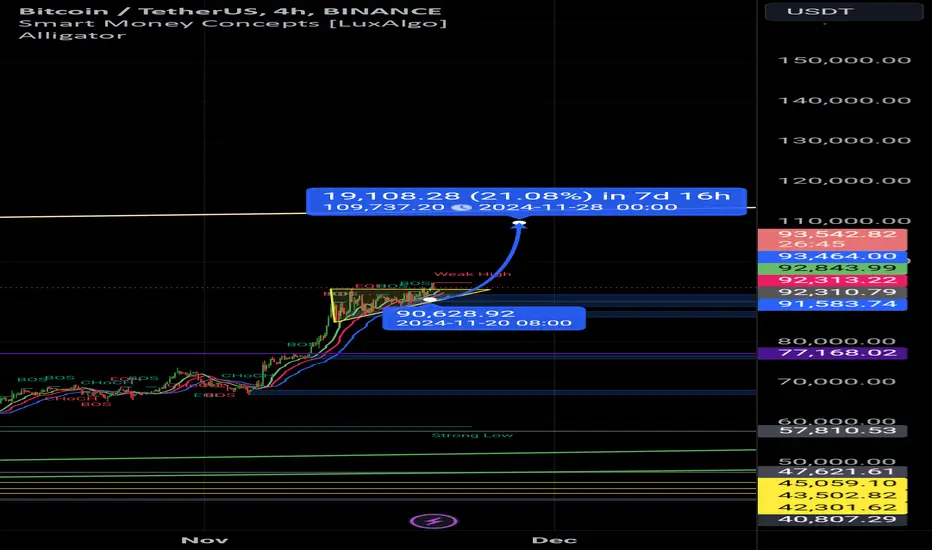
Will Bitcoin Able to Breakdown Below $111,950?On the daily timeframe, Bitcoin CRYPTOCAP:BTC is showing signs of potentially forming a Double Top reversal pattern , indicating a possible trend shift from bullish to bearish. Should the price break below $111,950, Bitcoin could decline toward the $104,320 range, which also coincides with a fair value gap area.
Although the liquidation map from Coinglass highlights liquidation clusters between $110,841 and $111,905, traders and investors are advised to remain cautious in anticipating Bitcoin’s volatile price movements.
Bitcoinnews
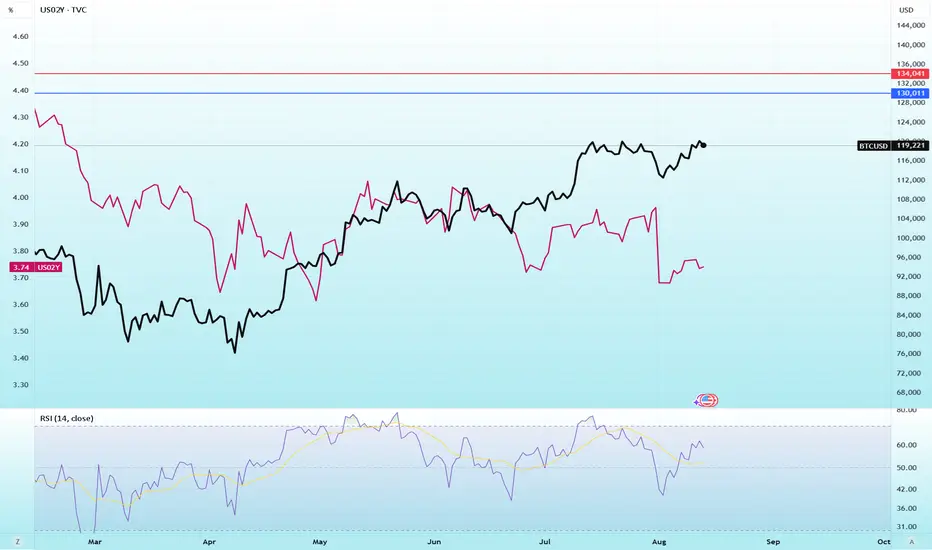
Declining 2-Year US Treasury Yields Could Fuel Bitcoin’s BullishThe follow chart is a comparison between Bitcoin CRYPTOCAP:BTC Daily Chart and the US 2 years Treasury Bonds TVC:US02Y .
The graphic shows the 2-year US Treasury yield declining from 3.7684% to 3.7308% on August 12, 2025, following a steep drop after CPI inflation in July stabilized at 2.7%. This underscores market expectations that the Federal Reserve will lower interest rates, driving up demand for bonds as a safe haven asset.
The potential on Short-Term Impact on the Bitcoin Market:
Positive: Falling rates and expectations for rate cuts weaken the US dollar, boosting capital flows into riskier assets such as Bitcoin. BTC may gain in the immediate term, testing the $130,000 resistance level, aided by new liquidity from stablecoins.
Risk: While falling yields can support Bitcoin’s bullish momentum, they may also signal recession fears. If investors interpret the decline as a warning of economic slowdown, BTC could face selling pressure—potentially dropping to $111,939. Volatility remains elevated, especially after the recent liquidation of leveraged long positions. Keep an eye on upcoming economic data for confirmation of market direction.
Analytics: market outlook and forecasts
📈 WHAT HAPPENED?
At the beginning of last week, Bitcoin reached the resistance level of $115,000-$116,300 (a mirror volume zone) and experienced a quick correction. However, at this level, there was a strong absorption of sales, as the volumes clearly indicated active buys, and by Wednesday, the focus shifted towards long positions.
The only surprise was a slight stop in the $117,600-$118,600 zone (accumulated volumes). In general, we passed it with almost no resistance, which is a sign of buyer strength.
An additional catalyst for growth was President Donald Trump's executive order on August 7, which allows Americans to invest in cryptocurrency through their retirement accounts. This decision could pave the way for a multibillion-dollar influx of new funds into the cryptocurrency market.
💼 WHAT WILL HAPPEN: OR NOT?
Now we’re almost close to the ATH, but at the moment there is a small resistance in the range of $121,500-$122,300. It’s not yet clear in which direction the volume will move, but in case of a breakout of the ATH, this zone can become the nearest support in the case of a correction.
If sells are activated at the current levels, it’s worth paying attention to the level of ~$120,000 (pushing volumes). In this case, a local sideways movement is possible between the level of ~$120,000 and the zone of $122,300-$121,500.
Buy Zones:
~$120,000 (pushing volumes)
$117,500–$116,000 (accumulated volumes)
$115,300–$114,000 (accumulated volumes)
📰 IMPORTANT DATES
On macroeconomic events this week:
• August 12, Tuesday, 12:30 (UTC) - publication of the basic consumer price index (CPI) of the United States for July, as well as in comparison with July 2024;
• August 13, Wednesday, 6:00 (UTC) - publication of the consumer price index (CPI) of Germany for July;
• August 14, Thursday, 6:00 (UTC) — publication of the UK's GDP for the second quarter and for June;
• August 14, Thursday, 12:30 (UTC) — publication of the number of initial unemployment claims and the US producer price index (PPI) for July;
• August 14, Thursday, 23:50 (UTC) — publication of Japan's GDP for the second quarter;
• August 15, Friday, 12:30 (UTC) — publication of the volume and base index of US retail sales for July.
*This post is not a financial recommendation. Make decisions based on your own experience.
#analytics
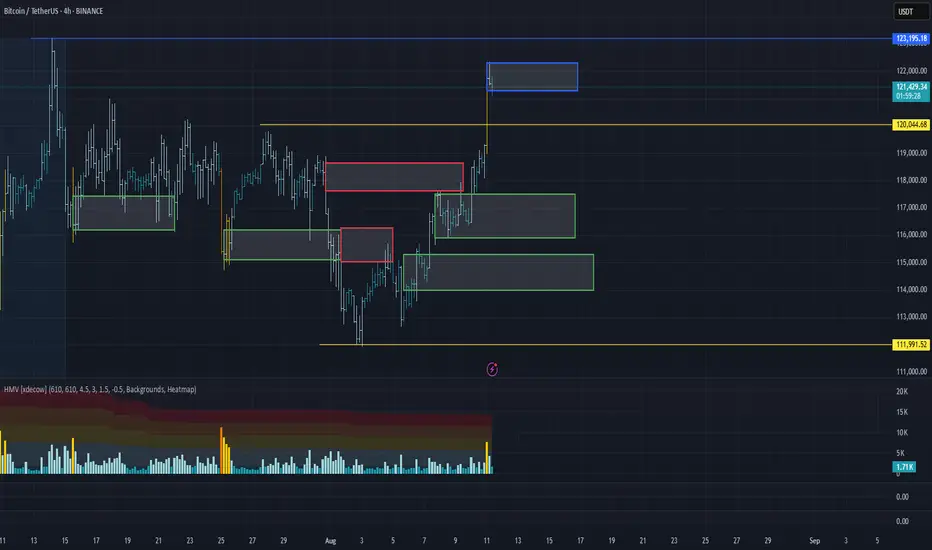
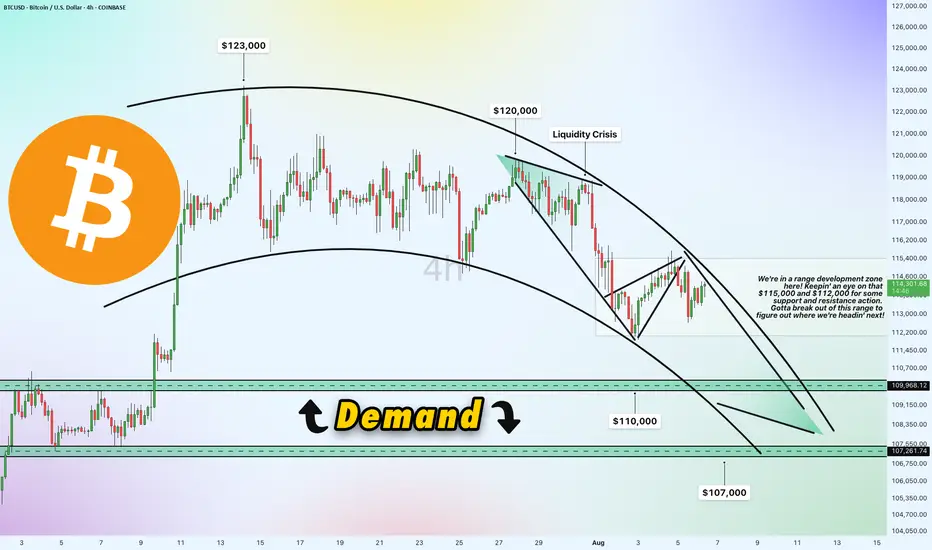
Bitcoin 4h Chart Update [Tight Range / Breakout Opportunities]Breakout Opportunities
We're in a range development zone here! The chart shows Bitcoin (BTC/USD) trading within a tight range, with key levels at $115,000 and $112,000 acting as critical support and resistance zones. The price recently peaked near $123,000 but has since pulled back, forming a liquidity crisis zone around $120,000 where selling pressure kicked in. A breakout above $115,000 could signal a move toward $120,000 or higher, while a drop below $112,000 might push it toward the demand zone. Gotta break out of this range to figure out where we're headin' next!
Demand Zone
$110,000 & $107,000
Price slipped down from $120,000 due to a lack of buying liquidity, potentially it will land into a demand zone between $110,000 and $107,000. This area could act as a strong support level where buyers might step in. If the price holds here, it could bounce back toward the $112,000-$115,000 range. However, a failure to hold this zone might see it test lower support around $107,000 or even $105,000.
Direction and Possible Ranges
Upward Potential: If Bitcoin breaks above $115,000 with strong volume, the next targets could be $120,000 (liquidity crisis zone) and potentially $123,000, aligning with recent highs. A sustained move above $120,000 might open the door to $125,000 or beyond.
Downward Risk: Should the price fail to hold above $112,000 and break below, it could slide into the demand zone ($110,000-$107,000). Further weakness might push it toward $105,000, a psychological and technical support level.
Current Trend: The chart shows a descending trendline from the $123,000 peak, suggesting bearish pressure unless a decisive breakout occurs. The 4-hour timeframe indicates indecision, with the range-bound action hinting at a potential volatile move once direction is confirmed.
Keep an eye on these levels for the next big move!
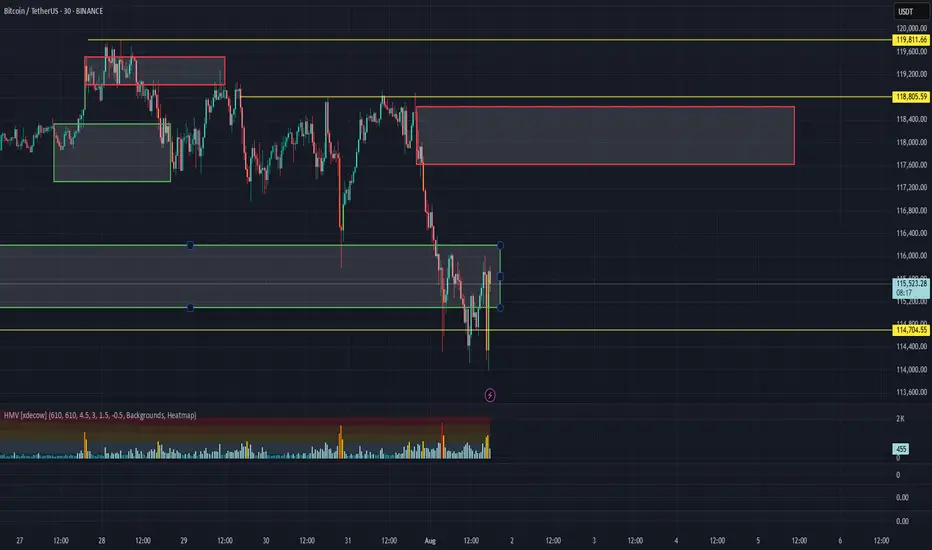
BTC/USDT Analysis – Negative Sentiment Returns
Hello everyone! This is the daily analysis from the trader-analyst at CryptoRobotics.
Yesterday, Trump officially imposed tariffs on 68 countries, which are set to take effect on August 7. The legality of these tariffs is already being challenged in court. The market reacted extremely negatively to this development — despite the overall positive technical setup and volume distribution, Bitcoin dropped to $114,000, deeply testing the volume zone and local lows.
Despite all of this, the bullish scenario should not be ruled out. The price action during the decline has been weak: while selling pressure is high, it has not led to a full breakdown of the lows. At this stage, it’s better to avoid opening new positions. Consider long setups only after a test of the $117,600–$118,600 supply zone, and watch for a buyer’s reaction on the retest.
If negative momentum continues, the price could drop further to the next support zone.
Buy zones:
• $110,000–$107,000 (accumulated volumes)
Sell zones:
• $117,600–$118,600 (accumulated volumes)
This publication is not financial advice.
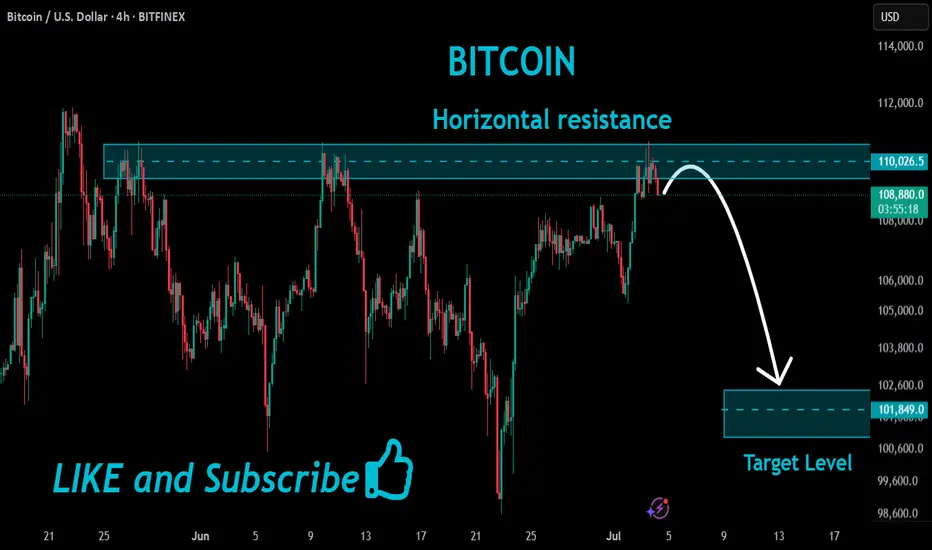
BITCOIN Short From Resistance!
HI,Traders !
#BITCION went up sharply
Made a retest of the
Horizontal resistance level
Of 110026.5 from where we
Are already seeing a local
Bearish reaction so we
Are locally bearish biased
And we will be expecting
A local bearish correction !
Comment and subscribe to help us grow !
BTCUSD - Weekly Bullish Momentum Targeting $115K, Eyeing $137KI'm currently observing a strong bullish structure on the weekly timeframe for Bitcoin, trading at $107,305 at the time of writing. The current weekly candle shows aggressive buying pressure, and if this momentum sustains through the close, we could see a continuation toward the $115,200 level.
There’s visible liquidity and unfilled price action around $109,500, which I expect to be taken out as price moves upward. Once cleared, Bitcoin could either:
1. Continue straight to \$115K+, or
2. Briefly retrace before resuming the uptrend.
From a Fibonacci retracement perspective, BTC previously pulled back to the 38.2% level ~$76,000 before launching into the current leg up, a classic continuation signal within an uptrend.
Given the current price action and historical behavior, I’m targeting the following levels:
Short-term target: $115,200
Long-term target (multi-month): $137,200-$137,300
Stop loss and entry would depend on the timeframe of execution, but from a weekly structure, invalidation would occur if BTC breaks below the last major higher low around $98,000-$96,000.
Let’s see how this weekly candle closes. If the momentum holds, the next leg could already be unfolding.

BNB/USD Bullish Heist: Crack the Vault & Grab the Loot!🤑 BNB/USD Profit Chase 🤑
Chart explorers and wealth hunters! 🚀 Ready to dive into the Binance Coin vs. Dollar (BNB/USD) crypto market? 📊 This Rogue Trade Strategy mixes sharp technicals with market energy to pursue a bullish wave. Follow this guide, ride the momentum, and exit before the danger zone hits. Let’s stack those wins together! 💸🎯
📈 Trade Plan: BNB/USD
Market: BNB/USD (Crypto) 🌍
Outlook: Bullish Surge 🌠
Timeframe: 4h (Swing Trade) ⏳
Entry Zones 📡
Surge Entry (Entry 1): "Crack the code! Spot the MA breakout at 690.0 and jump in—bullish gains are calling!"
Smart Move: Set buy stop orders above the Moving Average or buy limit orders at the latest 15/30-min swing low/high for pullback entries. 📢 Add a chart alert to catch the breakout!
Retreat Entry (Entry 2): "The moment’s here! Wait for the MA pullback in the Market Makers’ Ambush Zone at 630.0, then strike—bold moves win big!" 📍
Pro Tip: Set a TradingView alert for the 690.0 breakout to stay ahead! 🔔
Stop Loss 🚨
Surge Traders: After breakout confirmation, place Stop Loss below the recent 4H swing low at (Entry 1) 660.0 & (Entry 2) 600.0 to shield against reversals. ⚡
Retreat Traders: Adjust Stop Loss to your risk level (e.g., 1-2% of account). Tweak based on lot size and multiple entries. 📏
Risk Note: This trade’s high-octane! Keep position sizes tight to safeguard your funds. 🔥
Profit Target 🎯
Target 735.0, near the Overbought Zone (ripe for consolidation or reversal). 🏁
Exit Play: Cash out early if bearish signals (e.g., high volume, reversal patterns) appear near 735.0. 💵
Scalpers 🔍
Focus on quick Long-side scalps with tight trailing stops. Team up with swing traders for the full plan or grab fast profits if your capital allows. 💰
📡 Why This Trade Shines (May 18, 2025)
BNB/USD is buzzing with opportunity, fueled by:
Technicals: A breakout above the ATR Line (~690.0), paired with higher lows on the 1D chart, signals strong momentum. 📈
Sentiment (May 17, 2025): Social media buzz on platforms like Reddit shows 70% positive sentiment for BNB, with traders hyping altcoin momentum. Fear & Greed Index at 74 (Greed), urging caution near overbought levels. 😎
Fundamentals: CFTC’s COT report (May 16, 2025) reports a 14% WoW increase in institutional long positions in crypto futures, showing big-player confidence. 🗳️
Seasonal Edge: Q2 historically lifts Bitcoin and altcoins, supporting our setup. 📆
Market Flow: USD weakness (DXY down 0.9% this week) and altcoin strength boost BNB’s upside. 🌐
⚠️ Risk Control: Protect Your Gains
News Alert: Skip new trades during major events (e.g., CPI, FOMC) to avoid volatility traps. 📰
Trailing Stops: Activate trailing Stop Loss as price nears 700.0 to secure profits. 🔐
Position Sizing: Cap risk at 1-2% per trade for a smooth ride. 🚦
💥 Kick Off the Chase! 💥
Join the Rogue Trade Strategy squad—like, comment, and follow for more exciting trade setups! 🚀 Your support drives our market missions, paving the way for precise wins. Let’s dominate BNB/USD together! 🤝🏅🎉
Stay Ready: Another trade plan’s coming. Keep your charts locked, traders! 🐱💻😉
🔔 Real-Time Data (May 18, 2025, UTC+1)
BNB/USD Price: ~685.0 (based on aggregated exchange data).
COT Report (May 16, 2025): Institutional long positions in crypto futures up 14% WoW, per CFTC.
Sentiment: 70% positive, Fear & Greed Index at 74 (Greed).
USD Index (DXY): Down 0.9% WoW, supporting altcoin strength.
Disclaimer: Grok is not a financial adviser; please consult one. Don't share information that can identify you.

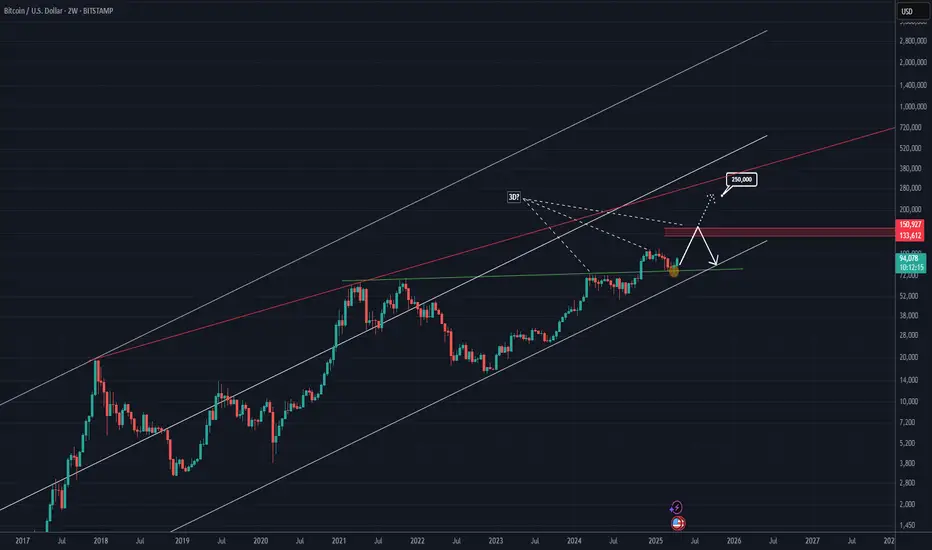
Bitcoin's next targets are 140K and 250K !This analysis is an update of the analysis you see in the "Related publications" section
Are Bitcoin's mid-term targets still valid?
First of all, please review the previous analysis
In our last analysis, we mentioned that if there was any drop, it would likely be towards the resistance line that had been broken, and we identified the pullback zone around the 77K channel.
Now, based on the available data, the pullback has been successful, and Bitcoin's target is to move toward the 130-140K range. A 3D pattern has formed, and the third drive could complete within this range, after which Bitcoin may enter a corrective phase.
But what about the second target | 250K?
Why are we considering this target? There are several reasons:
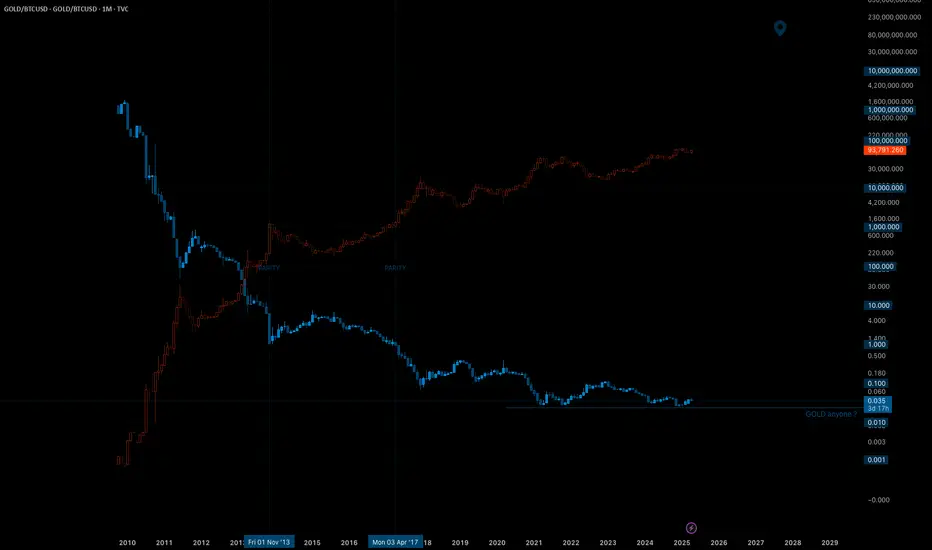
First, the bullish wave in gold was preventing capital from flowing into cryptocurrencies, especially Bitcoin. Now, gold is reaching the end of its bullish wave, which could lead to significant liquidity flowing into crypto and Bitcoin.
Second, Bitcoin's channel structure remains very bullish. If substantial liquidity enters the market, not only could the 250K target be achieved, but Bitcoin might even reach higher levels.
GOLD anyone ?...
hmmm...
...looking at this for a minute a day to smile, relax and recalibrate lasers
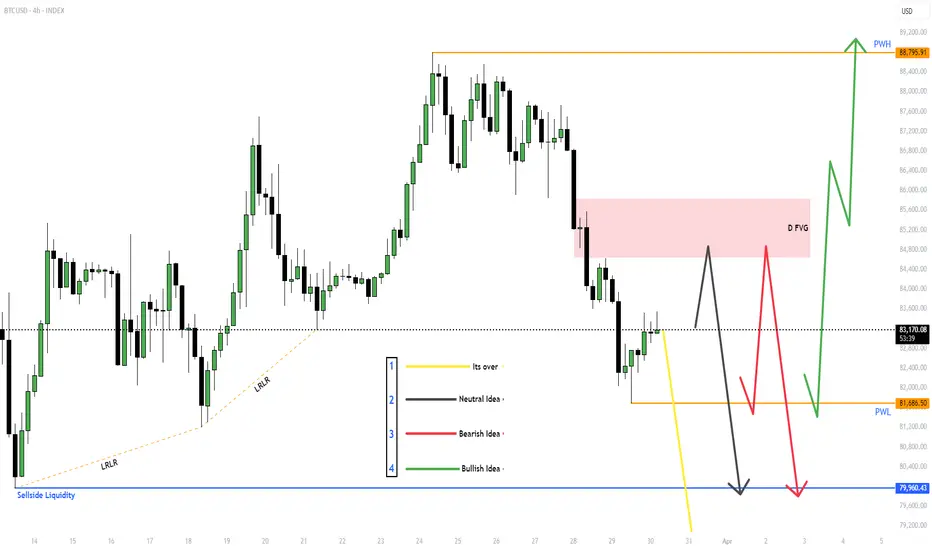
$BTC for Next week (31st March - 4th April)Given out all the ideas, Will react to the market based on which idea presents itself.
If Yellow line - Its better to stay out of the markets.
With the other wait for MSS (Market Structure Shift) and then take the trade and target the other side of the liquidity.
BITSTAMP:BTCUSD , BINANCE:BTCUSDT.P BINANCE:BTCUSDT
Overall I'm neutral on CRYPTOCAP:BTC but SEED_ALEXDRAYM_SHORTINTEREST2:NQ and NYSE:ES look bearish to me, and CRYPTOCAP:BTC could follow.
Crypto liquidations drop 76% as Bitcoin $BTC stabilizes aboveCrypto liquidations plummeted by 76% in the second half of March as Bitcoin BTC CRYPTOCAP:BTC consolidated around $87,000 after earlier volatility. From March 12 to March 25, Bitcoin's price moved within a narrower range, starting at $82,857 and closing at $87,330.
Earlier in March, Bitcoin BTC CRYPTOCAP:BTC saw sharp price movements, dropping below $79,000 before rebounding, coinciding with a spike in long liquidations. The recent decline in liquidations signals more stable market participation and reduced leverage risk.
Between March 12 and March 25, long liquidations totaled $1.26 billion, while short liquidations reached $1.14 billion, down from 7$7.2 billion in long and $2.8 billion in short liquidations from February 24 to March 12.

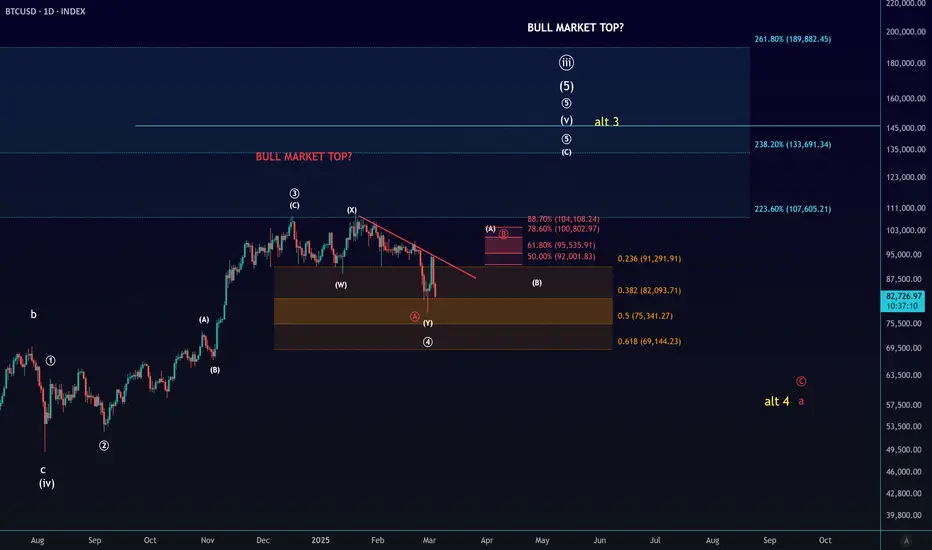
BTC at a Critical Crossroad: One More High to $130K?BTC: The price remains in a larger correction that began in December. While I still view one more high in this cycle as ideal—potentially targeting $130,000—the minimum requirements for completing a larger 5-wave pattern from the November 2022 lows have already been met. Any additional high would be more of a bonus than a necessity.
A break below $69,140 would provide further confirmation that a substantial top has formed, aligning with the red scenario. For now, $69,140 serves as the key bull/bear pivot, helping us distinguish between the possibility of one more high and the onset of a larger correction or even a potential bear market.
Regardless, I am closely monitoring the current price region for signs of an upside reversal. Even if this only results in red wave B, it could still push the price into the $92,000–$104,100 range.
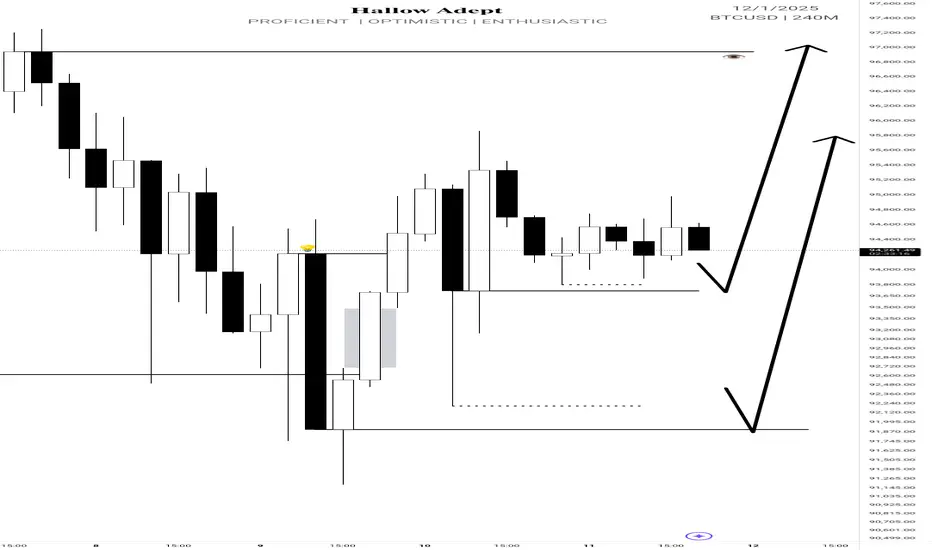
BTC next draw on Liquidity I'm anticipating to LONG BTC based on my bias due to the previous week been bullish and this current week didn't close below the weekly level 93563.35 , it rejected it nicely.
On the daily TF price couldn't get past the daily zone 92620.71 too and we have a break to the upside on H4
I was anticipating to buy from the H4 poi 91902.65 but it's not certain that price is coming back to my poi due to the fact that it already filled the Imbalance before it. Rather I'll be buying from 93720.05 . Till it gets to 99346.28
Please help boost this post if you find it insightful
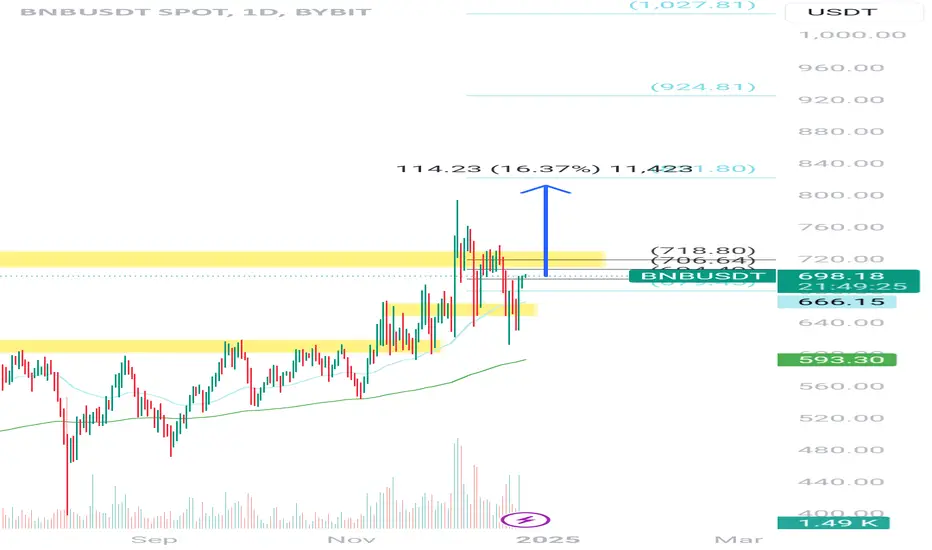
BNB goes to $1,000 ?Through the ups and downs , all we see is BNB maybe one of strong crypto coin that still having pretty solid supporters.
Now (Dec 25th 2024) we're still hovering near resistance level $700-$750.
Look at XRP , BGB, and other coins that been through long long long time in sideways , we should suspect that BNB will soar high anytime soon!
BNB $1,000 is real ?
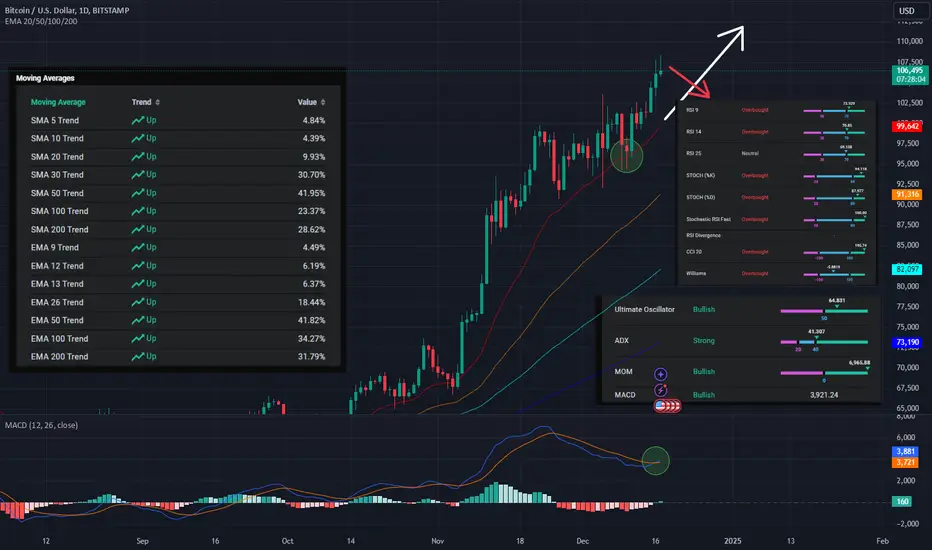
Bitcoin: Hold now, buy laterHello,
Bitcoin is a clear uptrend as the price is above the moving averages, as the picture on the left side of the chart shows. Technical indicators like Ultimate Oscillator, ADX, MOM, and MACD are bullish. However, RSI indicators are overbought, which means Bitcoin might go higher, but there'll be a better time to buy when the market corrects the overbought conditions. I hold my Bitcoins, but I won't buy any more until the upcoming correction, which might come soon.
Regards,
Ely
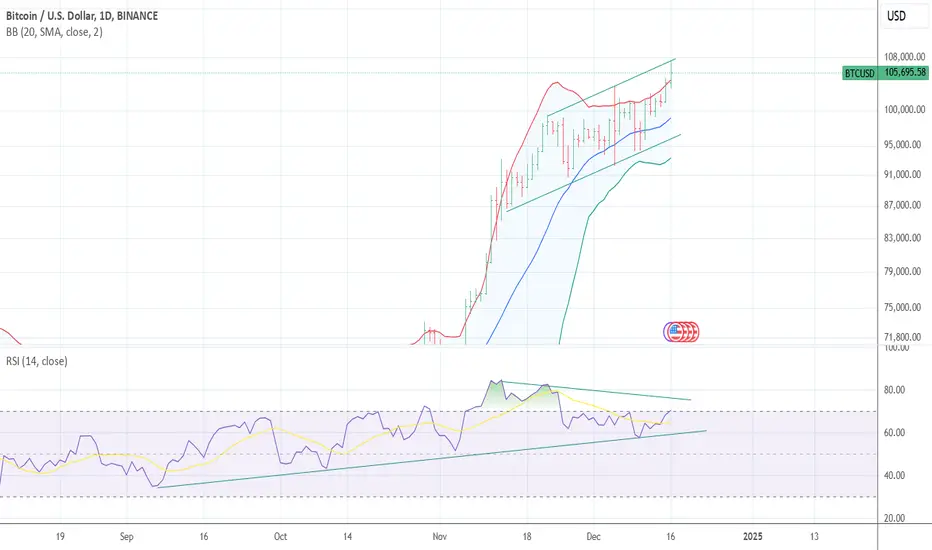
BITCOIN RSI The chart of bitcoin Is giving a Clear WARNING signal . Best of Trades WAVETIMER BTW I AM LONG PUTS IN BITI as of today at 60.8
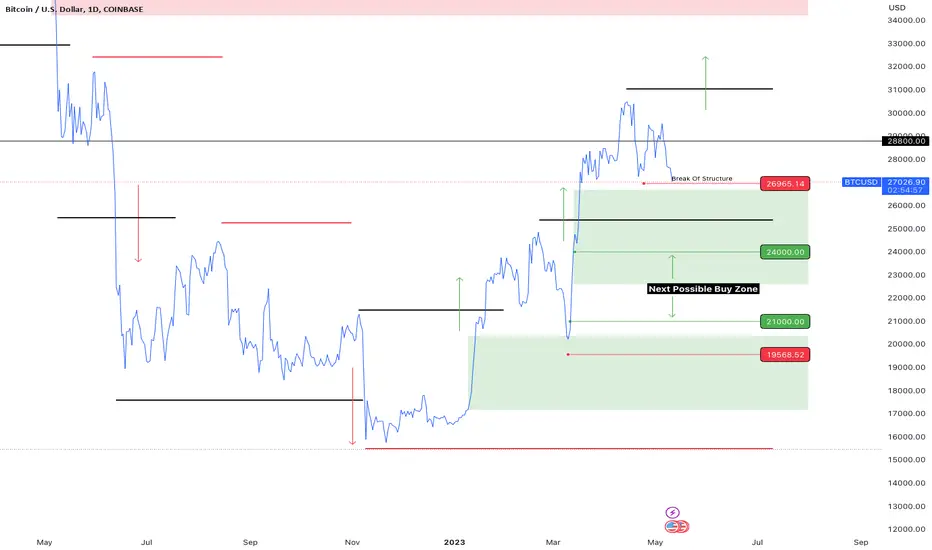
Next BTCUSD buy ZoneI am going to assume that the US dollar is increasing in value until we get to the debt ceiling decision. I am expecting a move up to and perhaps beyond the $103-$104 area.
If this happens I have to assume that the BTCUSD will come tumbling down into my next buy zone. If we don't take out the next weekly level, this will be a great buying opportunity. But some sort of confirmation will be needed.
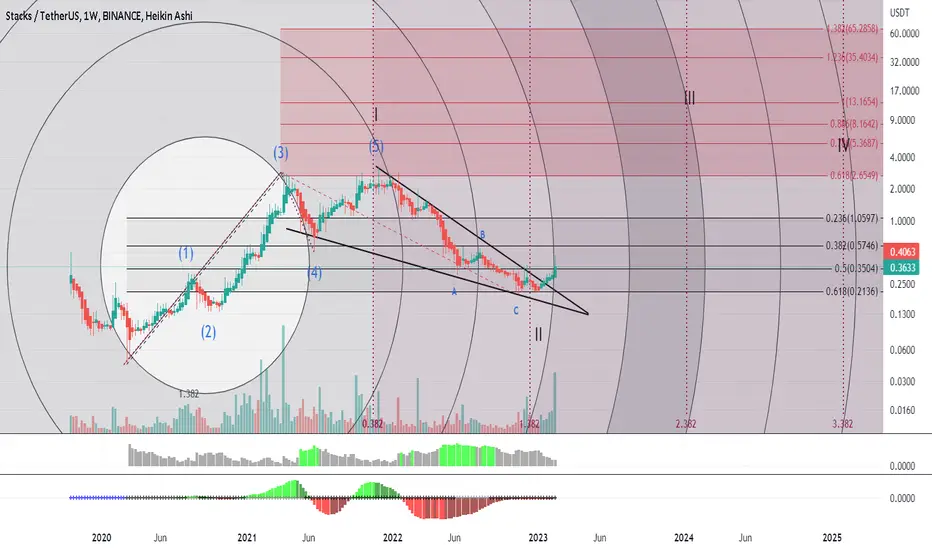
The Road to $66 for STXUSDT (Stacks)$STXUSD has now beautifully broken out of the triangle after an impressive textbook correction at the 0.618 Fibonacci retracement.
This type of correction is a typical feature of wave 2 in an Elliot wave count, which indicates that $STXUSDT is now ready to embark on its third impulsive wave, often referred to as the most explosive one.
Considering the increasing volume, an explosive surge in the number of transactions on the network, and the oscillators, we can expect a swift development in the price towards the following resistance levels:
— 0.57
— 1.06
— 2.85
— 5.96
— 8.16
— 13.17.
#stxusdt #stxusd #BNS #DeFi #BitcoinNFTs #Stacks
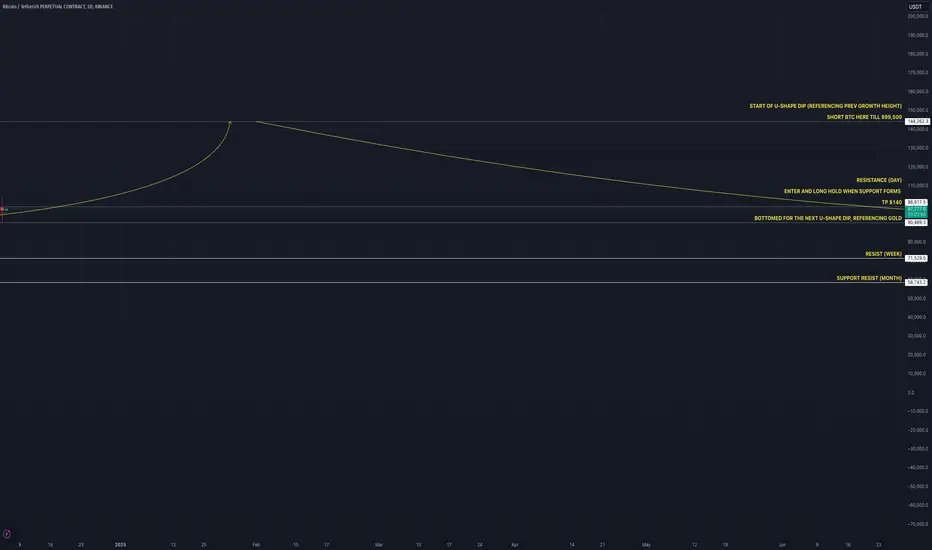
Bitcoin's Big Moves: What’s Happening Now and What Could Be NextBitcoin has been making big waves recently, and many are wondering: where is it headed next? I'll try to break it down step by step (NFA of course), combining technical insights and real-world factors to create a clearer picture.
1. Looking at the chart, Bitcoin’s price has been on a strong upward journey over the past few months. It’s already seen two major six-month periods of growth in recent years, each followed by a pause or a pullback.
2. Right now, Bitcoin is testing a key level near $99,500, a price many traders are watching closely.
What Could Happen Next?
Bitcoin is still in a strong position for long-term growth. While we might see a dip in the short term, it could be a great opportunity for a swing trade to $140,000, especially with more institutions and everyday investors entering the space.
At that levels, we would be expecting a dip, if compared to the behavior of gold in past years. Gold, often seen as a safe haven during uncertain times, has shown similar U-shaped patterns where prices drop slightly before soaring higher.
For now, patience is key. Stay tuned to global developments that could influence the next big move
Why Is Bitcoin Movement as such?
1. Institutional Interest:
Big financial players are diving into Bitcoin. Recent news about Bitcoin-focused exchange-traded funds (ETFs) has drawn massive investments. These ETFs make it easier for everyday investors to put money into Bitcoin without having to buy and store the actual cryptocurrency.
2. Global Trends and Inflation: Around the world, economic uncertainty is pushing people to look for alternative investments. Bitcoin is often called "digital gold" because, like gold, it’s limited in supply and isn’t tied to any government currency. This makes it attractive during times of inflation or when traditional markets are shaky.
3. Rising Popularity of the Network: Behind the scenes, Bitcoin’s network is stronger than ever. The technology powering it, known as the "hash rate," is at record levels, showing that the system is both secure and thriving.
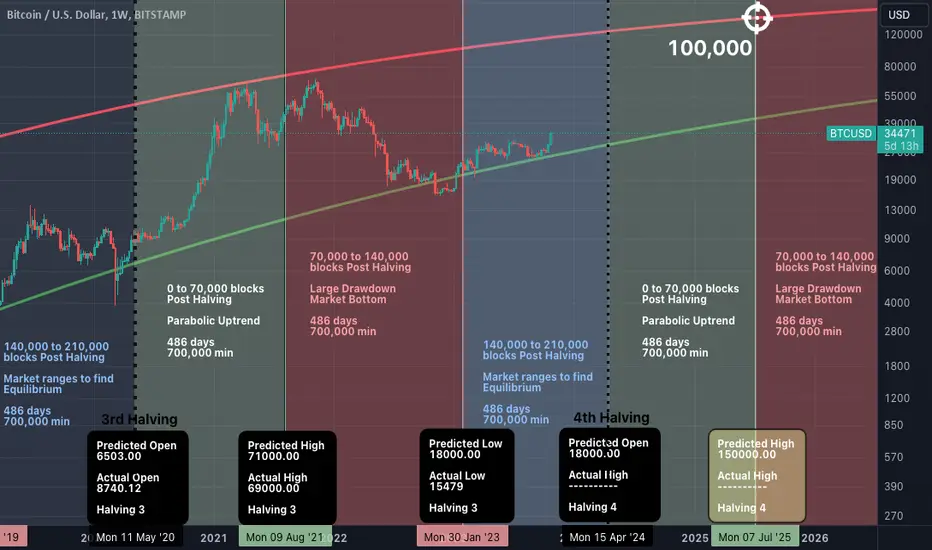
100,000$ per coin - BTC heading to 4th HalvingBITSTAMP:BTCUSD BINANCE:BTCUSD CME:BTC1! COINBASE:BTCUSD
What’s Bitcoin?
Bitcoin is a decentralized digital currency that operates on a network of computers, eliminating the need for intermediaries or central authorities. It was introduced in 2009 by an anonymous individual or group known as Satoshi Nakamoto, who outlined the concept in a white paper describing a peer-to-peer electronic cash system. Since then, Bitcoin has emerged as the leading and most valuable cryptocurrency globally, with a market capitalization exceeding $580 billion as of October 2023.
A notable characteristic of Bitcoin is its limited supply of 21 million coins, a threshold estimated to be reached around the year 2140. The creation of new bitcoins is regulated through a process called mining, which involves solving complex mathematical problems using specialized hardware and software. Miners compete to discover valid solutions that meet a specific difficulty level, adjusted approximately every two weeks to maintain an average block time of 10 minutes. The miner who successfully finds a valid solution for each block is rewarded with freshly minted bitcoins and transaction fees.
As of October 2023, the Bitcoin network has witnessed the mining of 813,378 blocks, with a current reward of 6.25 bitcoins per block.
Key Insights on Bitcoin's Price:
Recently, the mining of the 19.5 millionth bitcoin increased the circulating supply to 93% of the total. Additionally, a logarithmic regression analysis known as the rainbow chart illustrates the historical path of Bitcoin's price movement. This cyclic behaviour can be attributed to several factors:
Bitcoin tends to exhibit an overall bullish trend due to its limited supply and the halving of coins entering circulation approximately every four years. Historically, the Bitcoin halving has been a significant catalyst for price movements as it influences the supply-demand balance. The halving reduces the rate of new bitcoins being introduced into circulation while demand typically remains steady or grows over time. This creates a supply shock that often drives the price upward, particularly before and after the halving event.
Each halving period encompasses the mining of 210,000 blocks and exhibits distinct phases. The bullish phase spans from the first block to the 70,000th block, followed by a bearish phase from the 70,001st block to the 140,000th block, and finally a sideways phase from the 140,001st block to the 210,000th block. As previously mentioned, the halving diminishes the inflation rate of bitcoin and preserves its scarcity.
Bitcoin holds great influence over the entire cryptocurrency market due to its dominant market capitalization. This dominance follows a cyclical pattern, with the market share falling below 40% during bearish phases (after mining more than 140,000 blocks) and rising to around 70% during bullish phases.
During each era (between two halving periods), Bitcoin experiences an average drawdown of 80%.
Current Analysis:
We are currently in the third halving era, which commenced on May 11th, 2020, specifically within the equilibrium phase. The intersection of the mining of the 210,000th block and the lows of the logarithmic regression suggests a value of $30,000 USD per bitcoin.
The next Bitcoin halving is expected to take place in April 2024, at block number 840,000. This event will reduce the block reward from 6.25 bitcoins to 3.125 bitcoins, consequently lowering the annual inflation rate from approximately 1.8% to 0.9%. As a halving typically ushers in a bullish phase, it is predicted that the price of bitcoin will surpass $100,000.00 during this era.
Technical Analysis Using the MVRV Indicator:
One of the tools that can help investors and traders assess the value and potential of bitcoin is the MVRV ratio, which stands for market value to realized value. The MVRV ratio compares the current market capitalization of bitcoin (the total value of all coins at their current price) with its realized capitalization (the total value of all coins at their last moved price). The MVRV ratio can indicate whether bitcoin is overvalued or undervalued relative to its historical average cost basis.
The MVRV ratio can also be used to identify periods of extreme market sentiment, such as euphoria or panic. When the MVRV ratio is very high (above 4), it means that bitcoin is trading far above its realized value, implying that most holders are sitting on large unrealized profits and may be tempted to sell. This can signal a market top or a bubble territory. When the MVRV ratio is very low (below 1), it means that bitcoin is trading far below its realized value, implying that most holders are sitting on large unrealized losses and may be reluctant to sell. This can signal a market bottom or a buying opportunity.
As of October 2023, the MVRV ratio of bitcoin is about 2.110, which is slightly above its long-term average of 2. This suggests that bitcoin is fairly valued and not in a danger zone. The MVRV ratio has been trending up since November 9th 2022, when it reached a low of 0.75, indicating a recovery in the market sentiment and the lowest price of the 3rd Halving era. As we are far from the overbought level of 4, this suggests that there is still room for further growth in the price of bitcoin.
(These illustrations are just for educational purposes and are not financial advices).
Sources:
1. trustwallet.com
2. ieeexplore.ieee.org
3. nber.org
4. buybitcoinworldwide.com
5. bitinfocharts.com
6. nerdwallet.com
7. investopedia.com
8. buybitcoinworldwide.com
9. kitco.com
10. coinwarz.com
11. datawallet.com
12. blockchain.com
13. lookintobitcoin.com
14. bing.com
15. bitcoinmagazine.com
16. stopsaving.com
17. decentrader.com
18. trustwallet.com
19. bitinfocharts.com
20. nber.org
21. buybitcoinworldwide.com
22. cryptonews.com
23. finbold.com
24. inferse.com
25. buybitcoinworldwide.com
26. blockchain.com
#BTCUSDT: Bitcoin to 100k is not far now! Get ready In our previous chart, we identified a potential swing buy planning area at 60k, where we anticipated a price reversal. The price subsequently reversed and is currently at 68k. Examining the price behavior in this pattern, we observe a Wyckoff strategic pattern on the two-day timeframe. The pattern has been completed, and the price is currently in a distribution phase. Potential targets include an all-time high, with 80k as the next target, followed by 90k and a final target of 100k. While this may seem optimistic, we base our actions on observed price behavior, which currently indicates the potential for a significant move. We appreciate your feedback and encourage you to follow for more insights.

Bitcoin ( btc )Btc usdt Daily analysis
Time frame 4 hours
Target 109.000 $ area
Notice , 100.000 $ area is very very important price
Maybe btc move up to 98 -99 and can't break the 100.000 $ and come down and rest and reserve energy with rectangle oe flag pattern or etc
On the other hand btc will break the 100.000$ line strongly and fly to my target 112.000 $ area
We must be patient and watch carefully on chart and listen to good or bad news about crypto to have a good profit