Analytics: Market Outlook and Predictions
📈 WHAT HAPPENED?
Last week, US President Donald Trump once again "shook up" the financial markets.
The report published by the White House was received positively and contributed to the recovery of the Bitcoin price. But soon after, new import duties were introduced, which changed the short-term trend of the first cryptocurrency to a downward one. Unfortunately, no one is immune to FUD.
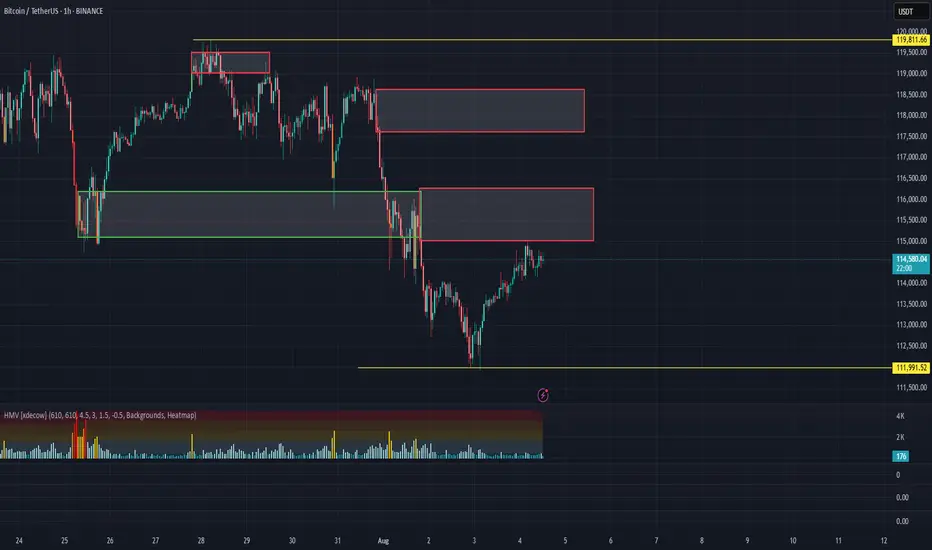
The local minimum was recorded at $112,000, after which the price rebounded slightly, but didn’t reach the key zone of $110,000-$107,000 (accumulated volumes).
💼 WHAT WILL HAPPEN: OR NOT?
Currently, buyer activity remains weak, with significant volumes concentrated above the current price, and no active demand at the local lows. Another wave of sales is likely from the $115,000-$116,300 zone to the formed low of $112,000.
On the other hand, wave analysis shows the weakening of sellers. The market has already absorbed the last wave of sales, and there was a break on the hourly timeframe. With the growth of buying volumes, a rebound to the nearest volume resistance is possible. However, we’ll most likely not be able to do without strong sales, and we’re highly likely to see Bitcoin at $110,000.
Buy Zones:
$110,000–$107,000 (accumulated volume)
Sell Zones:
$117,600–$118,600 (accumulated volume)
$115,000–$116,300 (mirror volume zone)
📰 IMPORTANT DATES
Macroeconomic events that we’re following this week:
• Tuesday, August 5, 13:45 (UTC) — publication of the business activity index (PMI) in the US services sector for July;
• Tuesday, August 5, 14:00 (UTC) — publication of the US Non-Manufacturing Purchasing Managers' Index (ISM) for July;
• Thursday, August 7, 11:00 (UTC) — announcement of the UK interest rate decision for August;
• August 7, Thursday, 11:30 (UTC) — publication of the Bank of England's letter on UK inflation;
• August 7, Thursday, 12:30 (UTC) — publication of the number of initial jobless claims in the United States for August.
*This post is not a financial recommendation. Make decisions based on your own experience.
#analytics
Bitcoinoverview
BTC/USDT Analysis: Watching the Reaction at the HighHello everyone! This is a daily analysis from the trader-analyst at CryptoRobotics.
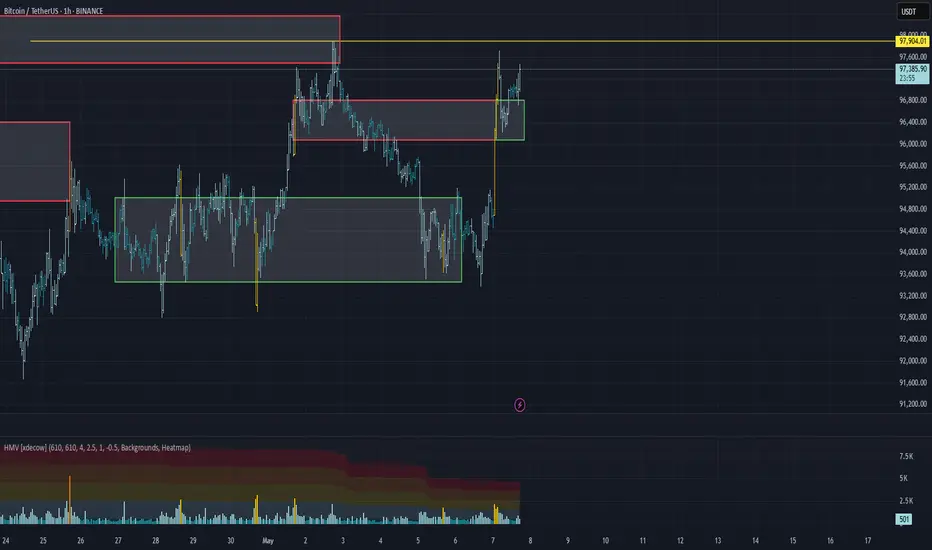
Yesterday, Bitcoin finally broke out of the range to the upside. The local selling zone at $96,100–$96,600 didn’t show any reaction. On the retest, it acted as a mirror level and supported continued growth.
At the moment, the local bias has shifted. All major volume clusters are now located below the price, so we can expect a new high. If we break through the current high, it’s important to watch the sellers' reaction. A false breakout could lead to a significant drop, but if it doesn't happen, the next potential target is $105,000.
Sell zones:
$98,000 (key level)
$107,000–$109,000 (volume anomalies)
Buy zones:
$91,500–$90,000 (strong buy-side imbalance)
$88,100–$87,000 (absorption of market selling)
$85,500–$84,000 (accumulated volumes)
$82,700–$81,400 (volume zone)
$74,800 (key level)
$69,000–$60,600 (accumulated volumes)
What do you think — which scenario will play out?
Drop your thoughts in the comments — it's always interesting to compare views!
This publication is not financial advice.