BITCOIN CRASH PREDICTED! HERE’S WHAT HAPPENS NEXT! (scary)Yello Paradisers, Bitcoin crashed exactly as we predicted in the previous videos that it will happen with the highest probability.
In this video I am explaining to you what's gonna happen next.
Head and shoulders, neckline, is be breaking to the downside, we need a clear confirmation of a reclaim Our channel on high timeframe is getting breakout to the downside and confirmation was that a reclaim was already successful.
In this video I'm sharing with you Elliott Way theory on low timeframe and what needs to be done for confirmation perspective in order for us to continue to go to the downside or have a reversal to the upside.
Don't be a gambler. Don't try to get rich quick. Make sure that your trading is professionally based on proper strategies and trade tactics.
Bitcoinprediction

BTCUSD Short Setup – 4H Bitcoin has broken below a key dynamic support zone, and current price action signals a potential continuation to the downside. This short entry is supported by multiple technical confluences:
🔻 Bearish Confluences:
Fibonacci Retracement Rejection: Price rejected the 61.8% Fib retracement zone near $114,978, confirming a potential local top.
Trend Structure: Clear lower high, lower low structure forming on 4H – momentum favors sellers.
EMA Cloud Pressure: Price is decisively below the multi-band EMA cloud, showing sustained bearish pressure and trend bias.
Volume Profile Gap: Price is entering a low-volume node between $113.8k and $112k, increasing likelihood of a sharp move down.
Bearish Candlestick Pattern: A strong bearish engulfing candle formed after the retracement – a classic reversal confirmation.
🎯 Fibonacci-Based Targets:
TP1 – $11205 (38.2%): Initial demand zone and minor support.
TP2 – $11024 (61.8%): Mid-extension level, aligns with prior consolidation.
TP3 – $10731 (100%): Full measured move target if the downtrend accelerates.
SL: Placed just above the recent swing high at $11678, protecting against false breakouts.

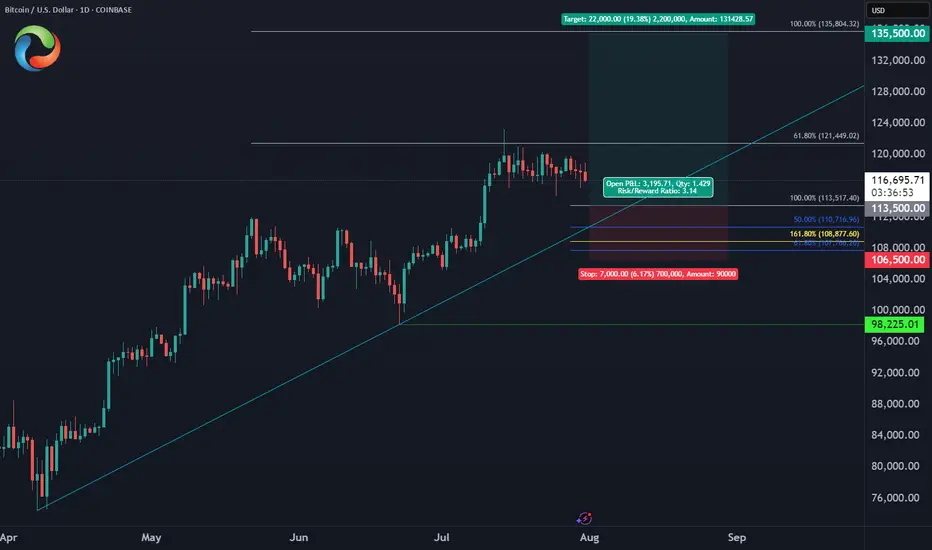
Bitcoin August Trade PlanBINANCE:BTCUSD
✅Entry Zone: $113,500 - $110,700
⛔️Stop: $106,500 (below June low)
🎯Target: $135,500 (ATH liquidity)
🔖Risk/Reward: 1:3
BTC/USDT Analysis: Testing Strong Support
Hello everyone! This is the daily analysis from CryptoRobotics' trader-analyst.
Yesterday, we tested the local support zones previously marked and moved into a decline. At 21:00 (GMT+3), the U.S. Federal Reserve released its monetary policy statement, which included hawkish comments regarding inflation risks. The interest rate remained unchanged. The market reacted negatively to this news, and Bitcoin accelerated its drop.
At one point, a key buyer zone at $116,200–$115,000 (volume anomalies) was tested. Then, between 21:30 and 22:00 (GMT+3), a report from the White House on digital assets was released, shifting focus toward a more positive regulatory outlook. Bitcoin bounced from the mentioned zone and has since fully recovered the drop.
Currently, there are no immediate resistance levels, so in the near term, we’re likely to see a test of the ~$120,000 level. There, it's important to watch for any signs of selling pressure.
Buy Zones:
• $116,200–$115,000 (volume anomalies)
• $110,000–$107,000 (accumulated volume)
This publication does not constitute financial advice.
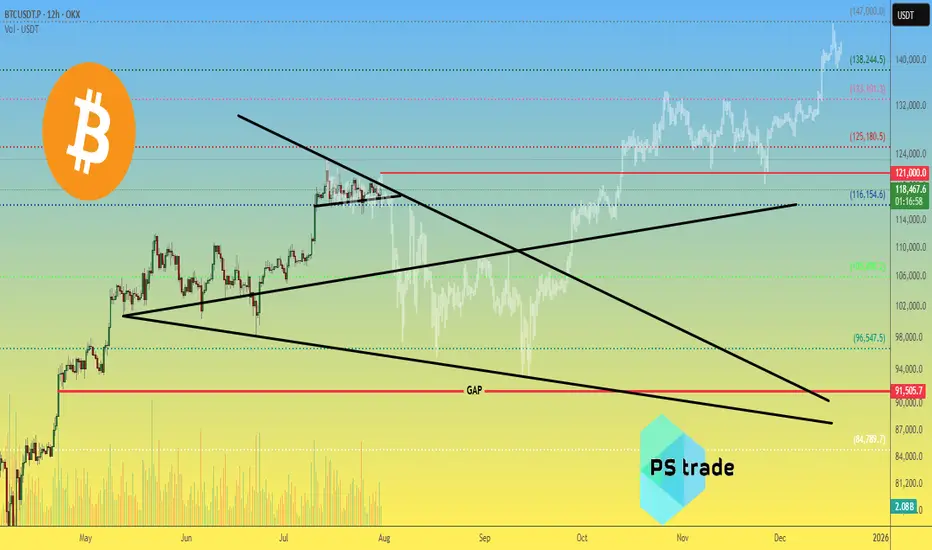
Bitcoin BTC price analysis by the end of 2025🕯 July is coming to an end, with 3 weeks of OKX:BTCUSDT consolidation between $117k–121k.
Tomorrow begins the last month of summer — and it promises to be "hot" as, according to our earlier published calendar Trump's administration plans to send letters with new, increased tariffs to "all countries" on 01.08.
💰 Also, take a look at Bitcoin Monthly Returns. In our view, 2025 resembles 2020 the most.
What do you think?
👉 According to this dynamic, the real "hot" may come not in summer, but late autumn.
💰 We've also tried to find a price fractal for #BTCUSD that fits the current structure — and for now, it looks plausible:
◆ In the coming days, CRYPTOCAP:BTC should not rise above $121k.
◆ A low of correction might hit mid-September around $93k.
◆ A cycle top for #BTC could arrive to the end of 2025, near $147k.
📄 Now that you've seen our version — share your forecasts on future #BTCUSDC price action in the comments 👇
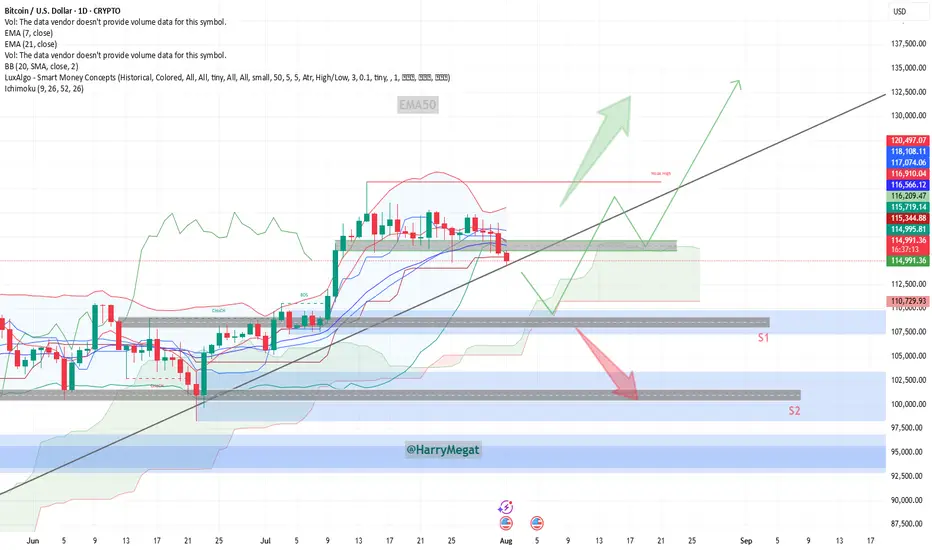
Analysis BTC/USD Daily ChartAnalysis BTC/USD Daily Chart
**Chart Overview (Daily Timeframe)**
**Current Price**: \~\$114,937
**EMA 7**: \$116,896 (short-term)
**EMA 21**: \$116,561 (medium-term)
**Trendline**: Price is testing the long-term ascending trendline
**Key Zones:**
* **Support 1 (S1)**: \~\$110,000
* **Support 2 (S2)**: \~\$102,000
* **Immediate Resistance Zone**: \~\$116,000–\$120,000
**Bullish Scenario**
**Conditions**:
* Price **holds above the ascending trendline**
* A strong **bounce from current level (\~\$115K)** or a reclaim above **\$116K**
**Buy Setup**:
* **Entry**: \$115,000–\$116,000 (if bounce confirmed)
* **Stop-loss**: Below \$114,000 or the ascending trendline
* **Targets**:
* TP1: \$120,000
* TP2: \$125,000
* TP3: \$132,000+
**Confirmation**:
* Bullish candle formation near the trendline
* Reclaim of EMAs (especially EMA 7)
**Bearish Scenario**
**Conditions**:
* Price **breaks below the ascending trendline** and **closes below \$114K**
* Rejection from \$116K zone with a strong red candle
**Sell Setup**:
* **Entry**: Below \$114,000 (on confirmed breakdown)
* **Stop-loss**: Above \$116,000
* **Targets**:
* TP1: \$110,000 (S1)
* TP2: \$105,000
* TP3: \$102,000 (S2)
**Invalidation**:
* Quick recovery above \$114.5K and trendline reclaim = possible fakeout
**Bias**
**Neutral to Bullish**, as price is **at trendline support**.
Watch closely for **price reaction at current levels** for the next directional trade.
BTCUSD - Follow Up AnalysisTaking a look at the daily chart, price action did come down as previously expected in my last article.
Now we're heading into an area of strong support and I expect to see some sideways action until something significant happens next.
How I'm trading this price action?
I believe price action may continue to bounce around from the current price of 113,600 down to 110,000 for at least the next few days. With that said I'm implementing my range trading strategy. The range trading strategy also known as the Bitcoin Scalper scalps on the 1 and 5min timeframe creating sort of like a grid style approach but it's based on candlestick momentum. Since it trades off momentum, it's able to detect breakouts and know when to switch from the ranging strategy to the breakout strategy.

BTC/USDT Analysis – Negative Sentiment Returns
Hello everyone! This is the daily analysis from the trader-analyst at CryptoRobotics.
Yesterday, Trump officially imposed tariffs on 68 countries, which are set to take effect on August 7. The legality of these tariffs is already being challenged in court. The market reacted extremely negatively to this development — despite the overall positive technical setup and volume distribution, Bitcoin dropped to $114,000, deeply testing the volume zone and local lows.
Despite all of this, the bullish scenario should not be ruled out. The price action during the decline has been weak: while selling pressure is high, it has not led to a full breakdown of the lows. At this stage, it’s better to avoid opening new positions. Consider long setups only after a test of the $117,600–$118,600 supply zone, and watch for a buyer’s reaction on the retest.
If negative momentum continues, the price could drop further to the next support zone.
Buy zones:
• $110,000–$107,000 (accumulated volumes)
Sell zones:
• $117,600–$118,600 (accumulated volumes)
This publication is not financial advice.
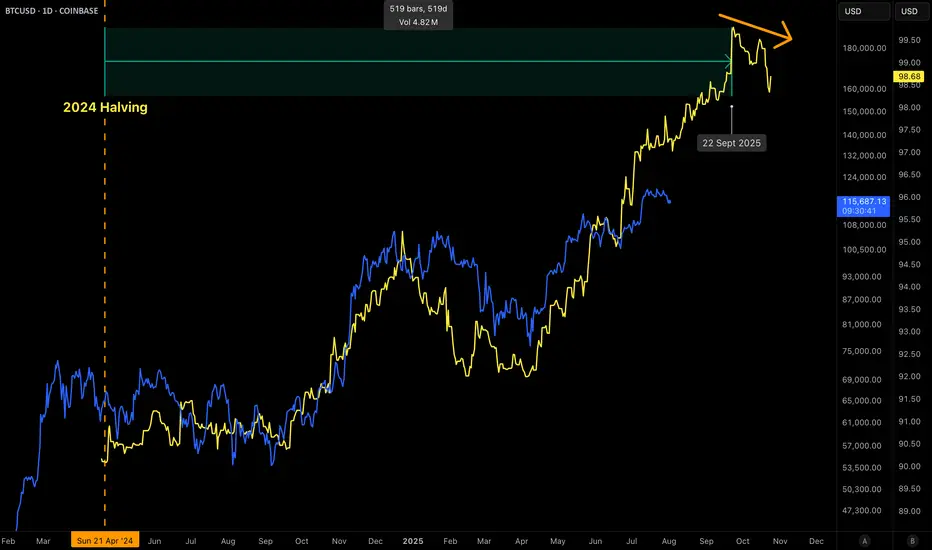
BITCOIN 2025 TOP PREDICTION!This chart represents the M2 Money Supply / BTCUSD correlation with an 84-day delay.
You can see that the M2 Money Supply has formed a double top (with a lower high) in late September.
The price of bitcoin tops out 525–532 days after the halving in every cycle.
What does this mean?
In my opinion, bitcoin will continue to follow the direction of M2 in a highly correlated manner. This would mean that BTC's top is only 2 months away.
What price will bitcoin top?
That I'm not entirely sure of yet. The M2 / BTC correlation can be placed in a plethora of different scales. However, it currently looks like the top will be BELOW $200,000.
I hope to be proven wrong, but as of right now, bitcoin is following previous cycles perfectly (excluding the fact that we created a new ATH prior the halving, this was because of ETFs).
Given diminishing returns (and assuming that "supercycle" is not reached), $135,000 - $190,000 top in late September makes sense.
More Pullback=Further Launch!!The structure has morphed
once again but the direction expectation
is still 100% in tact. In fact, all
we're doing right now is pulling
the bow string back a little more to
allow the arrow to fly up that
much further and faster! BTFD!!!!

BTC is likely to resist falling below $112000BTC is likely to resist falling below $112000
If the confluence between the yellow trendline and the top green horizontal support level dont hold strong, we are likely to see BTC retrace to $100K
Please trade with care.
My thoughts are shown on the chart technically
I hope to connect with you.
Please like, share, comment and follow me.

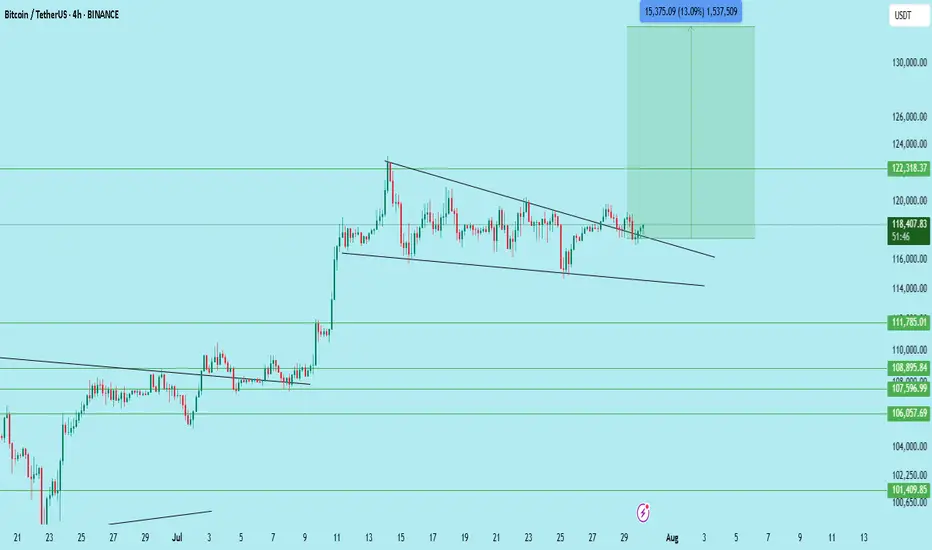
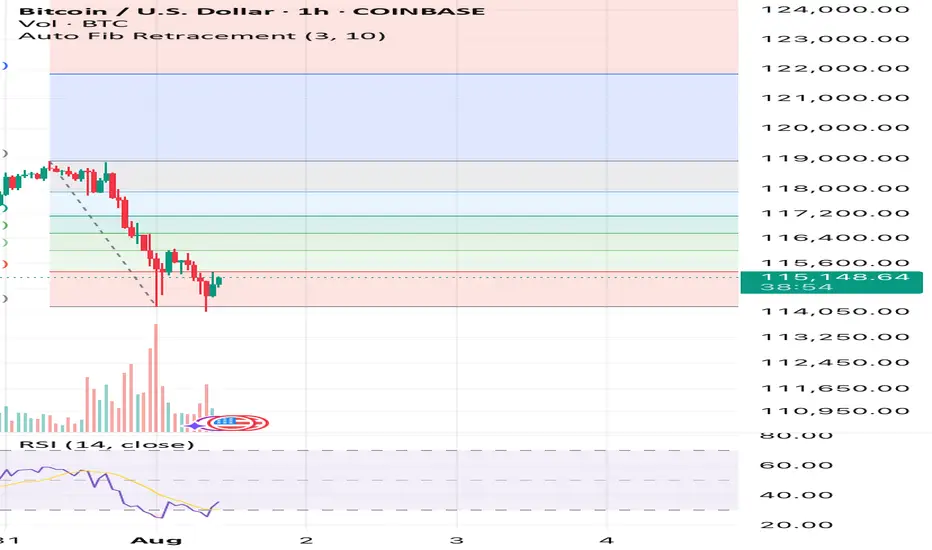
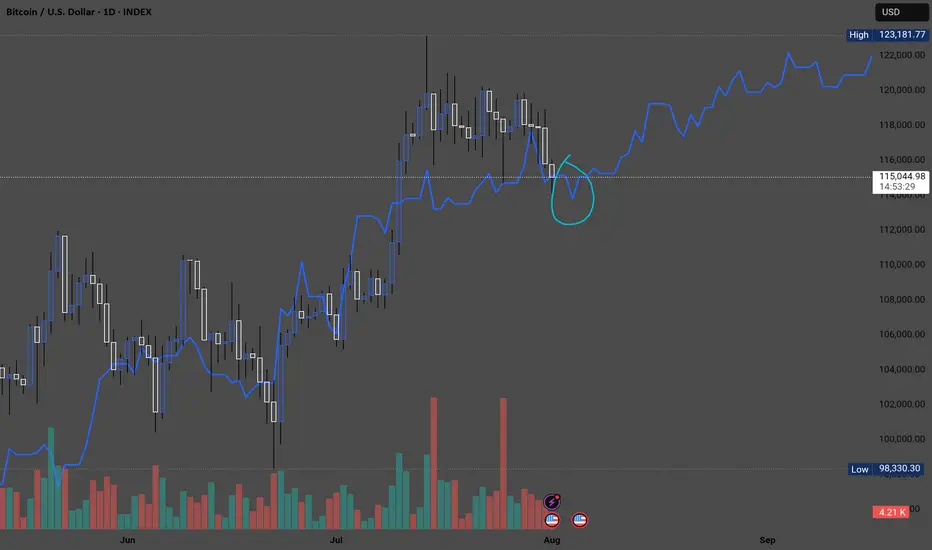
Bitcoin has an upside to it if we hold above $14,900See what you think it’s simple Auto Fib Retracement and RSI. That’s all I’m using here and also past times and other data outside of this image but inside the CRYPTOCAP:BTC market.
What you think? Up to $118k again before down or sideways? Or will this be the end of the large bull flag formation? We’ll soon find out!
Dip before the next run? Bitcoin has recently seen a significant dip from it's all-time highs, about 7% at the time of writing. The global M2 money supply is considered a strong indicator for predicting Bitcoin's price movements. Currently, it suggests that bitcoin may continue to decline before experiencing a reversal. According to this indicator, a bullish run could begin around August 10. But of course like all indicators nothing is certain. OKX:BTCUSD
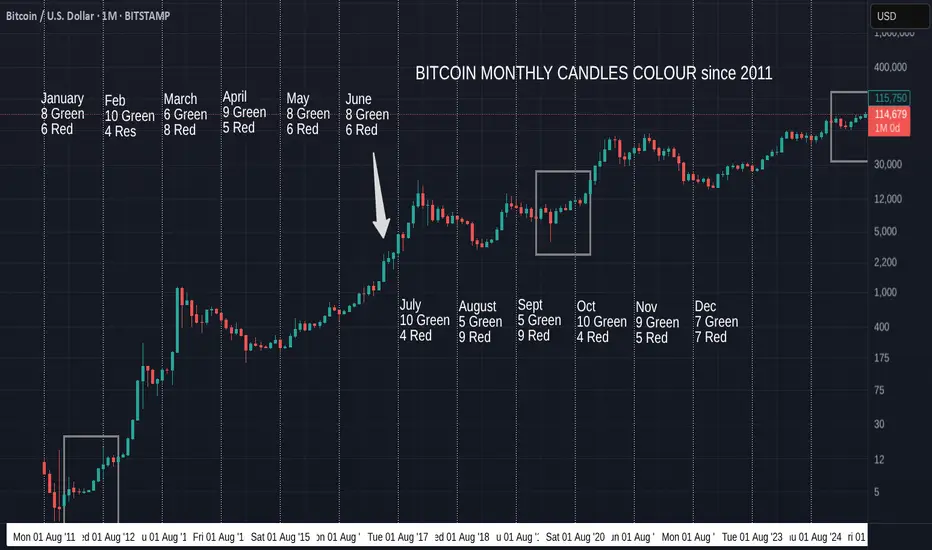
Bitcoin Monthly Candle Colour patterns and Colours since 2011
We got the expected GREEN July and so, amazingly, we continue to repeat the pattern from January to July 2012. ( Left Box )
It is almost the same pattern as 2020, apart from the Red May candle in that Year. (Right box)
The Large Arrow points towards another occasion where we had a series of consecutive Green candles from March to July, though these candles sizes are nothing like the ones we are currently experiencing.
The Boxes show us The only 2 occasions where we have had a Green December, Red January, Red February, Green March, Green April.
Then we had a Green May 2012 and a Red May 2020
Then both repeated a Green June, Green July.
The thing to note here is how all these are en-route to Cycle Highs.
So, August count currently is 5 Green to 9 Red, so the Odds are, while looking at BTC History, that we will get a RED August
HOWEVER, if we continue this run of following previous patterns, we will see a GREEN August.
In fact, 3 of those 5 Green August closes were in these 3 patterns mentioned.
Every single one of the 5 Green previous August followed a Green July, the last time was in 2021.
As mentioned in last months report, the size of the candles currently in this pattern are more like those in 2020 than the other 2 patterns talked about here.
With this in mind, we may expect a smaller Green candle close for August , Followed by a small Red candle in September. This did also happen in 2017 ( Arrow).
This August has opened Red but so far this year, many month opens were red and then changed.
So, My expectation id for a small Green August as markets cool off over the holidays and we wait for the start of Q4 in October.
We will have to wait and see as ever
Stay safe
BITCOIN & 134KAfter Bitcoin rallied on July 8 and consolidated for two weeks, this bull flag remains valid, targeting $134,000.

BTC this other snicky guyit is amazing as the meassures remains the same
The buy it is not ready the buy is in 113.500
either from 121000 or from 122000 it will fall, Im in the internalk buy right now and also will be selling from 121.000 and 122.000 too
GG

BTC/USD – 4H Short Setup AnalysisBitcoin is currently trading within a defined range under macro resistance. The chart shows price stalling below a key supply zone, with rejection from the upper Keltner Channel and diagonal resistance (yellow trendline). A local bearish divergence appears to be playing out as momentum fades.
📉 Short Position Setup:
Entry: $119,275 (supply retest)
Stop Loss: Above local high / top channel boundary
Targets:
TP1: $117,163 (38.2% Fib)
TP2: $115,858 (61.8% Fib)
TP3: $113,746 (full measured move)
Confluence:
Bearish rejection near multi-touch trendline resistance
Lower high formation after extended consolidation
Heikin Ashi candles showing loss of bullish momentum
Watch for: Breakdown of the white trendline support to confirm momentum shift. Invalidation if BTC closes strongly above $120,000.
Timeframe: 4H | Strategy: Range Reversal + Fib Confluence

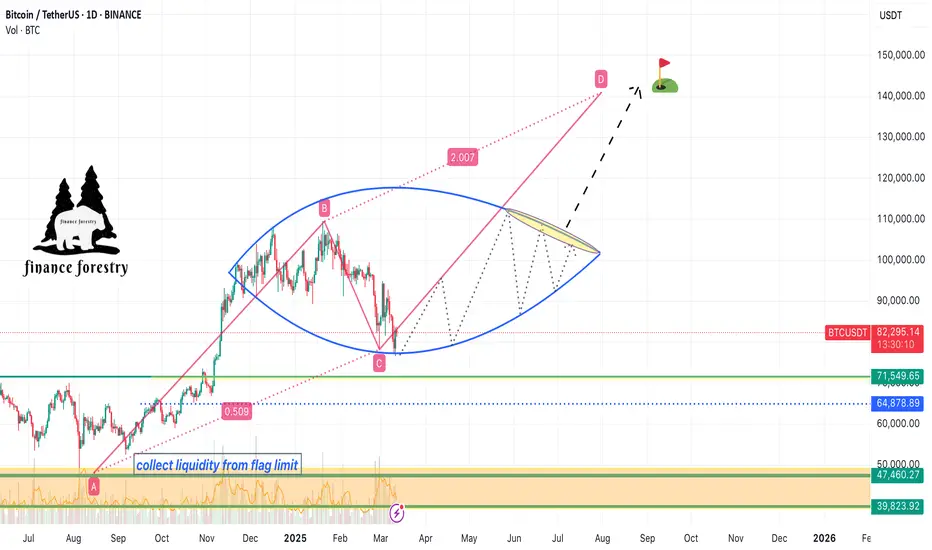
Bitcoin's Natural Correction and the $141K Target Based on Fibonhello dear trader and investors
The cryptocurrency market is always accompanied by strong fluctuations and natural corrections. Bitcoin, as the market leader, requires corrections and liquidity accumulation after each significant rally to pave the way for higher price targets. In this article, we analyze Fibonacci structures and harmonic patterns to demonstrate that Bitcoin's next target could be $141K.
1. Bitcoin Corrections: A Natural Part of an Uptrend
Price corrections in bullish trends are a normal phenomenon that helps shake out weak hands and allows major players to accumulate liquidity. Historically, Bitcoin has experienced 20-30% corrections before resuming its upward trajectory. The current correction is no different and may serve as a base for the next strong move toward higher targets.
2. The $141K Target Based on Fibonacci
Fibonacci levels are among the most reliable tools for predicting price targets. Assuming Bitcoin's recent high was around FWB:73K and the ongoing pullback is a healthy retracement, we can use harmonic AB=CD pattern to project potential upside targets. Based on these levels, Bitcoin could reach $141K in the next bullish phase.
Confirmation Through Harmonic Patterns
Harmonic patterns like Butterfly and Gartley suggest that the current correction is forming a potential reversal structure. If this correction completes within the PRZ (Potential Reversal Zone), Bitcoin could see a strong continuation of its uptrend. The Fibonacci ratios in these harmonic structures indicate that the final price target for this bullish wave could be around $141K.
Volume and Liquidity: Key Drivers for the Rally
Bitcoin needs increased volume and liquidity inflows to reach higher levels. On-chain data shows that trading volumes are rising and large investors (whales) are accumulating rather than selling. This behavior typically precedes a strong bullish move.
Bitcoin's current correction is entirely natural, and technical structures suggest that it could be laying the foundation for a new bullish wave. Based on Fibonacci and harmonic pattern analysis, Bitcoin's next major target is around $141K. Traders and investors should consider these levels in their analysis and avoid emotional decisions during market corrections
good luck
mehdi
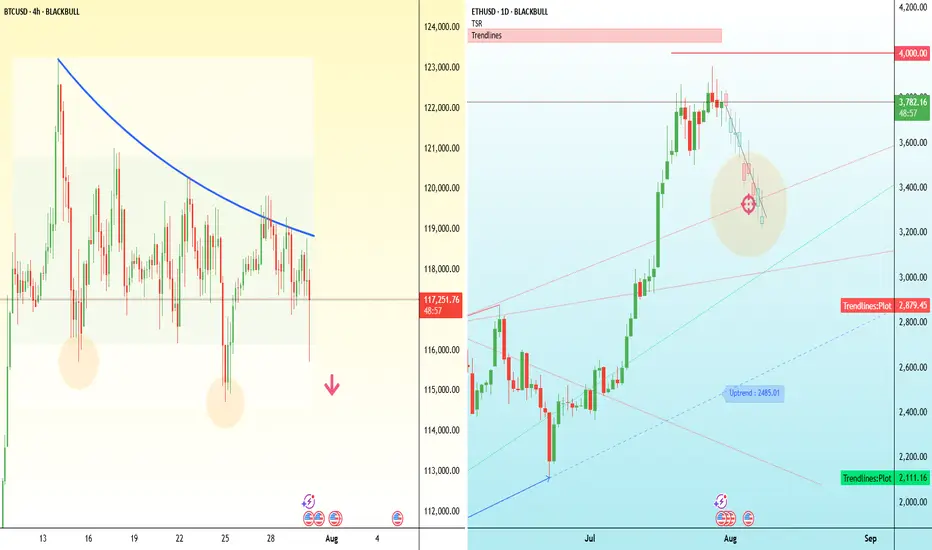
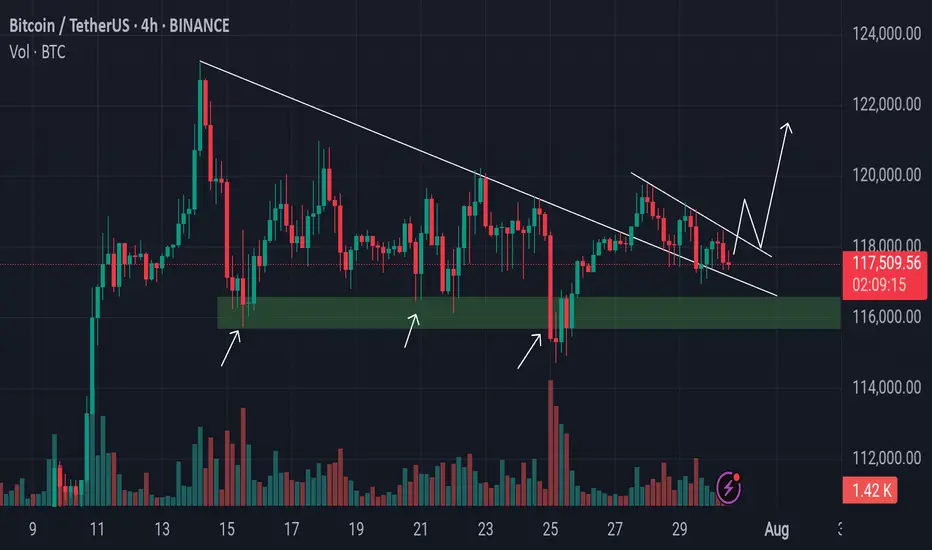
Major test for crypto bulls - BTC and ETH Bitcoin has dipped below $118,000, putting pressure on the bullish structure that’s held for the past two weeks.
The attempted breakout above $121,000 has failed, and price is now breaking down through the middle of the consolidation range, threatening short-term higher lows. On the 4H chart, this move resembles a failed breakout with a potential double-top near $121,000.
If Bitcoin can’t reclaim $116,000 quickly, the next downside levels to watch are $114,000 and $110,000.
Ethereum, meanwhile, has stalled just below $3,800 after a strong rally this month. Price action has flattened out over the past few days, with several failed attempts to push through that level. The key upside trigger remains $4,000.
But if $3,700 gives way, ETH may slide back to the $3,450–$3,300 region, where previous resistance and the rising trendline converge.
Bitcoin Are We Heading to 140K or 80K ??? Here is the Analysis Based on what is happening here is what we currently see with Bitcoin
Idea 1: If we can break 119K then here are the following levels Bitcoin can go to :
122K
126K
135K
140K
Idea 2: If we continue and break further bearish here are the levels BTC can go to
115,600
114,500
112,800
If we go below this level then a larger correction thesis would point us with a deeper bearish level
Happy Trading
Trade Smarter Live Better
Mindbloome Exchange
Kris

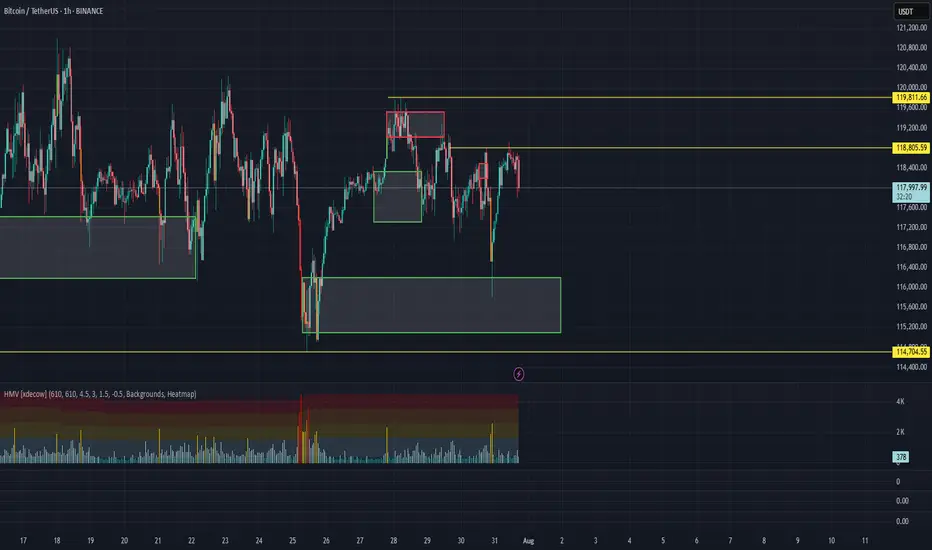
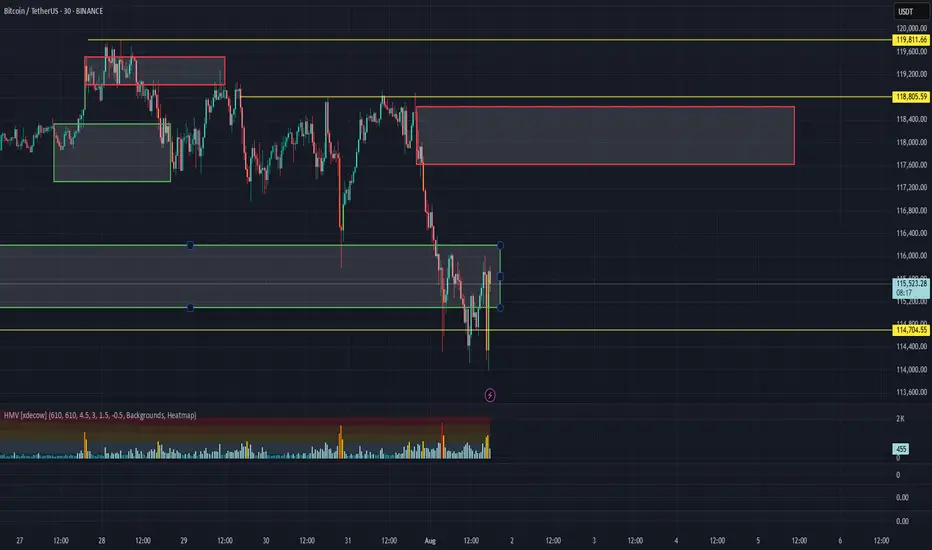
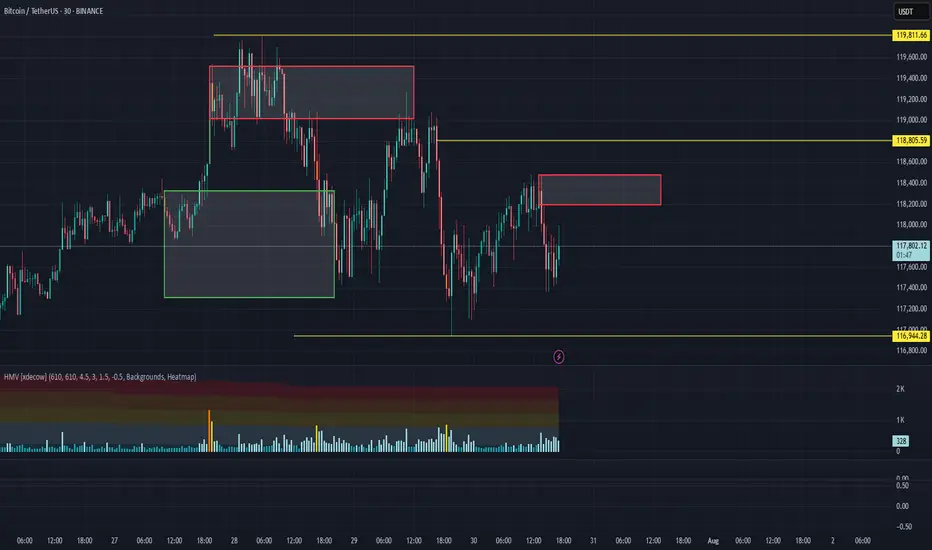
BTC/USDT Analysis — Hidden Buyer
Hello everyone! This is the daily analysis from the CryptoRobotics trading analyst.
Yesterday, Bitcoin continued its move toward the local low and formed a false breakout.
Throughout the decline, we observed a positive delta, which may indicate gradual accumulation of long positions. At the same time, the descending trendline has not yet been broken, and there was strong absorption of market buys around ~$118,400 and ~$118,800 — which makes entering long positions very risky at the moment.
Our main expectations are based on further rotation within the range marked in yesterday’s analysis. In the short term, we are watching for a test of two local zones to assess the reaction from sellers. If the reaction is weak, a test of the upper boundary of the new sideways range is quite possible.
Buy zones:
$116,200–$115,000 (volume anomalies)
$110,000–$107,000 (accumulated volume)
Sell zones:
~$118,400 and ~$118,800 (local resistances)
This publication is not financial advice.
Bitcoin Retests Broken Trendline Minor Resistance in Focus!Bitcoin has recently taken support from the lower levels and moved upward, successfully breaking above a key trendline resistance. Currently, the market appears to be forming another minor trendline resistance on the short-term chart. Interestingly, the previous trendline that was broken is now acting as a support zone, indicating a potential shift in market structure.
If the price manages to break this newly developing minor trendline resistance, we may expect a possible retest of that level. Should the retest hold, it could provide a strong bullish signal, allowing Bitcoin to continue its upward movement toward higher liquidity zones or resistance levels.
$BTC/USDT – Bull Flag Breakout on 4H | Targeting $133,700Bitcoin has just broken out of a well-defined bull flag structure on the 4H chart, signaling a potential continuation of the previous uptrend.
This breakout comes after a strong impulsive move upward, followed by a textbook flag consolidation with lower highs and lows forming a descending channel. The breakout above the flag resistance suggests a bullish continuation pattern is in play.
Technical Breakdown:
Pattern: Bull Flag (Continuation)
Flagpole base: ~106,700
Breakout zone: ~117,600
Retest Support: 116,000
Immediate Resistance: 122,300
Expected Target: 133,700 (based on flagpole projection)
Invalidation: Breakdown below 115,500
Expected Move:
Measured Move Target: ~13% upside from breakout
Confluence: Target aligns with past supply zone near 133K–135K
Price has also reclaimed the 50 EMA on the 4H chart, and the volume on the breakout shows bullish interest. Watching closely for a clean retest of the breakout zone for confirmation.
Conclusion:
BTC is showing bullish continuation after breaking out of a flag. A successful retest of 117.6K–116K range could offer further upside. Traders should manage risk accordingly.
DYOR | Not Financial Advice