Bitcoin-is that it for now ? Lazy summer, take off in September?
Not posted this chart for a while but we may find it has become Very relevant to what to expect for the next few months
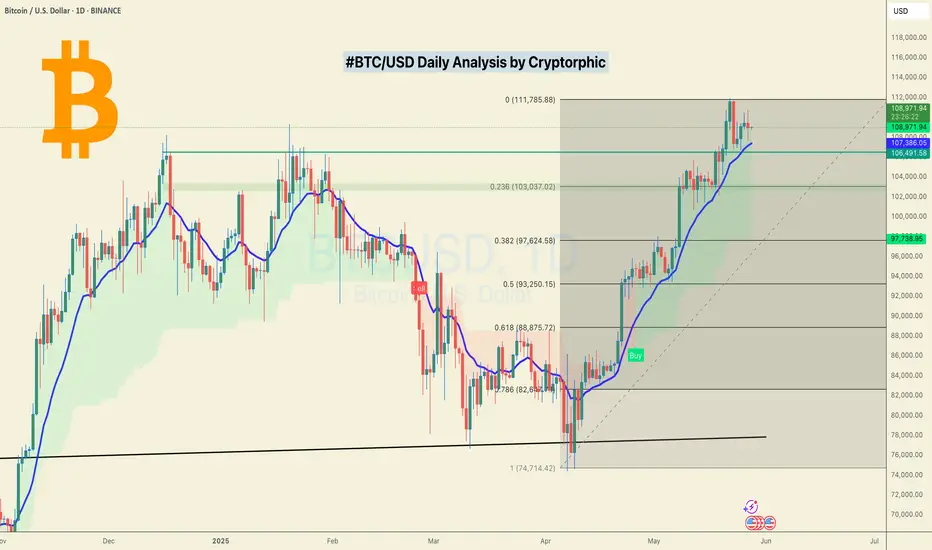
First thing to note is that PA is once again in TOP of range box and ALSO got rejected off the Long Term Blue line that has rejected BTC PA ATH since 2017. This also coincidened with the 1.618 Fib Extension.
Rejection here was highly likely and given how PA had pushed up, it is not surprising to see PA at least taking a breath.
For me, even though we do have the ability to push higher, I am not to sure we will just yet.
The weekly MACD could offer some credence to this idea
The Arrow points to an area that could turn out to be similar to what we are doing now.
The MACD has begun curling over after a prolonged push higher. While There was strength left, PA took a breath and regrouped.
The Chart below shows this period and how BTC PA reacted...and is circled
This was in Dec 2023 to Jan 2024.
PA had just had a sustained push higher and needed a break.and following a 7 week range, PA moved up another 67%
7 weeks from now brings us to near August.
There are charts that point towards a move in August / September
Here is another chart that offers some confluence to this idea.
The Dotted line is a line of support that PA has used as support numerous times this cycle and currently, is almost bang on the 50 SMA. Assuming that PA goes back down to that and bounces again, a 67% rise takes us back up to the Top of Range
Should we drop that far, to the 50 SMA again, we are in the 92K - 95K zone, scaring a LOT of people, wrecking Leverged players and putting Fear everywhere.
PERFECT FOR BUYING
This area also happens to be the 1.382 Fib extension on the main chart, the next Major line of support below us currently.
Should we fall through that, we reach the Bottom of Range and the intersection with the 50 SMA in.......August
So, we have to wait and see. We can push higher now but to do so would require breaking through that long term Blue line of resistance. I am not sure we can do that just yet.
Also, Should we post a RED June candle, Even a small one, the ideas in the Monthly candle post I recently posted also back up the idea of a lazy summer...... and a move higher around Mid to late August
Stay safe
Bitcoinprediction

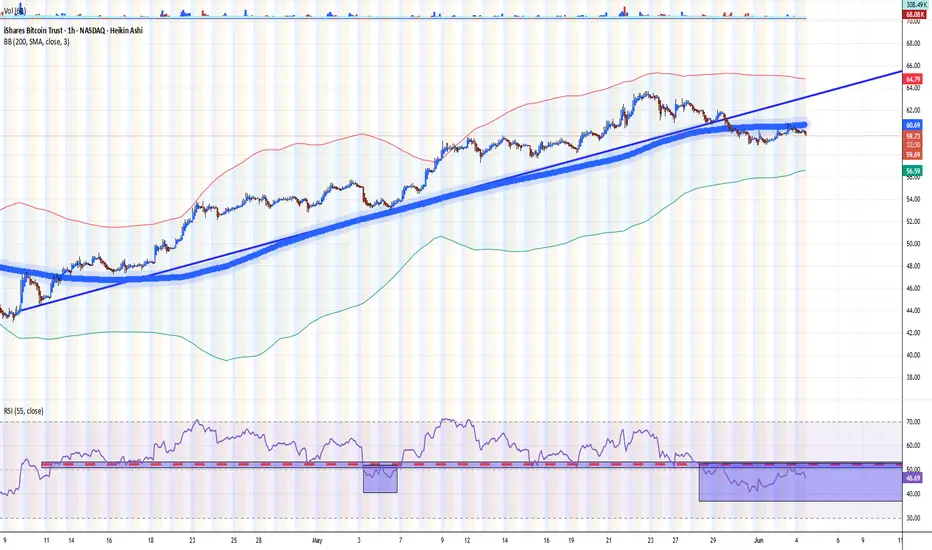
IBIT — Ishares Bitcoin Trust. Under Bearish PressureThe iShares Bitcoin Trust ETF (IBIT) has been a mixed performer year to date, with its price up and down around 20 percent this year and currently tracking for low double-digit returns in 2025.
The ETF currently trades around $59.36–$60.40, with assets under management of around $68 billion and a 0.1 percent premium to net asset value (NAV).
1-Hour Technical Outlook
On the 1-hour time frame, technical indicators are mixed but generally bearish:
Moving Averages: Short-term moving averages (e.g. 200-hour SMA/EMA) are currently signaling a Sell signal as the price moved below these averages in late May.
Support and resistance: The ETF faces resistance around $61, corresponding to the broken 200-hour SMA, and support around $54, with stronger volume-based support around $47, corresponding to the beginning of the April rally.
RSI indicator: Over the last 20 days, the RSI(55) indicator has already been briefly noted below the baseline of 50, highlighting the need for more active risk management, since, as we can see from the chart, the indicator has again moved into the risk zone in late May and early June (where it currently remains), accordingly, for a longer term.
Volatility: During the recovery period in April-May 2025, the ETF demonstrated moderate intraday volatility (with half the 200-hour sigma value (σ) of about 3.5 percent), while the 20-hour decline on May 22-23, which exceeded this value, has provided at that time clear arguments for more active risk management.
To summarize, we can say that NASDAQ:IBIT is experiencing a pullback, technical indicators point to local persistence of bearish sentiment, following the classic, empirically proven adage of the financial market "Sell in May - and Go away."
--
Best wishes,
@PandorraResearch Team
BTC Bitcoin Warning: No Clear Setup — Don’t Get Trapped!🚨 BTC Market Outlook: Analysis & Key Warning for Traders 🧠💡
Currently keeping a close eye on Bitcoin (BTC) 🔍. Previously, we saw strong bullish momentum propelling price upward 📈. However, that momentum is now under pressure — especially when you zoom into the 4-hour timeframe. We've seen a clear break in market structure, with lower highs and lower lows forming 🔻.
Right now, there’s no clean trade setup on the table. Price has pulled back, and we’re at a key inflection point — either we see a bullish breakout, or further downside could unfold 📉.
This video is more of a technical warning ⚠️ for traders feeling the urge to jump in early. The current structure is risky, and taking impulsive trades here could do more harm than good.
In the video, I also cover how to identify the highest-probability setups — particularly when price consolidates in a range and then breaks out in the direction of the prevailing trend. These continuation setups offer far better odds than guessing mid-range.
📌 Be patient. Let the setup come to you. Don’t force trades when conditions are unclear.
💬 If you’ve watched the analysis or have thoughts on BTC’s next move, comment below — I’d love to hear your view.
❗️Disclaimer: This is not financial advice. Everything shared is for educational purposes only. Always do your own analysis and trade responsibly. Risk management is key.

BTC: Still in the Grip of Wave BBitcoin is holding steady near the same levels seen at the time of yesterday’s update — and so is the structure. According to our primary scenario, we expect the current corrective wave B to complete soon within the blue Target Zone between $117,553 and $130,891. Once that happens, a wave C selloff should follow, likely targeting the lower blue Target Zone between $62,395 and $51,323. That said, our alternative scenario (30% probability) remains intact. In that case, the high of blue wave (i) has yet to form — a breakout above $130,891 would confirm that view and open the door to further upside before a correction resumes.
📈 Over 190 precise analyses, clear entry points, and defined Target Zones - that's what we do.

BTC/USDT Analysis: Development of a New Range
Hello everyone! This is the daily analysis from a trader-analyst at CryptoRobotics.
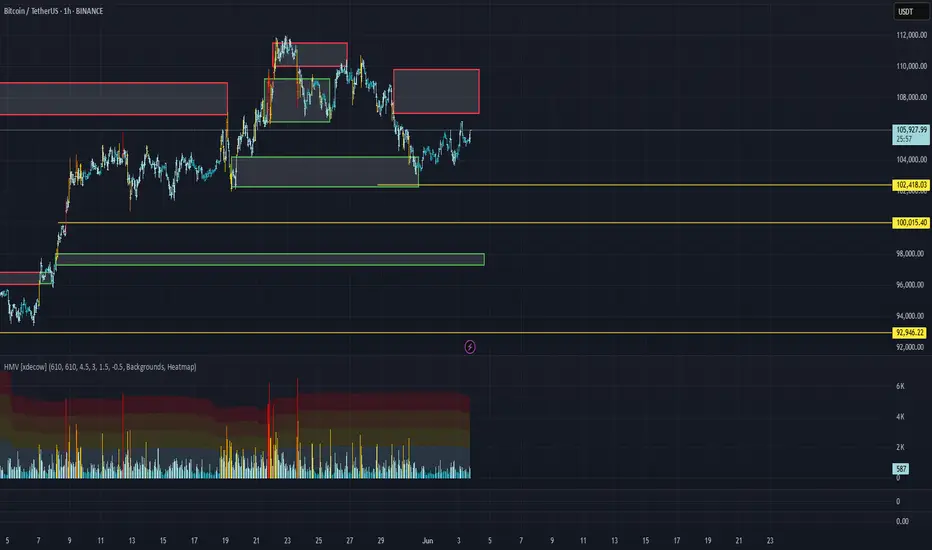
Yesterday, the scenario for the leading cryptocurrency remained almost unchanged. No buyer anomalies were observed within the $104,200–$102,300 area (accumulated volumes). Volume remains low.
The primary scenario is the development of a sideways range between two volume zones: $104,200–$102,300 (accumulated volumes) and $107,000–$109,800 (accumulated volumes). If the recently formed low is retested and buyers fail to defend it, we expect a moderate short toward the next selling zone at $100,000.
Selling zone:
$107,000–$109,800 (accumulated volumes)
Buying zones:
~$100,000 (initiating volumes),
$98,000–$97,200 (local support),
$93,000 level,
$91,500–$90,000 (strong buying imbalance)
This publication is not financial advice.
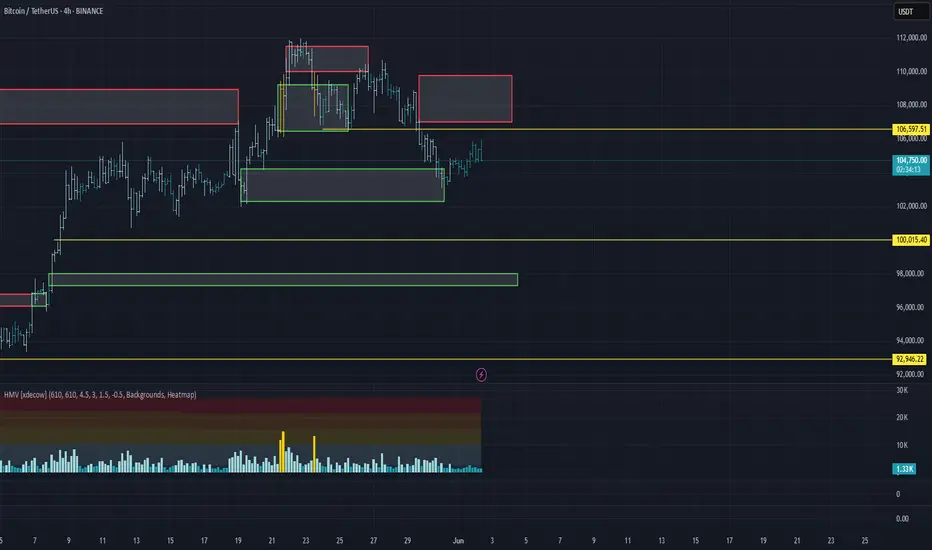
Market Overview
WHAT HAPPENED?
Despite the prevailing bullish trend, bitcoin failed to gain a foothold at the lower end of the sideways range. Instead, there was a breakdown downwards, which led to a shift of the accumulated volume in the short direction.
After that, the support zone of $104,200 – $102,300 (accumulated volumes) was tested, which was followed by the first positive reaction from buyers.
WHAT WILL HAPPEN: OR NOT?
It’s too early to talk about a full-fledged reversal and a resumption of the bullish trend. The resumption looks weak, both in terms of volume and momentum.
In the near future, we should expect a repeat test of the formed minimum. In the absence of a buyer's reaction, a rollback to the next area of interest is possible. An alternative scenario is the formation of a new sidewall between key levels:
– $104,200 – $102,300 (current accumulation zone),
– $107,000 – $109,800 (potential upper limit).
Sell zone:
$107,000–$109,800 (accumulated volume)
Buy zones:
$104,200–$102,300 (accumulated volume)
~$100,000 (initiating volume)
$98,000–$97,200 (local support)
Level at $93,000
$91,500–$90,000 (strong buying imbalance)
IMPORTANT DATES
The following macroeconomic events are expected this week:
• Monday, June 2, 13:45 (UTC) — the publication of the index of business activity in the US manufacturing sector for May;
• Monday, June 2, 14:00 (UTC) — publication of the ISM index of business activity in the US manufacturing sector for May;
• Monday, June 2, 17:00 (UTC) — speech by Fed Chairman Jerome Powell;
• Tuesday, June 3, 09:00 (UTC) — publication of the consumer price index for May and in comparison with May 2024 in the Eurozone;
• Tuesday, June 3, 14:00 (UTC) — publication of the number of open vacancies in the labor market (JOLTS) USA for April;
• Wednesday, June 4, 12:15 (UTC) — publication of changes in the number of people employed in the US non—agricultural sector for May from ADP;
• Wednesday, June 4, 13:45 (UTC) - publication of the index of business activity in the service sector (PMI) USA for May, as well as Canada's interest rate decisions;
• Wednesday, June 4, 14:00 (UTC) — publication of the US non—manufacturing purchasing managers' index for May from ISM;
• Thursday, June 5, 12:15 (UTC) - publication of the deposit rate, as well as interest rate decisions in the Eurozone;
• Thursday, June 5, 12:30 (UTC) — publication of the number of initial applications for unemployment benefits in the United States;
• Thursday, June 5, 12:45 (UTC) — press conference of the European Central Bank;
• Friday, June 6, 12:30 (UTC) — publication of the average hourly wage, changes in the number of people employed in the non-agricultural sector and the unemployment rate in the United States in May.
*This post is not a financial recommendation. Make decisions based on your own experience.
#analytics
BTC/USD next wave started. So this is my planBitcoin started the rally, and I'm expecting a bullish rally till 106700 range. Expecting a pull back. And re-entering again at the tip. Holding it till 107500

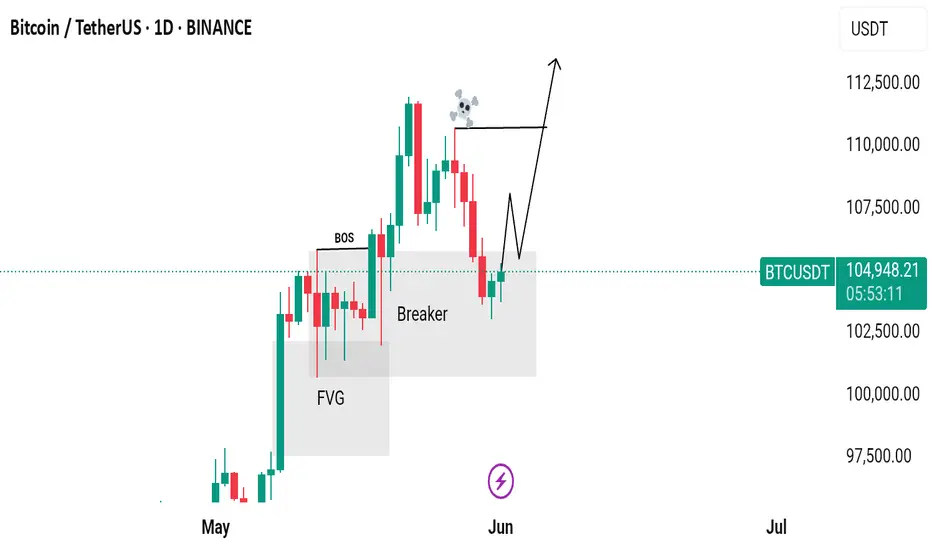
Can Potentially move upwards from here?Bitcoin just created an inducement and it has been hunted. Now the structure is also broken and the inducement is also taken out. The market is in a discount zone, and there's an overlap of a Breaker Block and FVG (Fair Value Gap), which indicates that the market can potentially move upwards from here.
Wait for bullish confirmations here, such as MSS (Market Structure Shift), CISD (Change in Character/Continuation of Internal Structure Dynamics), and failed selling PD Arrays!
Do Your Own Research (DYOR)! This is not financial advice.
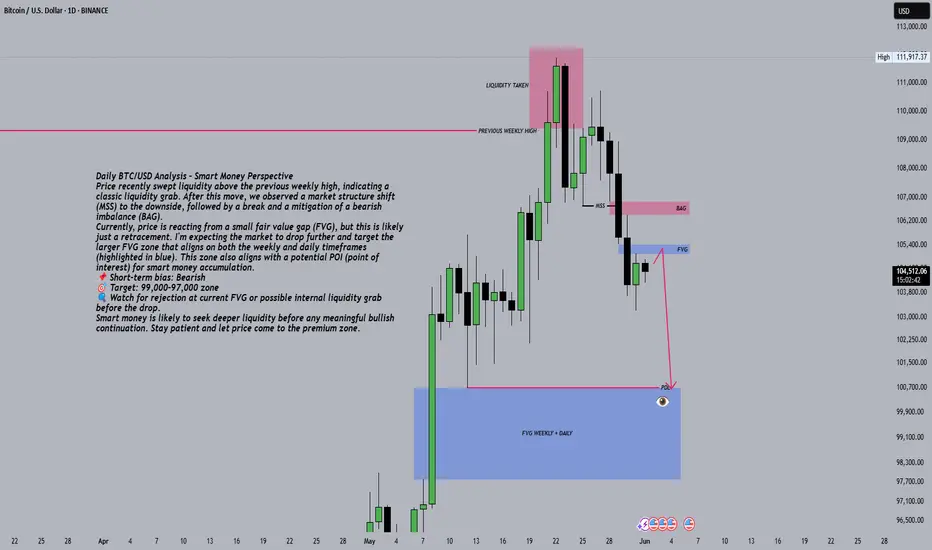
Daily BTC/USD Analysis - Smart Money PerspectivePrice recently swept liquidity above the previous weekly high, indicating a classic liquidity grab. After this move, we observed a market structure shift (MSS) to the downside, followed by a break and a mitigation of a bearish imbalance (BAG).
Currently, price is reacting from a small fair value gap (FVG), but this is likely just a retracement. I'm expecting the market to drop further and target the larger FVG zone that aligns on both the weekly and daily timeframes (highlighted in blue). This zone also aligns with a potential POI (point of interest) for smart money accumulation.
📌 Short-term bias: Bearish
🎯 Target: 99,000–97,000 zone
🔍 Watch for rejection at current FVG or possible internal liquidity grab before the drop.
Smart money is likely to seek deeper liquidity before any meaningful bullish continuation. Stay patient and let price come to the premium zone.
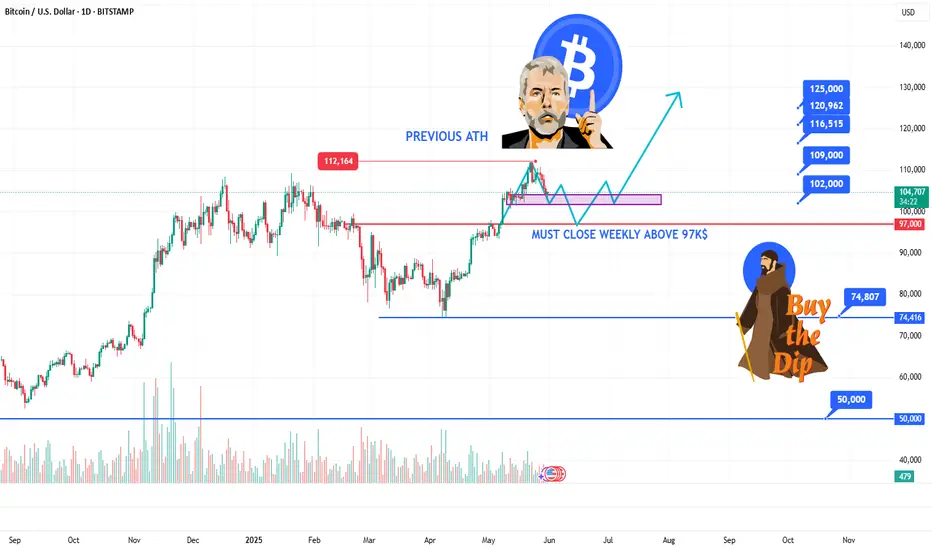
BITCOIN STILL BULLISH ABOVE 97K$HELLO TRADERS
As i can see Bitcion is just created a new ATH 112K$ and now is retracing to downside after a overbought condtions on RSI i am expected a new ATH till design levels if BTC Hold above 97K zone its just a trade idea share your thoughts with us in comments it help many other traders we love ur comments and support Stay Tuned for more updates
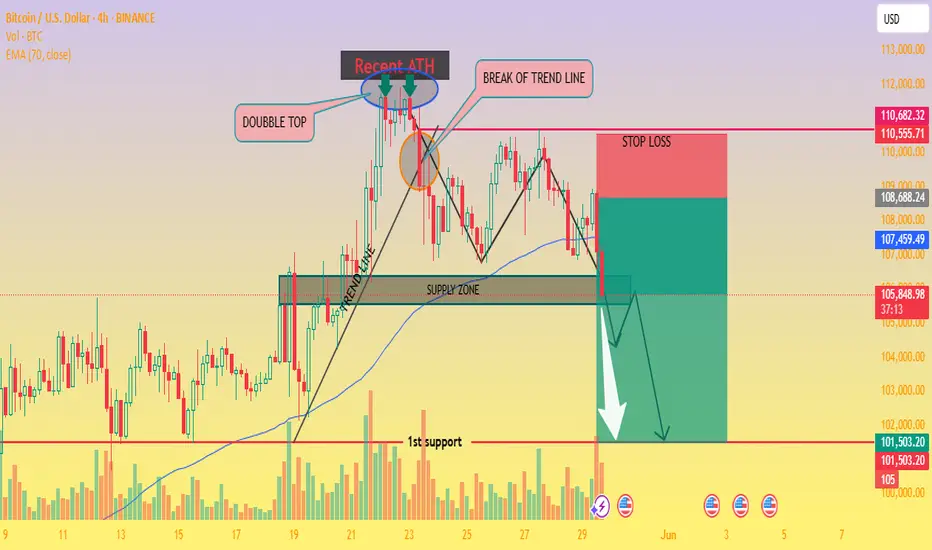
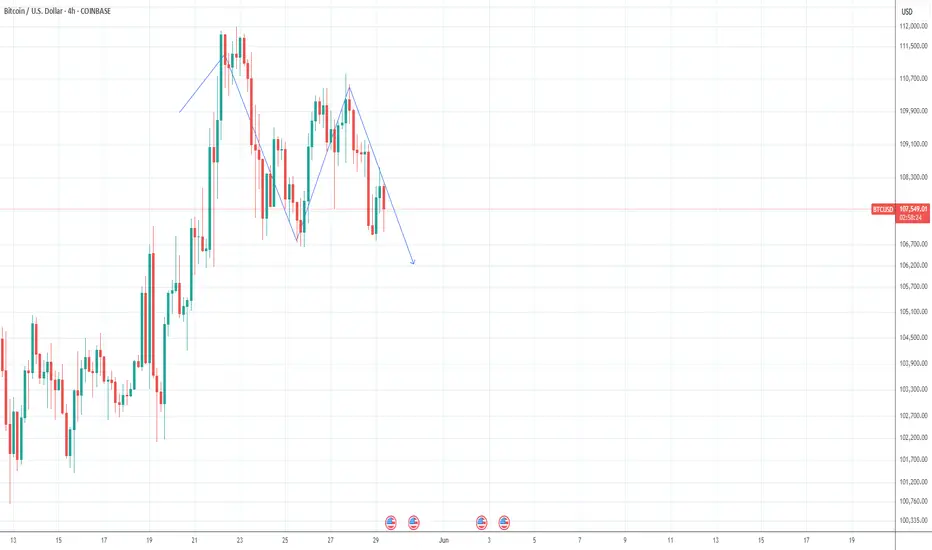
BTC/USD – Double Top Breakdown Signals Bearish Wave- 4H chart. 🧨
🔍 Chart Analysis:
🟢 Recent Price Action:
Bitcoin formed a double top pattern near the Recent All-Time High (ATH) 📈 — a strong bearish signal 🔔.
A trendline break occurred right after the second peak, confirming potential weakness ⚠️.
🟠 Supply Zone:
Price re-entered a previous supply zone (resistance area) and failed to hold above it 🧱 — indicating sellers are active again.
🔵 EMA 70 (Blue Line):
The price has dropped below the 70 EMA, signaling momentum shift from bullish to bearish 📉.
🔴 STOP LOSS ZONE:
Positioned above 110,555 🚫 — risk level for this short setup if bulls reclaim control.
🟡 Bearish Pathway (Expected Move):
Price may retest the broken zone 🔁.
Followed by a sharp drop to the 1st support near $101,503 🎯.
Confirmed by large bearish volume spikes 📊.
💥 Trade Idea:
Entry: Near 106,000 (on retest of supply zone).
Stop Loss: Above 110,555 🔺.
Target: $101,500 🎯.
Risk/Reward Ratio: 🔥 Favorable setup for swing short sellers!
📛 Pattern Breakdown:
⚠️ Double Top = Reversal Signal.
🔻 Trendline Break = Shift in Market Structure.
🧊 Supply Zone Rejection = Bearish Confirmation.
Technical Note on BTC/USDBearish bias in the short term unless the price breaks and holds above the resistance.
• Monitor volume and structure on the breakdown to confirm momentum.
• Key levels to watch: Resistance ~109,000, Support ~104,000–104,500.
BINANCE:BTCUSDT
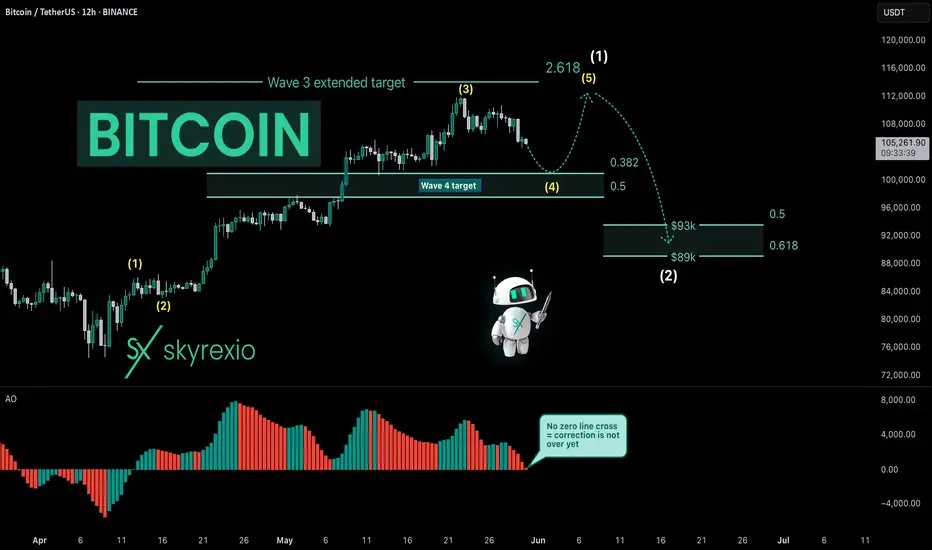
Bitcoin Is Entering Into Very Difficult TimesHello, Skyrexians!
I have been thinking what will happen next with BINANCE:BTCUSDT and it was obvious that correction has been started, you can easily find my recent update on Bitcoin and check it, but what will happen after. Today I decided that the first impulse has not been finessed yet and we need one more small leg up to complete this growth before significant correction.
Let's take a look at the yellow Elliott waves cycle. Awesome Oscillator gave me an idea that only wave 3 has been finished above $110k. Now price is printing wave 4. Wave 4 has a target between 0.38 and 0.5 Fibonacci, but this time it will be definitely 0.38 at $101k. Here was the smaller degree wave's 4 bottom. Wave 5 will be shortened because wave 3 was extended, it's very logically. After $111k retest the major wave 2 will go to $90k approximately. Difficult times ahead for crypto, I think this period will be finished only at the end of June.
Best regards,
Ivan Skyrexio
___________________________________________________________
Please, boost this article and subscribe our page if you like analysis!
Bitcoin's Breakout Fizzles: Is a Major Reversal in Play...?Bitcoin Technical Analysis – In-Depth Breakdown
Over the past two months, Bitcoin has exhibited a strong bullish trend, appreciating by approximately 51%. The sustained rally was primarily driven by bullish momentum, increased investor confidence, and broader market sentiment.
Recently, Bitcoin broke through its all-time high (ATH) of 106,500, surging to a new peak near 112,000. However, this breakout was short-lived as the price failed to sustain above this level, indicating significant profit-taking activity by traders and long-term holders. This inability to hold the ATH region highlights a potential liquidity pocket where sell orders accumulate, resulting in a rejection wick and a subsequent reversal.
From a Technical perspective:
The price has now fallen back below 106,500, turning this key level into a major resistance zone. Historically, once a strong resistance level (like an ATH) is breached and subsequently reclaimed, it often acts as a formidable barrier to upward price movement unless there’s renewed bullish momentum.
Additionally, Bitcoin has broken its ascending trendline (drawn from the lows of the uptrend) and has already retested this trendline from below. The retest was successful in confirming the breakdown, which further strengthens the bearish bias.
The price structure is now forming a potential lower high pattern near the 106,500 resistance. This could signal a shift in market sentiment from bullish continuation to consolidation or correction.
In terms of market psychology, the all-time high region represents a crucial psychological barrier. Traders and investors often exhibit heightened caution near such levels. Many choose to lock in profits due to fear of a double top or a false breakout. This behavior can create increased volatility, especially when combined with institutional and retail order flows.
Trading Strategy and Risk Management
Given the technical breakdown and the psychological factors at play:
✅ A short position can be considered, particularly around the 106,500 resistance, with confirmation from the trendline retest.
✅ However, exercise caution due to the high volatility typically observed near ATH levels. Whipsaws and fakeouts are common as both bulls and bears battle for control.
✅ Avoid high-leverage positions unless you have a strict stop-loss in place. Ideally, place the stop-loss just above the 106,500 - 107,000 zone, where a decisive breakout would invalidate the short setup.
✅ For profit targets, initial supports are seen around 100,000 - 98,000, and a deeper correction could test the 94,000 - 92,000 zone.
✅ Wait for clear confirmation, such as a strong bearish candle on the retest of the resistance, before entering the trade.

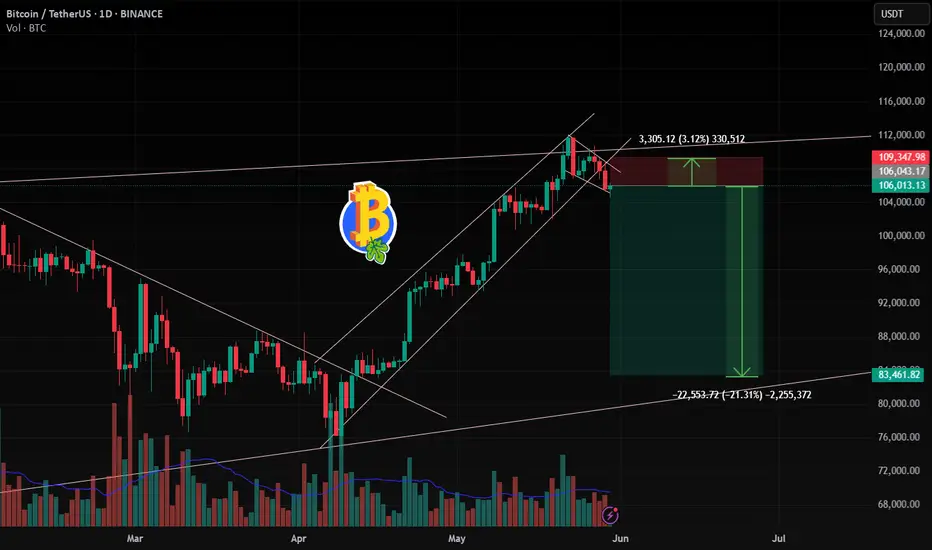
BTC , 1D BTC has Break Down in 4Hr and Retest the lower Trendline in 1Hr , SO we think that it will Fall in Future , If BTC is Sustaining below its 1,05,600 then we confirm that it will be Fall Drastically
if BTC is falling then remaining coins , which are giving Breakdown of Patterns they will give Very Good Profit
Risk - 3% and Aim for 20 % .
Follow for More Swing Idea Like this
BTC/USDT Analysis: Expecting a Move Toward the Upper Boundary
Hello everyone! This is your trader-analyst from CryptoRobotics with the daily market update.
Yesterday, Bitcoin tested the $107,500 level, resulting in a false breakout before returning to the consolidation range. Each attempt to push the price lower was met with a sharp increase in trading volume, followed by buyers quickly taking control—a trend also visible in the absorption of sell orders via delta.
The current scenario remains unchanged. We anticipate a resumption of buying activity after a retest of the $106,600 level.
Buy Zones:
$106,600 (on a false breakout),
$103,200–$102,000 (absorption of market sell orders),
~$100,000 (pushing volumes),
$98,000–$97,200 (local support),
$93,000,
$91,500–$90,000 (strong buy-side imbalance).
This post is not financial advice.

my prediction is on bitcoin downward correction is onprevious post i told you guys bitcon need a downward correction. now see the results already its' going down.
BTC/USDT Analysis – Moving Within the Scenario
Hello everyone! This is the daily market update from the CryptoRobotics trader-analyst.
At the moment, Bitcoin is attempting to break through the ascending trendline, which may indicate a shift into a sideways (consolidation) phase.
In the near term, local lows are likely to be tested, followed by a rebound after a false breakout, returning price back into the current range.
This scenario is supported by:
strong sell absorption on the cumulative delta,
the overall bullish market context,
and continued accumulation of long positions by whales in the spot ETF over the past 9 days.
Buy Zones:
$107,500 and $106,600 (in case of false breakdowns),
$103,200–$102,000 (market sell absorption),
around $100,000 (initiative volume),
$98,000–$97,200 (local support),
$93,000,
$91,500–$90,000 (strong buy-side imbalance).
This publication is not financial advice.

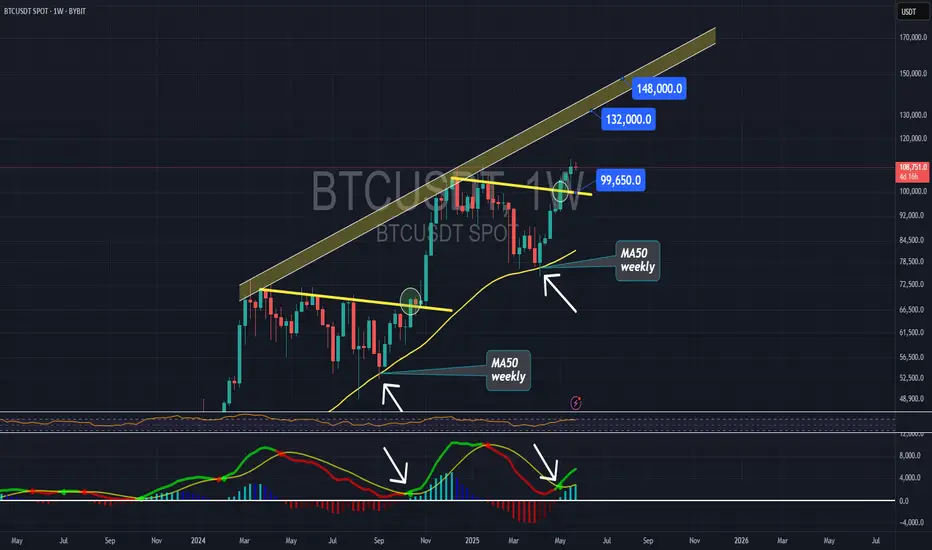
Bitcoin 150k is very likely On weekly timeframe bitcoin broke the yellow resistance few weeks ago, now the support on weekly is about 99.6k and resistance about 148k
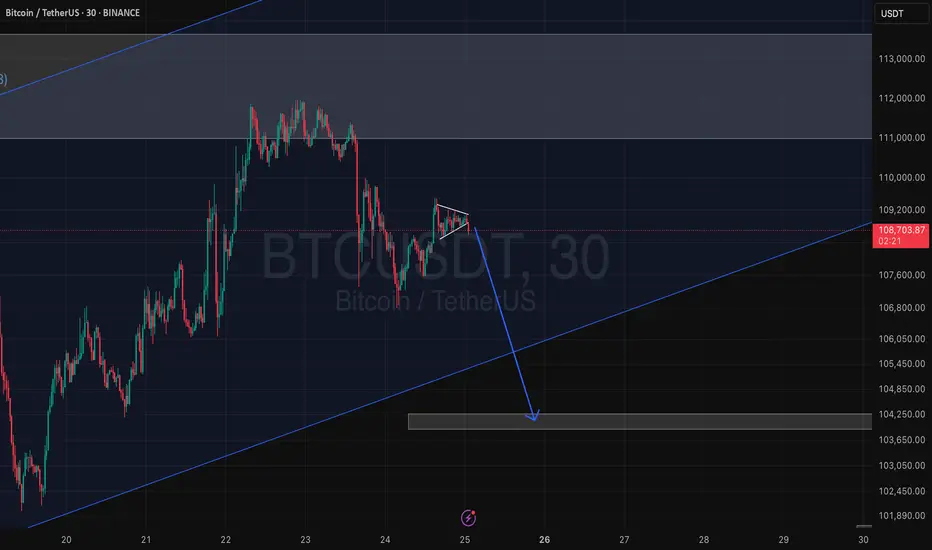
BTC/USDT Technical Analysis and Trade Idea📉 BTC Pullback or Full Reversal? Let's Break It Down 🔍
Looking at the Bitcoin chart right now, we’re seeing more than just a minor pullback. On the 30-minute timeframe, there’s a clear bearish market structure shift setting in. In my opinion, this isn't a quick dip before continuation — we may be in for a deeper retracement. 🧐
When we overlay NASDAQ (which Bitcoin is often closely correlated with), it becomes even clearer — tech stocks look overextended and are showing signs of a potential pullback. 📉
So here’s the plan:
If BTC pulls back into my point of interest, I’ll be watching for a bullish break of structure to consider a long position. Simple, structured, and in line with what the charts are telling us. 🔁💹
⚠️ As always, this is not financial advice — just sharing how I'm reading the market right now.
💬 What are your thoughts? Are you watching the same levels? Drop a comment below 👇 and let’s talk trade setups! 🚀

Bitcoin & Stock Market Rally Together .. My Trade Plan!🚨 Bitcoin Update! 🚨
Taking a look at the BTC chart 🧠📈 — we saw a sharp retracement followed by a strong rally 💥🔥, likely driven by recent tariff policy shifts 🌍📊.
Right now, I’m leaning bullish 🐂 — especially with the stock markets also pushing higher 📈💹. But let’s be clear: my bullish bias depends on the stock market holding strong 🛡️📊.
I’m keeping an eye out for a pullback to the 61.8% Fibonacci level 🌀 for a potential buy opportunity 💸🚀.
⚠️ This is not financial advice — just sharing my outlook!
👇 Let me know what you think in the comments!

#BTC/USD The Uptrend is still intact! Here's Why!BTC Daily Close Update
Bitcoin closed at $108,951, marking another failed attempt to break through the $111K resistance.
It’s been nearly 8 days of consolidation just below this level. That’s not ideal, and it signals we may need a fresh catalyst to push higher.
Not bearish, just cautious.
As long as the blue EMA holds on the daily, the uptrend remains intact.
Still watching for a move toward $117K.
DYOR, NFA
Please show your support with your likes.
Thank you
#PEACE
BTC/USDT Analysis – Still Long
Hello everyone! This is the daily analysis from a trader-analyst at CryptoRobotics.
Yesterday, Bitcoin bounced off the volume zone at $109,200–$106,500, but then faced resistance in the $110,100–$111,500 area — a zone we previously overlooked due to the strong bullish context.
Currently, the positive trend remains intact, and we are still expecting a new local high. However, before that happens, a decline and a retest of the local low at $106,600 is likely. Supporting the continuation of the overall uptrend are the following factors: absorption on the cumulative delta, an unbroken ascending trendline, and volume distribution.
Buy zones:
$109,200–$106,500 (volume zone)
$103,200–$102,000 (absorption of market sells)
Around $100,000 (aggressive buying volumes)
$98,000–$97,200 (local support)
$93,000 level
$91,500–$90,000 (strong buy-side imbalance)
This publication is not financial advice.
