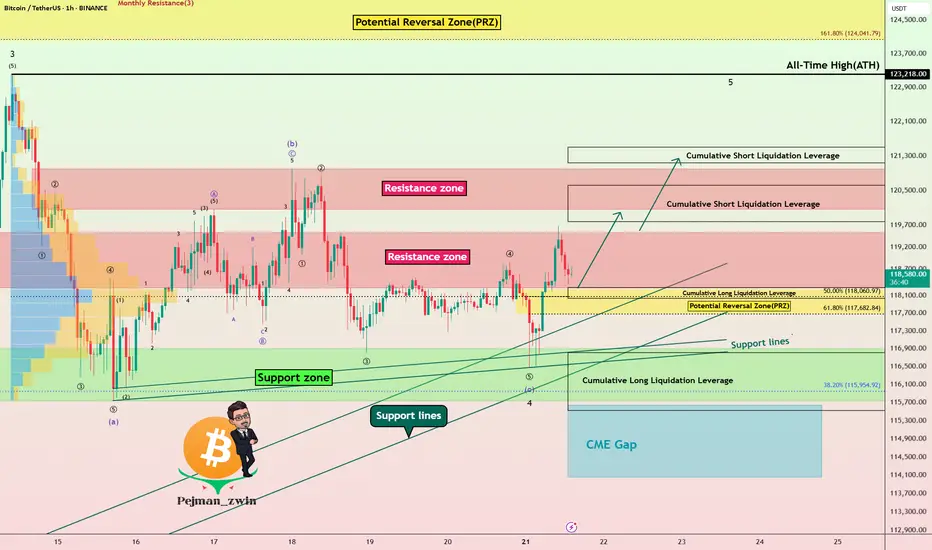
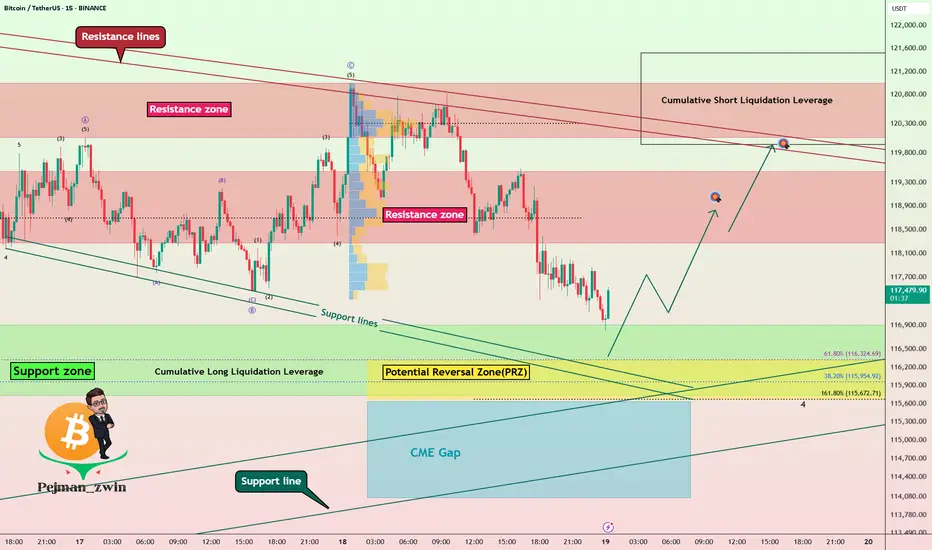
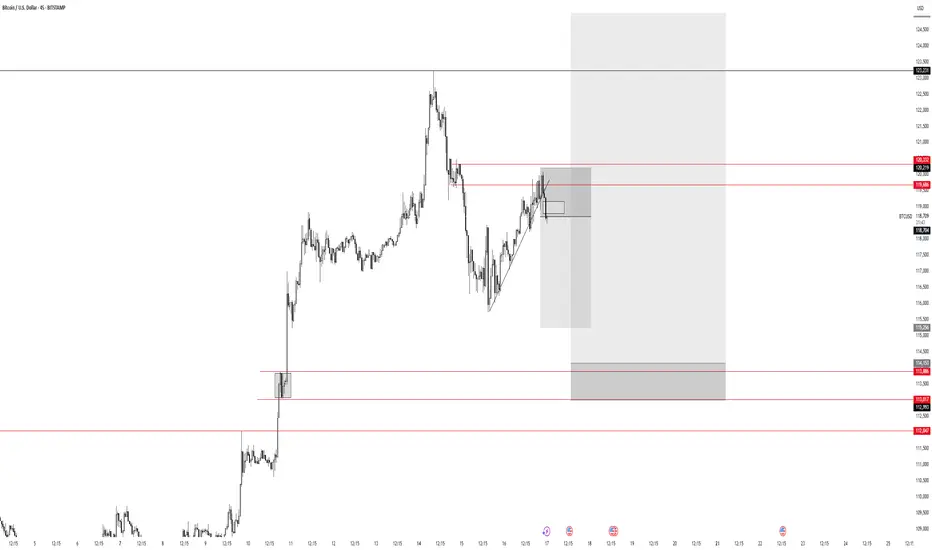
Bitcoin Technical Setup: Support Holds, Wave 5 in FocusBitcoin ( BINANCE:BTCUSDT ) filled the CME Gap($117,255-$116,675) and started to rise, as I expected in my previous idea .
Bitcoin is currently trying to break the Resistance zone($119,530-$118,270) . In the last week's movement, the price of $118,000 can be considered as one of the most important numbers for Bitcoin , with a lot of trading volume around this price.
In terms of Elliott Wave theory , it seems that Bitcoin has managed to complete the main wave 4 near the Support zone($116,900-$115,730) and Support lines . The structure of the main wave 4 is a Zigzag Correction(ABC/5-3-5) (so far). There is a possibility that the 5th wave will be a truncated wave because the momentum of the main wave 3 is high and Bitcoin may NOT create a new ATH and the main wave 5 will complete below the main wave 3.
I expect Bitcoin to start rising near the Potential Reversal Zone(PRZ) and Cumulative Long Liquidation Leverage($118,277-$118,033) , break the Resistance zone($119,530-$118,270) and reach the targets I have marked on the chart.
Note: Stop Loss(SL)= $116,960
CME Gap: $115,060-$114,947
Cumulative Short Liquidation Leverage: $121,502-$121,134
Cumulative Short Liquidation Leverage: $120,612-$119,783
Cumulative Long Liquidation Leverage: $116,810-$115,522
Do you think Bitcoin can create a new ATH again?
Please respect each other's ideas and express them politely if you agree or disagree.
Bitcoin Analyze (BTCUSDT), 1-hour time frame.
Be sure to follow the updated ideas.
Do not forget to put a Stop loss for your positions (For every position you want to open).
Please follow your strategy and updates; this is just my Idea, and I will gladly see your ideas in this post.
Please do not forget the ✅' like '✅ button 🙏😊 & Share it with your friends; thanks, and Trade safe.
Bitcoinprediction
BITCOIN FINAL WARNING BEFORE HUGE MOVE!!! (urgent) Yello Paradisers! I am Sharing with you my idea about #Bitcoin of what's going on with Bitcoin right now: be very careful because the Fear and Greed Index, a special one, is at "Greed". We are seeing funding rates, the accumulated funding rates, as extremely positive. We are seeing bearish patterns forming.
In this video, I'm describing the confirmations we are waiting for that will confirm that Bitcoin is about to make a huge movement. Make sure that you are trading with professional trading strategies and that you are waiting for confirmations before any trade execution. Also, make sure that you have tight risk management because only the best, most professional traders will win long-term in this game.
Don't be a gambler. Don't try to get rich quick. Make sure that your trading is professionally based on proper strategies and trade tactics.

ETH: Huge Reversal or Correction Still in the Horizon?The recent price action in Ethereum (ETH) has left market participants questioning its next major move. With volatility high and sentiment shifting, is ETH headed for a massive reversal, or is a correction still looming on the horizon?
Key Points to Consider
Macro Environment: Global markets are facing uncertainty from shifting interest rates and regulatory developments in crypto. These factors may spark continued volatility for ETH in the near term.
Technical Analysis: ETH has many analysts watching key support and resistance areas. A clean break above resistance could signal a reversal, while a failure to hold recent gains may suggest a correction is not over yet.
On-Chain Data: Activity on the Ethereum network, including DeFi usage and staking patterns, can offer clues as to whether accumulation or distribution is taking place.
Market Sentiment: Traders remain divided, with some calling the recent bounce a bull trap, and others anticipating renewed upside momentum.
My Take
While the case for a reversal is gaining strength, the possibility of a broader correction can’t be dismissed. It’s crucial for investors to stay alert, watch the charts, and position size accordingly. I'm not longing any crypto in the short run...As for the long run, extremely BULLISH!
*not investment advice*
#Ethereum #Crypto #Investing #MarketAnalysis #Web3 #crypto #bitcoin #trading

Urgent Bitcoin Prediction: Longs Beware!!! Bitcoin longs should be careful, as we are below an important resistance and the market looks bearish. Wait for the confirmations I’ve shown in the video before making any moves! Trade professionally with a proper strategy and well-defined entry tactics!

Bitcoin Trading Update: Consolidation, Patterns, and What's NextHey Fellow Traders! 👋
Bitcoin (BTC) has been on a wild ride after hitting its all-time high (ATH)! 📈 Since then, it’s been consolidating, generating liquidity, and setting the stage for the next big move. Meanwhile, altcoins are absolutely booming, stealing the spotlight! 💥 As we kick off the week, let’s dive into what’s happening with BTC and what to watch for.
📊 Technical Analysis Breakdown
Here’s what I’m seeing on the charts:
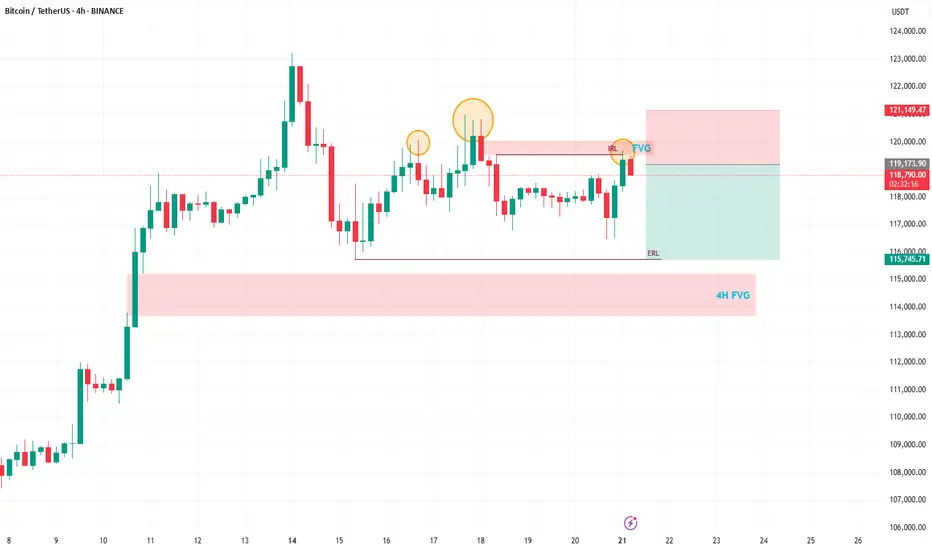
Head and Shoulders Pattern: A clear head and shoulders has formed on BTC, signaling a potential bearish move. 🐻
Daily Timeframe Order Blocks: These are in play, showing key levels of support and resistance.
Filled Fair Value Gap (FVG): A recent FVG on the daily chart has been filled, but there’s still a beautiful 4H FVG waiting to be tested below.
Liquidity Sweep: After the ATH, BTC needs to clear the liquidity from the past few days before it can push for new highs.
🔍 What’s Next for BTC?
I’m expecting a bearish reaction in the near term, with BTC targeting the sell-side liquidity around $115,800. This move should also fill the 4H FVG, setting the stage for a potential bounce and another shot at the ATH. 🚪 Keep an eye on these levels, as they’ll be critical for the next big move!
🔔 Stay in the Loop!
Let’s keep the conversation going! 💬 Follow for more updates, like if you found this helpful, and drop a comment with your thoughts or what you’re seeing in the markets. Are you trading BTC or riding the altcoin wave? Let’s hear it! 👇
Happy trading, and let’s make this week count! 💪
#Crypto #Bitcoin #Trading #TechnicalAnalysis
Market overview
WHAT HAPPENED?
Last week, after updating the historical maximum, bitcoin went into correction for the first time, after which it went sideways.
At the moment, the $117,300 – $116,300 zone has been retested (strong absorption of sales) and an active reaction from buyers has been received.
Within the current flat, the cumulative delta supports buyers, indicating the absorption of market sales. At the same time, the global wave structure on the 4H chart casts doubt on the last wave of buys, as we’ve rapidly adjusted back to its beginning.
💼 WHAT WILL HAPPEN: OR NOT?
We expect to exit the sideways at $116,000 – $121,000 in an upward direction from the current levels, either through capturing liquidity and testing the pushing volume zone at $115,000.
The target is the last ATH, which is $123,200. A re-correction is possible near $123,200, resulting in a wider flat range of $123,200 to $115,000. If there is a true breakout, we can expect the continuation of the global long trend.
Buy Zones:
~$115,000 (zone of initiating/pushing volumes)
$110,000–$107,000 (accumulated volume)
📰 IMPORTANT DATES
Macroeconomic events this week:
• Tuesday, July 22, 12:30 (UTC) — speech by Fed Chairman Jerome Powell;
• Wednesday, July 23, 14:00 (UTC) — publication of data on US second-hand housing sales for June;
• Thursday, July 24, 12:15 (UTC) — announcement of the deposit rate for July and the interest rate decision in the Eurozone;
• Thursday, July 24, 12:30 (UTC) — publication of the number of initial applications for unemployment benefits in the United States;
• Thursday, July 24, 12:45 (UTC) — press conference of the European Central Bank;
• Thursday, July 24, 13:45 (UTC) — publication of business activity indices (PMI) in the manufacturing and services sectors of the United States for July;
• Thursday, July 24, 14:00 (UTC) — publication of data on new home sales in the United States for June.
*This post is not a financial recommendation. Make decisions based on your own experience.
#analytics

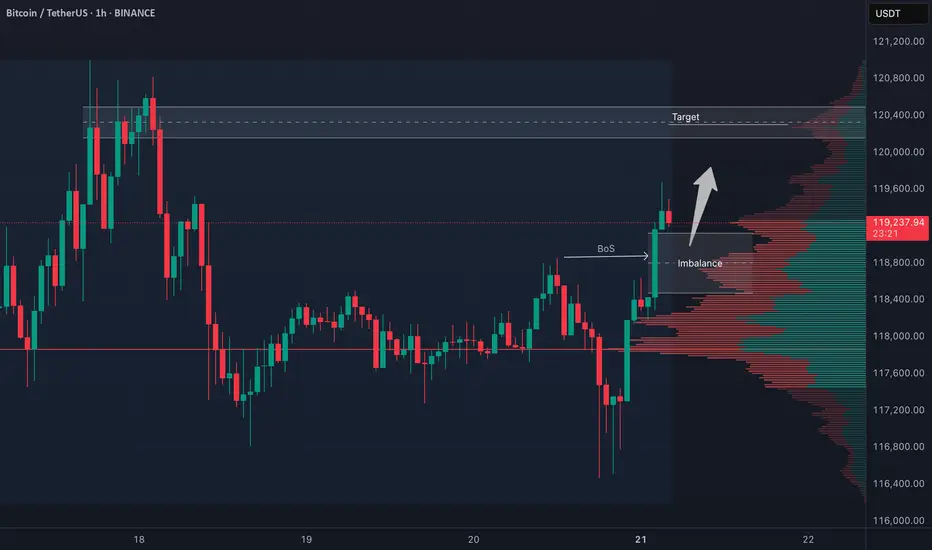
BTC 4H Structure Break – Long Bias with Conditions🚀 BTC (Bitcoin) has clearly broken bullish market structure on the 4-hour timeframe.
📈 My bias is to ride the momentum and look for a pullback to enter long.
✅ I follow a specific entry criteria — price must pull back into the imbalance, find support, and then form a bullish break of structure on a 15m chart to trigger an entry.
❌ If that setup doesn't play out, we simply abandon the idea.
⚠️ This is not financial advice.
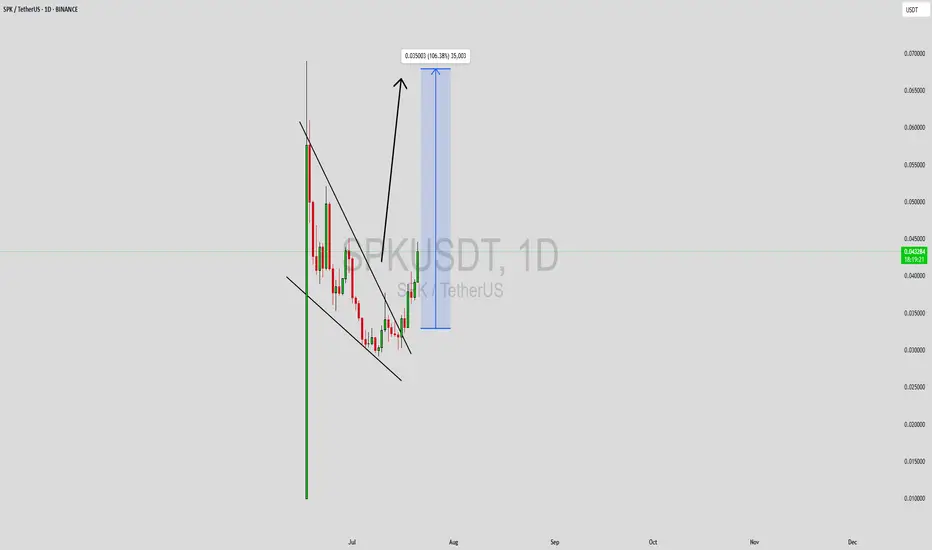
SPKUSDT Forming Falling WedgeSPKUSDT is currently forming a well-defined falling wedge pattern on the chart, a setup often associated with strong bullish reversals. This pattern suggests that the ongoing downward momentum is losing strength, and buyers may soon take control. The tightening price range within the wedge, combined with good volume activity, adds conviction to the breakout potential. Historically, such formations signal the end of a corrective phase and the beginning of an impulsive bullish wave, positioning SPK for a sharp upside move.
The technicals are aligning for a breakout with an expected gain of 90% to 100% or more. The confluence of strong support zones, oversold indicators, and increased trading volume points to growing investor confidence. Once SPK breaks above the wedge resistance with confirmation, it can trigger a significant rally, fueled by momentum traders and long-term investors entering the market. These conditions often attract attention across the crypto community, making SPK a high-potential short-term trade.
Market sentiment around SPK is also strengthening, with more traders discussing the project and its underlying fundamentals. As volume increases and the technical breakout setup matures, SPK could become one of the more explosive movers in the altcoin space. The falling wedge pattern’s reliability, combined with rising investor interest, makes this chart highly attractive for swing traders and breakout hunters alike.
✅ Show your support by hitting the like button and
✅ Leaving a comment below! (What is You opinion about this Coin)
Your feedback and engagement keep me inspired to share more insightful market analysis with you!
Bitcoin Technical Setup: Support Holds, Eyes on $118,600Bitcoin ( BINANCE:BTCUSDT ) moved as I expected in the previous ideas and finally completed the CME Gap($117,255-$116,675) in the last hours of the week. ( First Idea _ Second Idea )
Before starting today's analysis, it is important to note that trading volume is generally low on Saturday and Sunday , and we may not see a big move and Bitcoin will move in the range of $121,000 to $115,000 ( in the best case scenario and if no special news comes ).
Bitcoin is currently trading near the Support zone($116,900-$115,730) , Cumulative Long Liquidation Leverage($116,881-$115,468) , Potential Reversal Zone(PRZ) , and Support lines .
According to Elliott Wave theory , Bitcoin had a temporary pump after the " GENIUS stablecoin bill clears House and heads to Trump's desk " news, but then started to fall again, confirming the end of the Zigzag Correction(ABC/5-3-5) . Now we have to wait for the next 5 down waves or the corrective waves will be complicated .
I expect Bitcoin to rebound from the existing supports and rise to at least $118,600 . The second target could be the Resistance lines .
Do you think Bitcoin will fill the CME Gap($115,060-$114,947) in this price drop?
Cumulative Short Liquidation Leverage: $121,519-$119,941
Do you think Bitcoin can create a new ATH again?
Note: Stop Loss(SL)= $114,700
Please respect each other's ideas and express them politely if you agree or disagree.
Bitcoin Analyze (BTCUSDT), 15-minute time frame.
Be sure to follow the updated ideas.
Do not forget to put a Stop loss for your positions (For every position you want to open).
Please follow your strategy and updates; this is just my Idea, and I will gladly see your ideas in this post.
Please do not forget the ✅' like '✅ button 🙏😊 & Share it with your friends; thanks, and Trade safe.
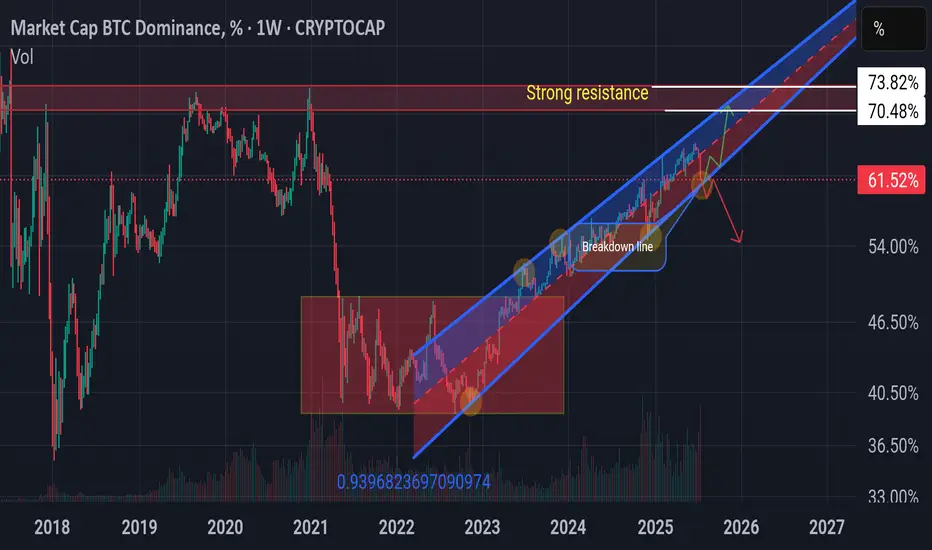
BTC Dominance Rebound???🧭 Market Outlook
BTC Dominance (BTC.D) remains in an uptrend channel → investors still favoring CRYPTOCAP:BTC over alts.
📉 From Jun 28 to Jul 18, BTC.D dropped -7%, fueling a solid rally in ETH & alts.
⚠️ BTC.D may bounce back if it fails to break the key support (breakdown line/golden circle). Next resistance zone: 70.48%–73.82%. If this plays out → alts may lag during BTC pumps & dump harder on corrections.
🌊 Altseason only if BTC.D breaks down decisively.
But not all alts will fly. Be selective — don’t go all-in on a single coin. 🧠
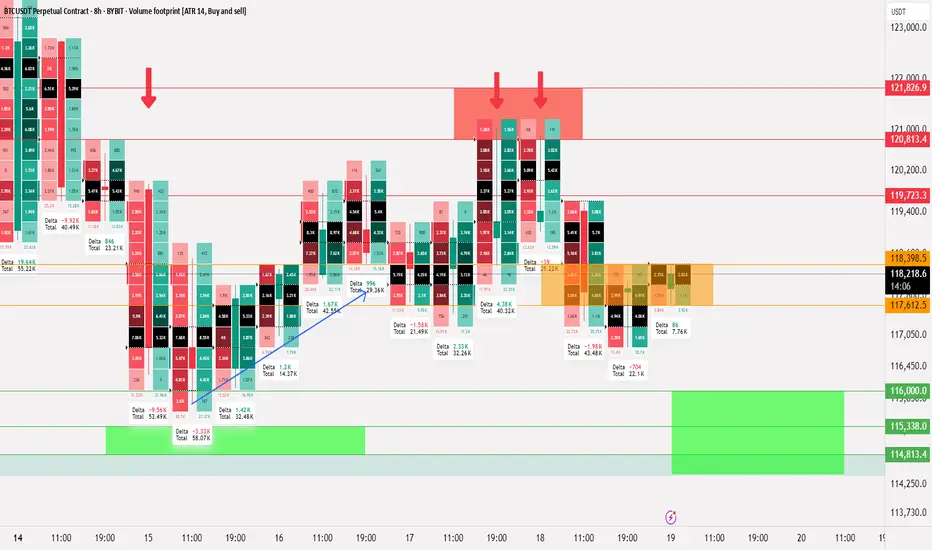
Bitcoin Liquidity updateCRYPTOCAP:BTC
📄 Update on liquidity movement and key liquidity cluster points
◀️ Summary of the first movement: A sale occurred at 121826 and a break happened at 117612, after which liquidity was collected between 116 - 115
◀️ After collecting liquidity, we mentioned that breaking 117612 would allow testing 119723, and that is what happened
⭕️ Now, a selling range has formed between 120813 - 121826, which is clear on the price chart and the way it bounced down
🟣 The current movement is confined between 118398 - 117612
📄 Regarding trading ideas:
⭕️ The thought here is to buy between 11600 - 114813 if a break occurs at 117612 and trading starts below it
⭕️ The second idea, in case this break does not happen, is to wait for confirmation of trading above 118398, and in this case, it's preferable to wait until Monday
Bitcoin 2013 Fractal chart UPDATE = Nailed the PA target
Been posting this chart for the last few years and drew that Circle that PA hit, back in Feb..Way befppre PA arrived there.
I also drew that dashed Arrow line at the same time ad, as we can see frm the Daily chart beow, PA is bang on that line.
Why is it importnat that you know this ?
Because those Circles and Dashed lines are transposed from teh 2017 - 2021 fractal !
We do seem to have moved from one Fractal to another.
This has yet to be fully confirmed and the July Candle Close will certainly help identify this if we get a large green candle.
So, for now, we wait.
I will post more details about this later but fir now, if we follow this line, we can expect a cycle ATH of around 270K - 322K in Q4 2025
And then the BIG question is "What is next ?" because, as I have pointed out n another posts, we are also leaving a long term cycle (2009 - 2025 ) line of resistance....that we just broke free of...but need to remain above.
Judy is CRUCIAL

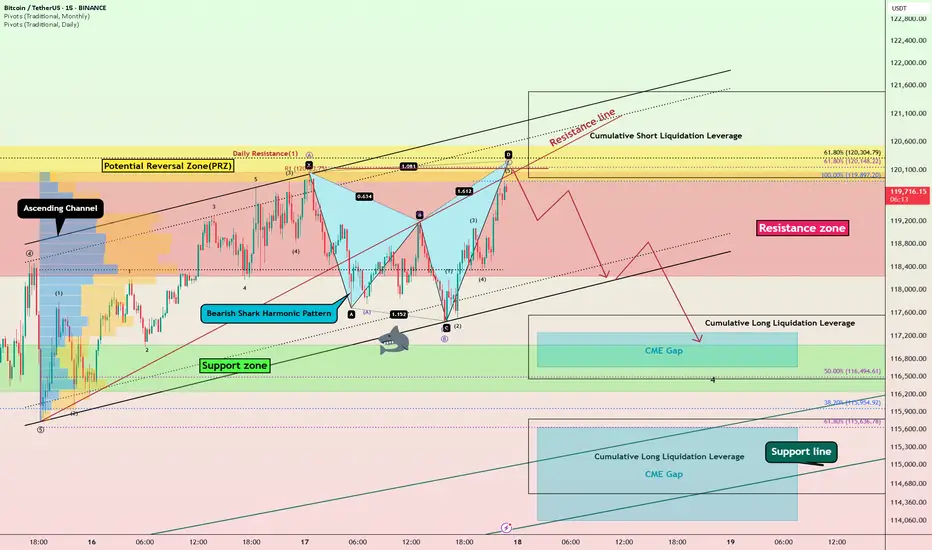
Bitcoin Bearish Shark Detected – CME Gap Below $115K in Sight?Today's analysis is on the 15-minute timeframe , following the previous analysis I shared with you on the 1-hour timeframe .
Bitcoin ( BINANCE:BTCUSDT ) is currently trading in the Resistance zone($120,100-$118,240) near the Potential Reversal Zone(PRZ) and Cumulative Short Liquidation Leverage($121,490-$119,965) .
From a technical perspective , it looks like Bitcoin is completing the Bearish Shark Harmonic Pattern on the 15-minute timeframe .
From an Elliott wave theory perspective, it looks like Bitcoin is completing the microwave 5 of wave C of the Zigzag Correction(ABC/5-3-5) .
I expect Bitcoin to start falling from the top of the ascending channel and at least decline to the lower line of the descending channel, and if the ascending channel breaks this time, we should wait for the CME Gap($117,255-$116,675)/CME Gap($115,060-$114,947) to fill.
Cumulative Long Liquidation Leverage: $117,556-$116,465
Cumulative Long Liquidation Leverage: $115,773-$114,513
Do you think Bitcoin can create a new ATH again?
Note: Stop Loss(SL)= $121,620
Please respect each other's ideas and express them politely if you agree or disagree.
Bitcoin Analyze (BTCUSDT), 15-minute time frame.
Be sure to follow the updated ideas.
Do not forget to put a Stop loss for your positions (For every position you want to open).
Please follow your strategy and updates; this is just my Idea, and I will gladly see your ideas in this post.
Please do not forget the ✅' like '✅ button 🙏😊 & Share it with your friends; thanks, and Trade safe.
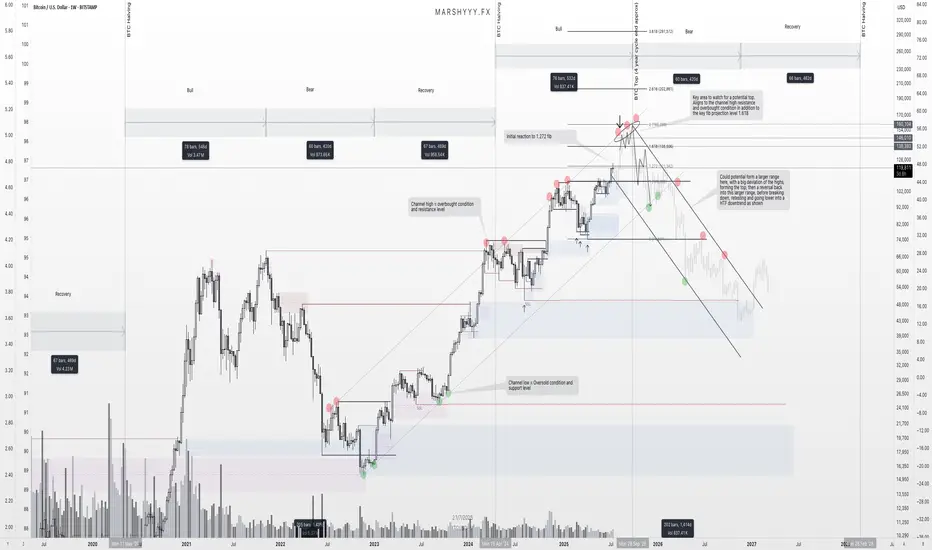
BTC – Final Push Before the Top? Here's What I’m WatchingBeen getting a lot of questions recently about where I think BTC tops this cycle, so I figured it’s time to lay out what I’m seeing on the higher timeframes and what could be coming next.
First off, I want to stress this again — USDT.D will be the key chart for spotting the top. It’s been one of the most accurate indicators across the board for understanding tops and bottoms. But it’s even more powerful when used alongside broader structure and confluence, which is what I’m doing here.
Looking at BTC’s high timeframe structure, I’ve been tracking this ascending trend channel since 2023 — and we’ve remained within its bounds beautifully. Every leg up has been met with a reaction near the channel highs, while each major correction has tapped into the lower channel support or just below midline before continuing the trend.
Right now, price is pushing back up toward that upper channel resistance, and if it behaves like it has previously, I’d expect it to act as a major magnet again. That aligns with a projected range of $140,000 to $160,000, depending how deep the wick runs or how extended this move gets from the channel midline.
On top of that, fib extensions from the previous high to low give us another layer of confidence. We’ve already seen a reaction at the 1.272 level, which paused price temporarily. The next big fib? The 1.618 — which sits right around $138k — adding confluence with the top of this HTF trend channel.
What makes this even more interesting is that this move is aligning near-perfectly with the 4-year cycle structure, which suggests a potential cycle top around September 2025. That’s roughly two months away, and it fits the pattern of previous cycles where BTC tops approximately 18–20 months post-halving.
As we approach this zone, I’ll be watching for the usual signs: slowing momentum, bearish divergence, volume anomalies, and rejection candles into resistance. But I won’t just be relying on the BTC chart alone. I’ll be stacking confluences from other key indicators too — USDT.D, BTC.D, macro risk indicators, and stablecoin flows — to confirm if this is truly the top or if there’s one more leg left in the tank.
Once the top does form, whether it's $138k or $160k or somewhere in between, I think we move into the distribution phase that begins the next macro downtrend. The next few years will be about preservation and accumulation again, and I’m already eyeing zones like $49k and below as potential long-term HTF demand levels when that time comes.
For now, we’re in what I believe is the final bullish leg of this cycle. I’m positioned, prepared, and watching closely for signs of exhaustion as we move into this zone of confluence.
Let the market do its thing — just make sure you’ve got a plan for when the music stops.
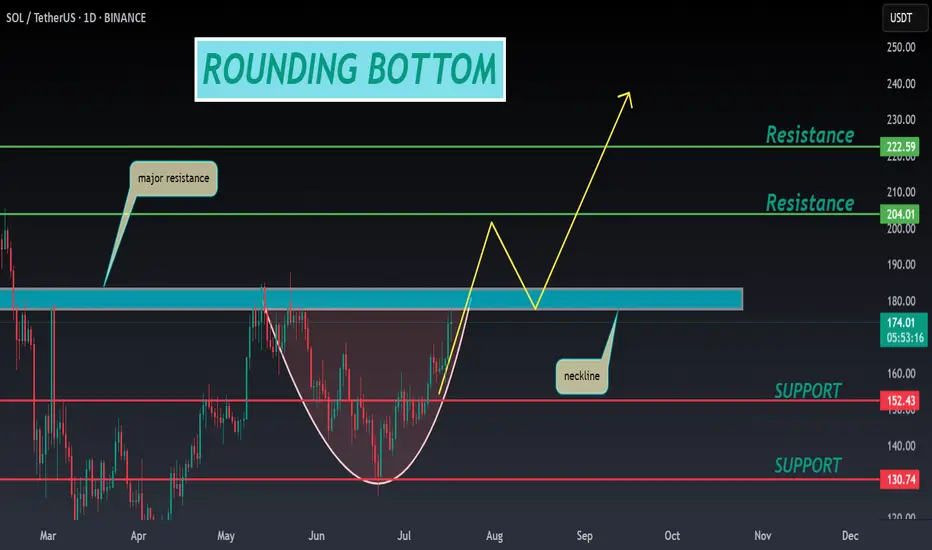
SOL ANALYSIS🔮 #SOL Analysis 💰💰
📊 #SOL is making perfect and huge rounding bottom pattern in daily time frame, indicating a potential bullish move. If #SOL retests little bit and breakout the pattern with high volume then we will get a bullish move📈
🔖 Current Price: $173.75
⏳ Target Price: $204.00
⁉️ What to do?
- We have marked crucial levels in the chart . We can trade according to the chart and make some profits. 🚀💸
#SOL #Cryptocurrency #Pump #DYOR
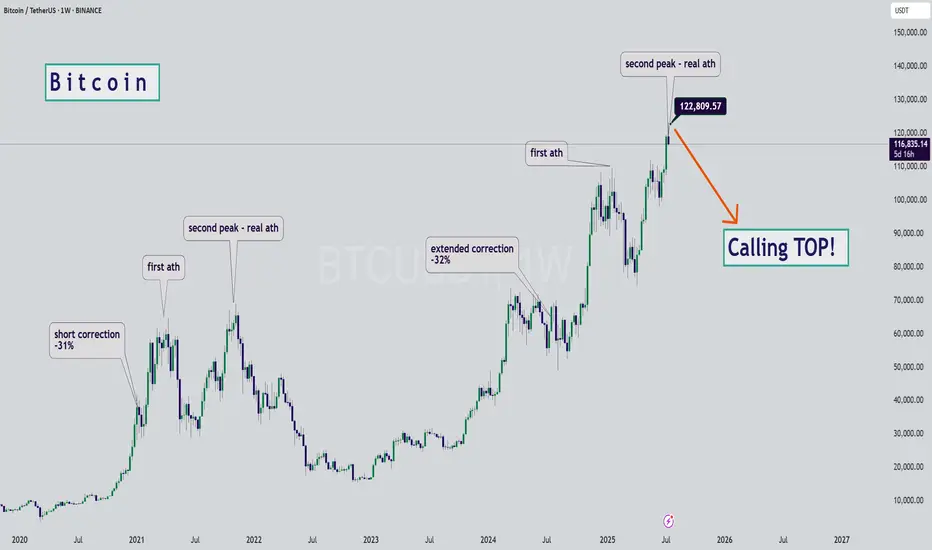
BTC - Calling the Start of the Bearish SeasonHello Watchers ☕
This was my previous Bitcoin update where I had a target of $116K, and also then closed all open positions at $122K:
I'm calling the top here mainly because of the way the chart looks, it really is classic Wyckoff if you look at the duration of the current bullish cycle, which has lasted a whole 973 Days with a 564% increase. What goes up, must come down!
Just for interest sake, the previous bullish cycle ran for 600 days with a 700% increase.
BTC - Last Resistance Before New HighsPrice is back at the same zone that rejected it months ago — but this time with momentum and a clean trendline behind it. Stoch RSI is stretched, signaling a possible short-term cooldown… or a breakout into uncharted territory.
Keep your eye on that 126K liquidity magnet 👀
#Bitcoin #BTCUSD #CryptoTrading #ChartAnalysis #TechnicalAnalysis #BreakoutTrading #TrendlineSupport #QuantTradingPro #TradingView

BITCOIN PREDICTION: INSIDER DATA THAT WILL HIT YOU HARD(warning)I am sharing with you my personal insider data of what I know about Bitcoin right now!

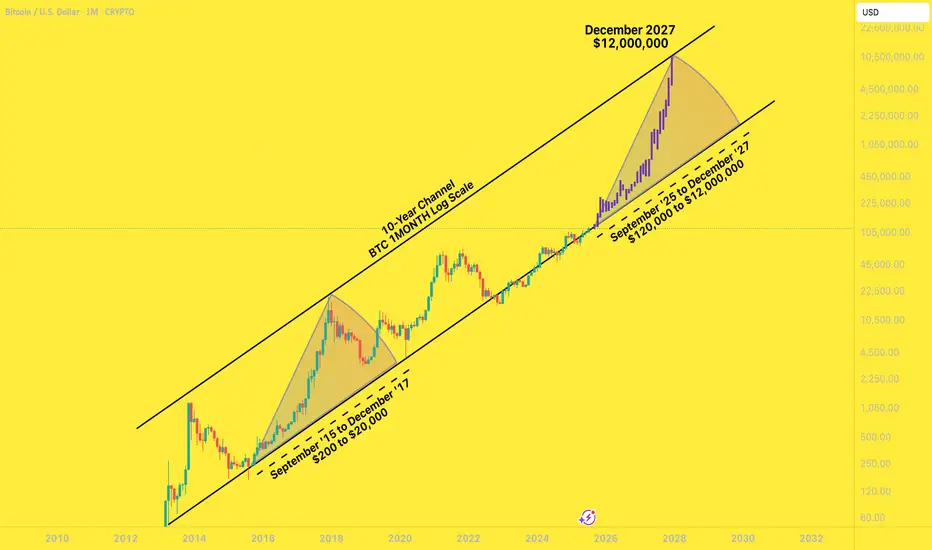
BTC to $12,000,000 December '27I had a years-old bookmarked chart from @MillionaireEconomics that I wanted to update and pick a random, extremely bullish candle pattern from the last time BTC came off the bottom channel to slap on it.
Riddle me this:
Why shouldn't Bitcoin go to $12,000,000 by December 2027?
Saylor continues to lead the way for global companies to scramble to build their own BTC warchests. These early adopters are having investor money dumped into them by the truckload.
Countries are stacking BTC
The BTC ETFs are a smash hit
Trump is all for making his own multi-billy family bitty stack
Mid-curvers will sell far too early, for far too little.
In the next two years, you'll be bombarded with countless, seemingly good reasons to sell your Bitcoins for hundreds of thousands of dollars - and then millions of dollars.
A shocking number of people will be far too early to sell. They will wake up in a cold sweat, night after night, haunted by their "could-have-been" stack, the number that updates in their head ten times a day, going up by six or seven figures a day .
... until they FOMO right back in at $11,999,999.
BTC FORECASTExpected push to the downside(below 114,400 region)
Breakout above current marked high.
Expected ATH(125,000) as target.
Best Regards,
Gideon Stephen (GS)
#bitcoin #crypto
Bitcoin -> The bullrun is not over!📣Bitcoin ( CRYPTO:BTCUSD ) is still totally bullish:
🔎Analysis summary:
A couple of months ago Bitcoin broke above the previous all time high. This was basically just the expected creation of new highs, perfectly following the underlying cycles. With respect to the long term rising channel formation, this bullrun on Bitcoin is just starting.
📝Levels to watch:
$100.000
🙏🏻#LONGTERMVISION
Philip - Swing Trader

Altcoin Season Has Officially Begun!We're now seeing top altcoins like ETH, BONK, and ONDO outpacing Bitcoin with impressive gains.
Ethereum (ETH) has just broken above $3,100
BONK is surging back toward its winter highs
Portfolios are growing daily — even without active trading
The momentum is building fast, and the next few weeks could be highly rewarding for altcoin holders. Buckle up — Altcoin Season is here.

Bitcoin Prediction that will blow your mind (warning for bulls) I am showing you that BTC made new ATH only in the USD pair and not in other pairs like EUR, and why, and what you can anticipate and what to watch out for from #Bitcoin next.
