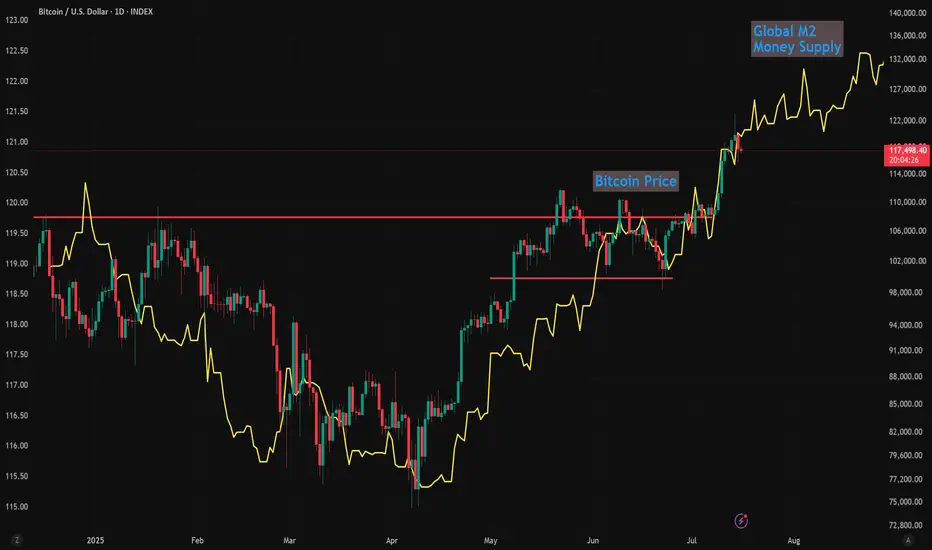
Global M2 Money Supply (70/84/90 Day offset) and $150k BTCI'm using Global M2 slightlty different than most here, and showing it behaves differently during different periods of the cycle.
Many people say M2 leads Bitcoin by 10-12 weeks (70 - 84 Days) and I've seen periods where it does... But in this phase of the bull-run 90 days is working best.
We can see the dip in M2 around now coinciding with the drop in Bitcoin prices.
Of course, these are not directly correlated and can't be relied upon as predictive.
But it's following pretty close, and overall looks great for further upside!
I'll follow up with a video on this if anybody is interested.
Bitcoinprediction
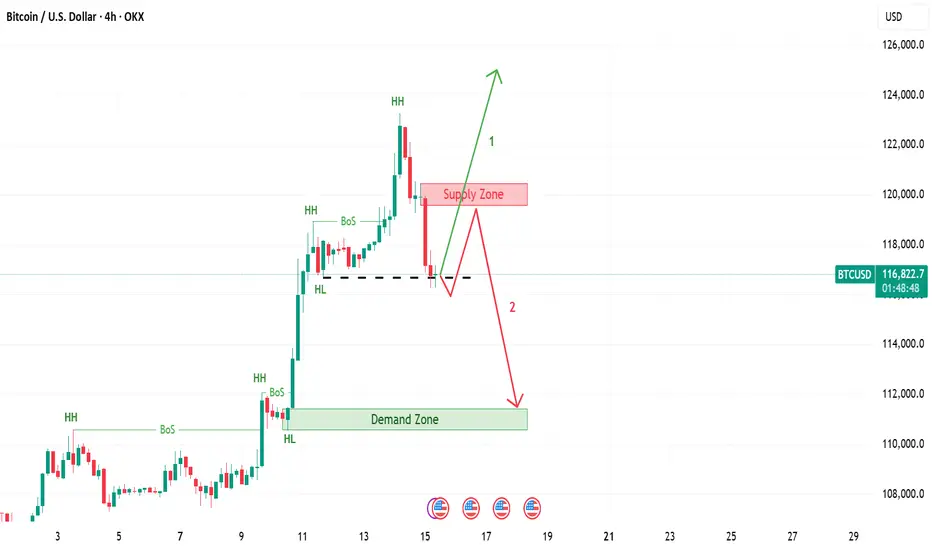
Bitcoin | 2 Scenarios If the 4 hour candle closes below last HL, then expect price return to supply zone and then go down till demand zone. If not, expect continuation of the upward trend, when 4 hour candle breaks last HH.
Which scenario you expect?
Bitcoin Eyes $200K: Why a Correction Could Come FirstAs Bitcoin continues its remarkable run, optimism is high that we could see BTC break the $200,000 mark this year. The momentum is there, with bullish sentiment across the crypto and traditional finance spaces. Yet, it’s important to acknowledge a potential short-term correction ahead before new highs are reached.
Why a Correction May Happen Soon
Several factors point to a volatile period in the weeks ahead:
Upcoming Tariffs: On August 1st, the new round of tariffs announced by President Trump is set to take effect. Trade disputes historically introduce uncertainty into global markets and can sap risk appetite, even in alternative assets like crypto.
Federal Reserve Policy: The Federal Reserve has not yet begun lowering interest rates. High rates continue to pressure both equity and crypto markets by making cash relatively more attractive and increasing the cost of leverage.
Geopolitical Tensions: Ongoing instability in the Middle East adds another layer of unpredictability. Geopolitical flare-ups often lead to market volatility as investors act defensively.
The Takeaway
While Bitcoin is on track to reach unprecedented levels this year, investors should remain mindful of the broader market context. Short-term corrections are part of any healthy bull run and can be driven by macroeconomic and geopolitical events. Staying informed and maintaining a disciplined approach will be crucial for navigating what promises to be an exciting—and eventful—rest of the year.
Not Investment Advice!
#crypto #bitcoin #short #correction #dump #uncertainty #volatility #war #news #bearish
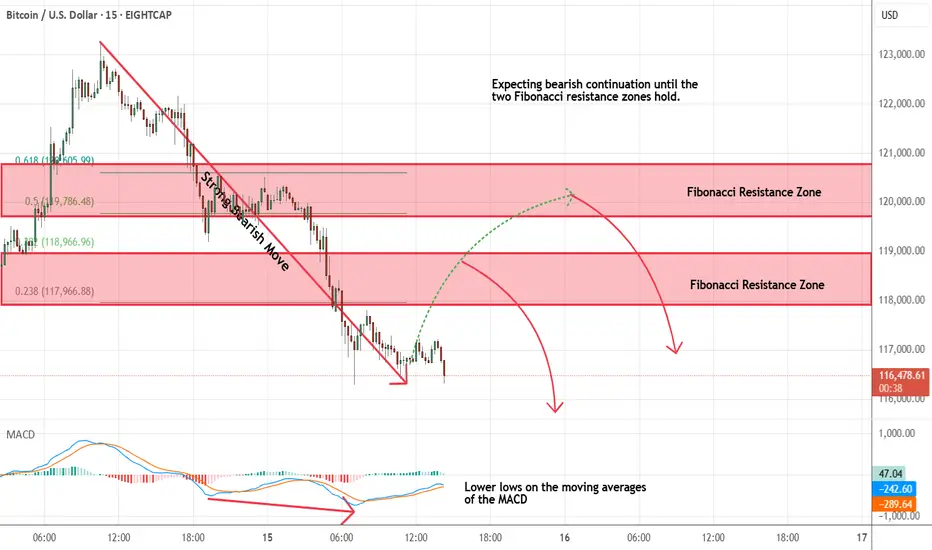
Bitcoin - Looking To Sell Pullbacks In The Short TermM15 - Strong bearish move.
Lower lows on the moving averages of the MACD.
No opposite signs.
Currently it looks like a pullback is happening.
Expecting bearish continuation until the two Fibonacci resistance zones hold.
If you enjoy this idea, don’t forget to LIKE 👍, FOLLOW ✅, SHARE 🙌, and COMMENT ✍! Drop your thoughts and charts below to keep the discussion going. Your support helps keep this content free and reach more people! 🚀
--------------------------------------------------------------------------------------------------------------------
Bitcoin Hits New Highs: Is The Institutional Money Here To Stay?Bitcoin Hits New Highs, Gains Stability and Scale in Its Institutional Era: Will It Last?
From a volatile and often misunderstood outsider, Bitcoin has embarked on a remarkable transformation, evolving into what many now see as a foundational financial layer. This new era is not fueled by the fleeting whims of retail hype, but by the calculated, long-term strategies of professional capital. The steady influx of institutional investors is profoundly reshaping Bitcoin's character, taming its notorious volatility and broadening its accessibility to everyday individuals. This seismic shift begs the question: is this newfound stability and scale a permanent feature of the financial landscape, or a transient phase in Bitcoin's tumultuous history?
The Dawn of a New Epoch: The Institutional Stampede
For years, the narrative surrounding Bitcoin was one of a grassroots monetary experiment, a digital curiosity championed by cypherpunks and early internet adopters. Wall Street remained a skeptical spectator, wary of the asset's wild price swings, its lack of regulatory clarity, and its disruptive potential. However, Bitcoin's unyielding resilience and its core value proposition of a decentralized, finite digital asset gradually wore down this institutional resistance. The floodgates did not just creak open; they were blown apart with the regulatory approval of spot Bitcoin Exchange-Traded Funds (ETFs). This landmark decision marked a clear and decisive tipping point, a formal invitation for mainstream finance to embrace the world's first cryptocurrency.
This regulatory green light has had a profound and cascading impact. It has, in a single stroke, legitimized Bitcoin in the eyes of the most conservative financial establishments. More importantly, it has provided a familiar, regulated, and highly accessible entry point for a vast and previously untapped ocean of capital. Exposure to Bitcoin is no longer confined to specialized crypto-native platforms, which often carried a steep learning curve and perceived security risks. Now, it can be seamlessly integrated into the traditional investment portfolios that millions of people rely on, managed through their existing brokerages, pension funds, and even insurance products. This growing wave of institutional adoption is not merely inflating Bitcoin's price; it is fundamentally anchoring it more firmly within the global economy, weaving it into the very fabric of the system it was once designed to challenge.
The numbers illustrating this shift are staggering. In a remarkably short period, spot Bitcoin ETFs have amassed well over $138 billion in assets. This figure is not static; it represents a dynamic and growing pool of capital, reflecting sustained institutional interest. Registered Investment Advisors (RIAs), who manage the wealth of millions of Americans, along with sophisticated hedge funds and forward-thinking pension funds, represent a growing share of this investment. These are not speculative day traders but entities with long-term horizons and rigorous due diligence processes. Their participation signals a deep conviction in Bitcoin's future.
This institutional embrace extends far beyond the realm of ETFs. Major corporations have continued their aggressive accumulation of Bitcoin, viewing it as a treasury reserve asset superior to cash. This trend of corporate and institutional adoption is a key driver of Bitcoin's maturation, lending it a newfound sense of legitimacy and stability that was unimaginable just a few years ago. The current market cycle is thus being defined not by the frenetic energy of individual retail investors, but by the methodical and powerful currents of professional capital.
Taming the Beast: Volatility in the Institutional Age
One of the most significant and welcome consequences of this institutional influx has been the taming of Bitcoin's infamous volatility. For most of its history, Bitcoin's price chart resembled a dramatic mountain range, with breathtaking peaks and terrifying valleys. This volatility was its defining characteristic and its biggest barrier to mainstream acceptance. Institutional capital, however, operates on a different wavelength. With its longer time horizons and more systematic, data-driven approach, it behaves differently from the often emotionally-driven retail market.
While individual investors are more prone to panic-selling during sharp price dips or piling in during euphoric rallies, large institutions are more likely to employ disciplined strategies like dollar-cost averaging. They see price corrections not as a reason to panic, but as a buying opportunity. This behavior provides a stabilizing force, creating a floor during downturns and tempering the irrational exuberance of market tops.
This shift in market dynamics is evident in the flow of funds into the new financial products. These investment vehicles have frequently seen strong net inflows during price corrections, with major asset managers absorbing billions in capital even as retail sentiment soured. This institutional buying pressure acts as a powerful buffer, moderating the extreme price swings that have historically characterized the Bitcoin market.
While Bitcoin's volatility remains higher than that of traditional assets like gold or global equities, its trajectory is one of marked and consistent decline. This decline is a natural consequence of its growing market capitalization. As the total value of the network expands, the relative impact of new capital inflows or outflows is diminished, leading to smoother price action.
Interestingly, Bitcoin's volatility has at times converged with, and even fallen below, that of some mega-cap technology stocks, which themselves can exhibit significant price swings. This convergence is making traditional investors take a closer look, as the risk-reward profile of Bitcoin becomes more palatable and understandable. Historically, investors have been well-compensated for taking on Bitcoin's volatility, with its risk-adjusted returns often outperforming major stock indices over multi-year periods.
From Digital Gold to a Financial Base Layer: An Evolving Narrative
For much of its existence, Bitcoin has been championed as "digital gold." This narrative is powerful and intuitive. Like gold, it has a finite, predictable supply. It is decentralized, meaning no single entity can control it or create more of it at will. And it is censorship-resistant, offering a store of value outside the traditional financial system. This narrative has been a potent driver of adoption, particularly among those seeking a hedge against inflation, currency debasement, and geopolitical uncertainty.
However, the increasing stability brought about by institutional investment is fostering a new and complementary narrative: Bitcoin as a potential medium of exchange and, more broadly, as a foundational settlement layer for the global financial system. Lower volatility is a crucial prerequisite for any asset to function effectively as a currency. When prices are relatively stable, merchants and consumers can transact with confidence, knowing the value of their money will not drastically change overnight.
The development of Layer 2 solutions, most notably the Lightning Network, is a critical piece of this puzzle. These protocols are built on top of the Bitcoin blockchain and are designed to enable faster, cheaper, and more scalable transactions. They address the primary technical hurdles that have hindered Bitcoin's use for everyday payments, such as coffee or groceries. As this technological infrastructure continues to mature and gain adoption, Bitcoin's utility beyond a simple store of value is poised to expand significantly.
Furthermore, Bitcoin's historically low correlation with traditional assets like stocks and bonds makes it an exceptionally valuable tool for portfolio diversification. In a world where asset classes are becoming increasingly interconnected, Bitcoin offers a unique return stream. Adding even a small allocation of Bitcoin to a traditional 60/40 portfolio can potentially enhance returns over the long term without a commensurate increase in overall risk. This diversification benefit is a key part of the thesis for many institutional investors.
Navigating the Market's Pulse: Price, Psychology, and Predictions
As Bitcoin navigates this new institutional era, the question on every investor's mind is: where does the price go from here? The recent surge to new all-time highs above the $123,000 mark has been met with a mix of bullish enthusiasm and cautious optimism. After reaching this peak, the market saw a natural retreat, with bulls pausing for a breath and prices consolidating. The price action has been dynamic, with a fresh increase starting above the $120,000 zone before finding temporary resistance and trading near the $118,500 level. This kind of price discovery, including breaks below short-term bullish trend lines, is characteristic of a market absorbing new information and establishing a new support base.
Technical analysis suggests that the current rally may have further to run. Having decisively broken through key psychological and technical resistance zones, some analysts see a clear path toward $135,000 or even $140,000 in the medium term. The price trading well above key long-term moving averages confirms that the underlying momentum remains strongly bullish.
However, a closer look at market sentiment and on-chain data reveals a more nuanced and perhaps even more bullish picture. Despite the record-breaking prices, the market has yet to enter the state of "extreme greed or euphoria" that has characterized the absolute peaks of previous bull cycles. Key metrics that track the profitability of long-term holders remain below the "euphoria" zone, suggesting that the smart money is not yet rushing to take profits. This could indicate that the current rally, while impressive, is still in its early or middle phases, with more room to grow before reaching a cyclical top. A delay in the full-blown bull market euphoria could ultimately push Bitcoin higher than many expect.
Of course, the market is not a one-way street. The spike to $123,000 was followed by an increase in Bitcoin flowing into exchanges, a potential sign of short-term profit-taking and a cooling-off period. Even large, strategic players may take profits during rallies. The news of Bhutan's sovereign wealth fund strategically unloading a portion of its holdings is a prime example. While these sales can introduce short-term selling pressure, they are also a healthy part of a functioning market. The fact that inflows, even at the peak, were just a fraction of those seen in earlier parts of the year suggests that the selling pressure is not yet overwhelming.
The Sustainability of the Institutional Era: A Critical Analysis
The institutionalization of Bitcoin is undoubtedly a paradigm shift, but its long-term sustainability is not a foregone conclusion. While the current trend is one of increasing adoption and stability, there are several factors that could challenge this new status quo and must be considered by any serious investor.
One potential risk is the concentration of Bitcoin in the hands of a few large institutions. While this brings stability in the short term, it also introduces a potential point of centralization in a decentralized system. If a handful of major asset managers were to simultaneously decide to sell their holdings—perhaps due to a change in their own internal risk models or a major macroeconomic shock—it could trigger a significant market downturn. Such a move would likely be exacerbated by retail investors following the lead of these financial giants.
Regulatory risk also remains a significant and unpredictable concern. While the approval of spot Bitcoin ETFs in the United States was a major step forward, the global regulatory landscape is a complex and evolving patchwork. Any future crackdowns, unfavorable tax treatments, or restrictive regulations in major jurisdictions could dampen institutional enthusiasm and hinder further adoption. The path to full regulatory clarity is likely to be long and fraught with challenges.
Furthermore, the narrative of Bitcoin as an inflation hedge has yet to be definitively proven across all possible economic conditions. While it has performed well during recent periods of high inflation and monetary expansion, its correlation with risk assets means it can also be sensitive to economic downturns and tightening financial conditions. A prolonged period of global recession or stagflation could test its resilience as a store of value in new and unexpected ways.
Conclusion: A Maturing Asset in an Evolving World
Bitcoin has come an immeasurably long way from its obscure beginnings as a niche digital currency for a small community of technologists. The influx of institutional capital has ushered in a new era of stability, accessibility, and legitimacy. The launch and wild success of spot Bitcoin ETFs has been the primary catalyst, providing a regulated and familiar on-ramp for a vast pool of professional money that is reshaping the asset's very DNA.
This institutional embrace is about far more than just price appreciation; it is fundamentally changing the character of Bitcoin. Its volatility, while still present, is on a clear downward trend, making it a more viable contender as both a global store of value and a neutral settlement network. The long-held dream of Bitcoin as a foundational layer of a new, more transparent financial system is slowly but surely taking shape.
However, the road ahead is not without its challenges. The risks of institutional concentration, regulatory uncertainty, and macroeconomic headwinds are real and should not be underestimated. The sustainability of this new era will depend on a delicate interplay of market forces, regulatory developments, and continued technological innovation on its network.
What is clear is that Bitcoin has earned its place on the world's financial stage. It is no longer an outsider looking in, but a maturing asset that is being progressively integrated into the global economic fabric. Whether this institutional era will be a lasting one remains the defining question of our time. But one thing is certain: Bitcoin's journey is far from over, and its evolution will continue to be one of the most compelling and consequential stories in the world of finance for years to come.
₿itcoin: Pushing Higher—But Watch for a Reversal AheadAfter taking a brief pause over the weekend, Bitcoin resumed its upward momentum early this morning, trading within the blue Target Zone between $117,553 and $130,891. This marks the first time the cryptocurrency giant has traded above the key $120,000 level. Within this zone, and in line with our primary scenario, we continue to anticipate the peak of the corrective wave B rally, followed by a trend reversal to the downside. We expect a significant wave C decline, targeting the lower blue zone between $62,395 and $51,323. As such, prices in the upper blue Target Zone may present an opportunity to take (partial) profits on existing long positions and, where appropriate, to initiate potential short positions as a hedge. These shorts could be protected with a stop 1% above the upper boundary of the zone, given there remains a 35% probability that Bitcoin could break directly above the $130,891 resistance and set a new high as blue wave alt.(i).
📈 Over 190 precise analyses, clear entry points, and defined Target Zones - that's what we do.

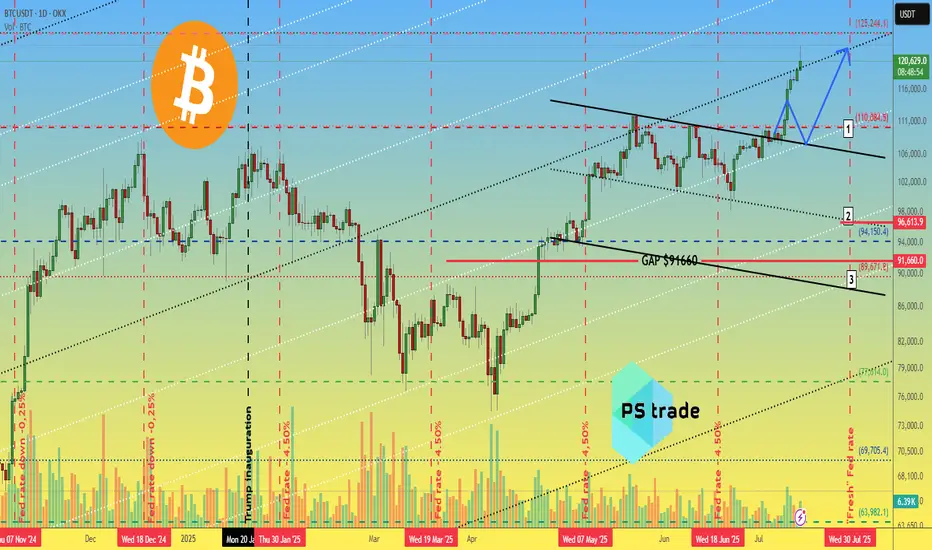
Bitcoin BTC price analysis📈 Two weeks have passed since the previous analysis of the OKX:BTCUSDT chart, and the market has decided to go with the 1️⃣ scenario.
Less than 3% remains to reach $125,000, and the price could easily get there by inertia, but that's a minor detail.
CRYPTOCAP:BTC is updating its ATH, and total liquidations on the crypto market over the past 24 hours are “only” $750 million, of which almost $450 million is accounted for by #Bitcoin.
Weak, very weak... Previously, longs were liquidated for $2+ billion, and it was reported that the actual amount of liquidations was significantly higher due to the fact that the exchanges' data was not fully disclosed. (For the sake of objectivity, at that time, the lion's share of liquidations was accounted for by altcoins, but now this is not the case).
◆ During this time, Trump introduced new tariffs — the market was “on a roll” — it swallowed it and didn't even notice the news.
◆ Tomorrow, July 15, the US CPI will be announced — the forecast is for inflation to rise from 2.4% to 2.6% (although there are rumors that the situation in the US economy is much worse and this may "come to light" tomorrow).
◆ July 16 - PII announcement - these indicators may act as a “cold shower” to bring the market out of its euphoria.
◆ From July 14 to July 18, the US Congress is considering three key crypto laws, including the GENIUS Act. Major players consider this a powerful driver. Perhaps the current growth has already “played out” and priced in expectations for news.
🪐 And this trading week will end on 18.07 with the start of Mercury retrograde, even the US Congress is postponing all important matters, and you still don't believe in it ))
🖐 Long positions are certainly beneficial, appropriate, and in line with the trend at present, but it is advisable to hedge them with stops, because as mentioned above: the price is rising, and there are few liquidations. During the previous decline in the cryptocurrency market, there were significantly more liquidations of long positions, and they may wish to repeat this.
And with the #BTCUSD price correction, there will be a fixation: some will have profits, and some will have losses in stablecoins, which would then be logical to reinvest as capital in altcoins. First in something more voluminous and less risky, and in the last stage, they will pump everything in a row)
But until then, we still need to survive and preserve our deposits.
So, in your opinion: correction to one of the levels:
1️⃣-$110k 2️⃣-$97k 3️⃣-$90k
or
is everything written above complete nonsense, and the market growth has only just begun to “take off”?
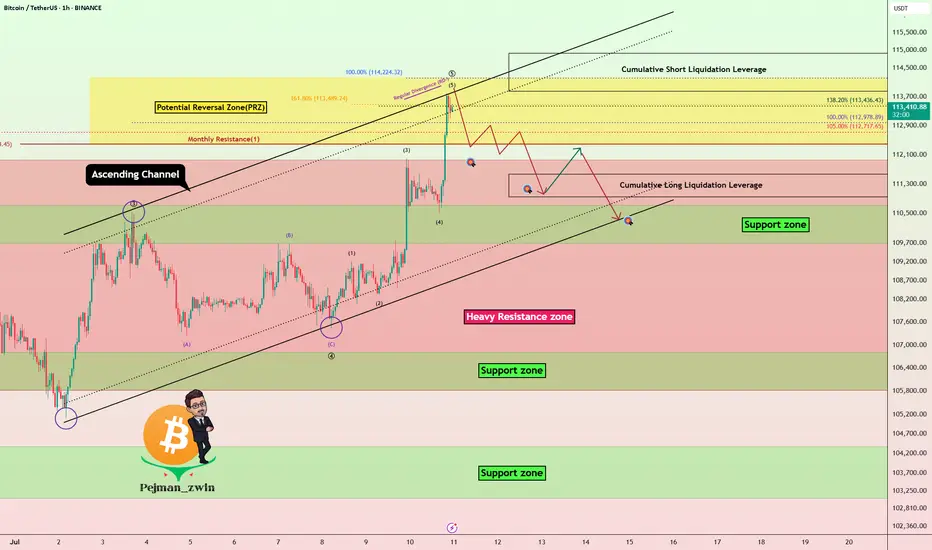
Bitcoin Hits New ATH – Is It Time to Short?Bitcoin ( BINANCE:BTCUSDT ) managed to form a new All-Time High(ATH) in the previous one-hour candles .
Do you think Bitcoin can create a new ATH in the coming hours?
Bitcoin is currently trying to break the Heavy Resistance zone($110,720-$105,820) . It has also penetrated the Potential Reversal Zone(PRZ) and Cumulative Short Liquidation Leverage($114,910-$113,850) .
In terms of Elliott wave theory , it seems that the 5 impulsive waves that Bitcoin started in the last 3 days can be completed above the ascending channel and PRZ .
Also, we can see the Regular Divergence(RD-) between Consecutive Peaks.
I expect Bitcoin to drop to at least Cumulative Long Liquidation Leverage($111,563-$110,947) . At least the price zone Bitcoin is in at the time of publishing this analysis is better for short positions , even if the Stop Loss(SL) is touched .
Note: Stop Loss(SL)= $115,023
Please respect each other's ideas and express them politely if you agree or disagree.
Bitcoin Analyze (BTCUSDT), 1-hour time frame.
Be sure to follow the updated ideas.
Do not forget to put a Stop loss for your positions (For every position you want to open).
Please follow your strategy and updates; this is just my Idea, and I will gladly see your ideas in this post.
Please do not forget the ✅' like '✅ button 🙏😊 & Share it with your friends; thanks, and Trade safe.
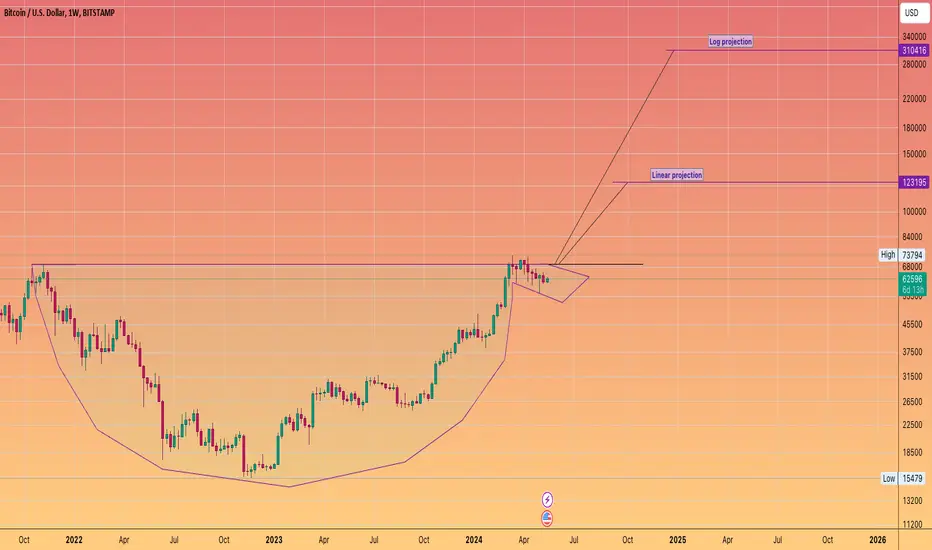
Balla is still Bullish on BITCOIN. Cup & Handle pattern. The trend is still our friend.
I still see bullish developments in the price action.
We must have patience.
Dips still must be bought.
The plan hasn't changed.
We still aiming for that time period of 9 -15 months post #BTC Halving.
We are only one month down :)
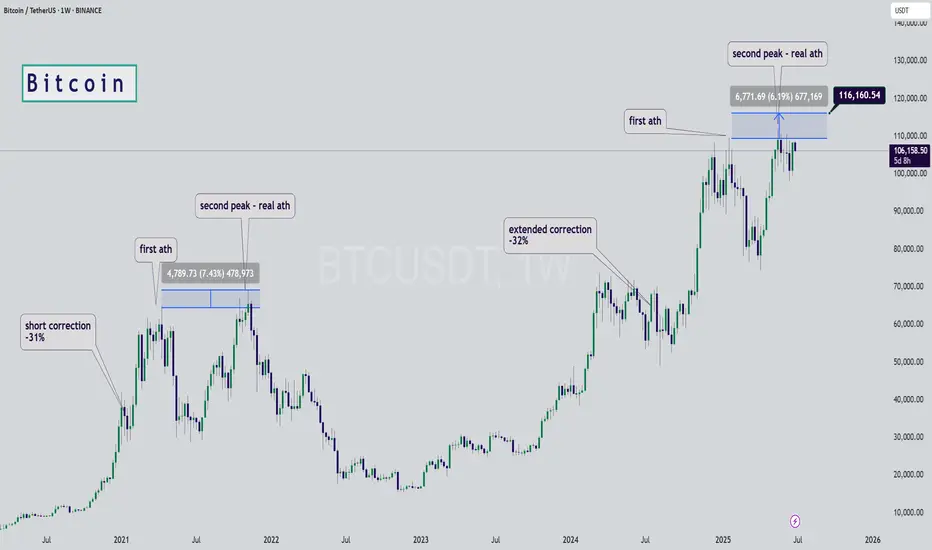
Bitcoin Fractal, increase to $116k Hi Everyone☕👋
BINANCE:BTCUSDT
Been such a long time since I posted. Today I'm looking at BTCUSDT, and I'm looking at the previous all time high cycle and what we were seeing (the pattern aka fractal).
Here's why we're likely going a little higher.
First correction of -32%
Followed by first peak, ATH
Correction, then the second peak and the REAL ath. Which is where we likely are:
Interesting to note that the previous time, the second ath was NOT THAT MUCH HIGHER. This should be considered to manage expectations in terms of how high we can go. Anything above +6% is a bonus.
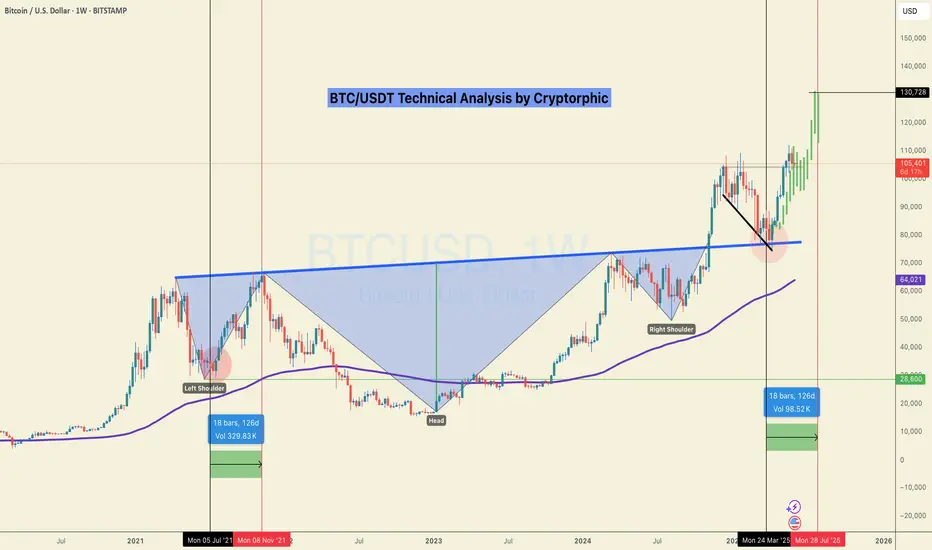
#BTC/USDT It's not over yet! Eying at 130K +ALTCOIN CHEAT SHEET!The last time I shared this chart was on April 14th, when Bitcoin was trading around $84,000 — right when panic was setting in across the market.
The message back then was simple: don’t panic, it’s just a retest.
And here we are again, revisiting the same sentiment with a new chart!
There are a lot of “double top” charts circulating in the space right now, but let me be clear: it’s not over yet.
Before jumping to conclusions, go through this chart and analysis to understand the full picture.
Bitcoin closed the week at $105,705 — certainly higher than most expected just a few days ago.
This marks the first red weekly candle after seven consecutive green closes, which is normal in the context of a healthy uptrend. We're still midway toward the broader target, so there’s no reason to panic or shift into disbelief.
Yes, we may see further corrections in BTC over the coming days or week, potentially down to $98K, and in a less likely scenario, even $ 92K. But this time, Ethereum is showing signs of strength and is likely to outperform Bitcoin, creating high-quality entry opportunities across the altcoin market. In other words, this phase is not a threat, it's an opportunity. BTC is still destined to hit $130k+ as per charts and other important metrics.
Here’s a typical market structure and reaction flow to help put things in perspective:
1. Bitcoin rallies — Altcoins underperform or get suppressed due to capital rotation into BTC.
2. Bitcoin corrects — Altcoins correct further as fear increases and dominance rises.
3. Bitcoin stabilises — Ethereum begins to gain strength, often leading the altcoin recovery.
4. ETH/BTC ratio increases — Ethereum holds up better while many altcoins continue to lag.
5. Bitcoin breaks ATH — This triggers a gradual recovery in altcoins.
6. BTC dominance peaks — Altcoins start gaining serious momentum.
7. Capital rotates from BTC and ETH into altcoins — Sectors tied to the current narrative (like meme coins this cycle, and Metaverse/NFTs in the last one) begin to lead.
8. Altcoin season begins — Utility and mid-cap tokens follow, often delivering strong returns in the final phase.
This pattern has repeated across cycles. Currently, we appear to be in the transition between Bitcoin stabilising and Ethereum gaining dominance — typically the stage that precedes a strong altcoin rally.
Now is not the time to assume the move is over. Stay objective, monitor capital rotation closely, and prepare for what comes next.
If your views resonate with mine, or if this post adds any value to you, please boost with a like and share your views in the comments.
Thank you
#PEACE
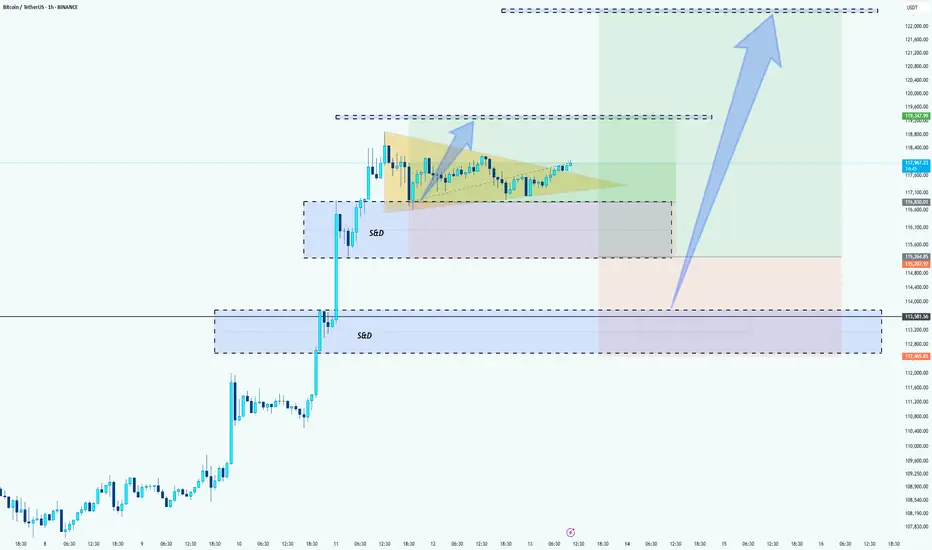
BTC Bullish Setup: Two Long Positions Aligned for ContinuationHello guys!
Bitcoin is currently in a strong uptrend, consolidating after a sharp move up. The chart highlights a textbook bullish continuation pattern (pennant/triangle), suggesting momentum is building for another leg up.
Attention:
This is not an either-or setups. Both long entries are valid and could trigger one after the other, offering layered opportunities for bulls.
1- First Long: Breakout from Bullish Pennant
Price is tightening inside a triangle after a strong impulse move.
A breakout above the resistance around $118K would confirm continuation.
Entry on the breakout targets the upper liquidity zone near $122K.
2- Second Long: Pullback to S&D Zone (around $115K)
If the breakout happens and then retraces, watch for price to revisit the S&D zone at $115,200–$115,800.
This area will act as support and provide a second long opportunity.
target: around $122k
BTC Weekly Update -as of Jul14🕰 Timeframe:
📆 Date:
🔎 Market Overview:
💼 Massive Institutional Inflows:
▪️ Over $1.1 billion in net capital inflows have entered spot Bitcoin ETFs in recent days, bringing the total weekly inflows to $2.72 billion so far.
▪️ The total assets under management (AUM) across all Bitcoin ETFs now exceed $150 billion, representing over 6% of Bitcoin’s total market capitalization.
⚖️ Favorable Political and Regulatory Support:
▪️ The ongoing Crypto Week in Congress is reviewing key legislative proposals like the Genius Act and the Clarity for Digital Assets Act, both of which offer promising regulatory clarity for the crypto industry.
▪️ Additionally, former President Trump’s executive order to establish a “Strategic Bitcoin Reserve” signals strong official political support for Bitcoin adoption.
📊 On-Chain & Sentiment Indicators
📦 Exchange Reserves:
Bitcoin reserves on centralized exchanges are at their lowest levels in years, suggesting a trend toward long-term holding (HODLing) and reduced selling pressure.
🧠 Fear & Greed Index:
The sentiment index remains firmly in the “Greed” zone, even hitting its highest level since May, indicating strong bullish sentiment among retail and institutional investors.
🌀 Whale Activity:
Whale wallets continue to show heavy accumulation, with large and steady transfers into private wallets, further supporting a bullish on-chain trend.
📈 Technical Setup
🔵Trend: Ranging upward
🔸 Key Support: 118,000➖ 115,000
🔸 Key Resistance: 125,000➖ 130,000
🔸 Indicators Used: RSI above 70
🧭 Next Week – Key Points
🔹 Watch for the outcomes of Crypto Week legislation in Washington — this will be a key driver for market direction.
🔹Monitor ETF capital inflows — if daily inflows stay above $500M, the bullish trend will likely strengthen.
🔹 Track the Federal Reserve's interest rate policy and the USD outlook, especially in response to inflation or other macroeconomic factors.
🔚 Summary: Final Analysis
📌 After reaching a new all-time high above $122K on July 14, Bitcoin’s bullish trend has strengthened. Strong institutional inflows and political support have reinforced the foundation for growth.
● Key Level Ahead: $125,000
● Outlook: If price consolidates above resistance, we could see a move toward $135K and beyond.
● Weekly Bias: Bullish, with potential for a pullback before continuation upward.
✅ If you like this analysis, don't forget to like 👍, follow 🧠, and share your thoughts below 💬!

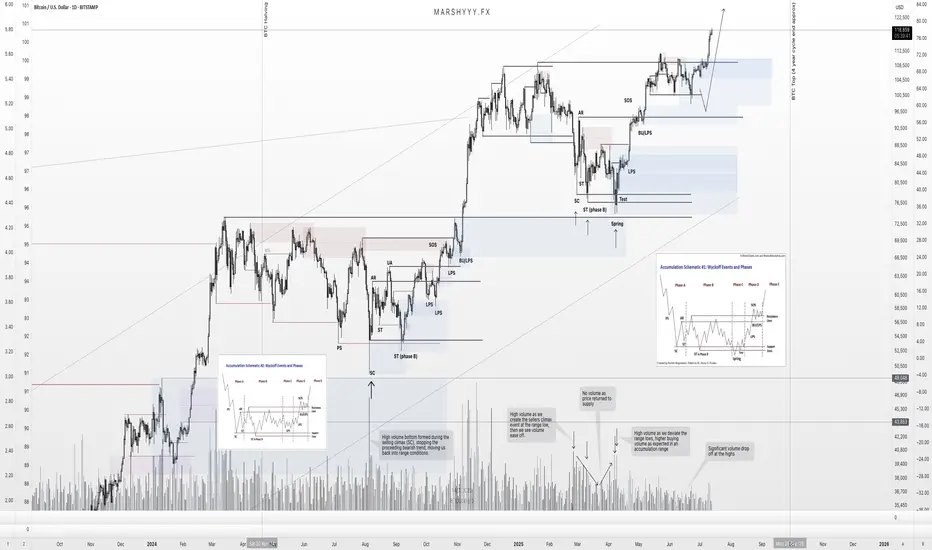
BTC – Textbook Pullback. New ATHs. What’s Next?Back in mid-June, I published a BTC update calling for a local correction into HTF demand while most were screaming bear market and waiting for deeper breakdowns.
Price action played out exactly as forecasted.
BTC swept the $100k swing low, front-ran my first demand zone by $400, and launched into a powerful reversal — just like it did back in April, where it also front-ran the key HTF demand before rallying.
That move took us straight into new all-time highs (ATHs) — now trading comfortably around $118k.
🧠 What Happened?
✅ Liquidity sweep of the prior low
✅ Front-run demand zone (perfect HTF structure)
✅ Strong bullish reaction and higher high
✅ Confluence from USDT.D rejection at 5.25%
✅ Alts showing signs of strength as BTC rallies
The entire setup aligned perfectly across BTC, USDT.D, TOTAL, and OTHERS.D — all of which I’ve been tracking in tandem.
🔮 What Now?
With BTC now in price discovery, I expect continuation higher — but not without the possibility of a short-term pullback.
📉 A potential retest of the $108k zone isn’t off the table. This level aligns with:
- Prior breakout structure
- Range high retest
- Local demand before continuation
But even if we go straight up — I remain HTF bullish into the final phase of this cycle, supported by:
- USDT.D structure still bearish
- BTC.D showing signs of distribution
- ETH.D and OTHERS.D gaining momentum
- Altseason rotation already starting to pick up
🧭 The Macro Outlook
The 4-year cycle projection still points to a Q3 2025 top — likely between August late and September based on historical cycle timing, but this could deviate.
That gives us a window of 2–3 months for this final leg to unfold — and it’s already in motion.
Stay focused. Stick to your plan. Ride the trend, don’t chase it.
Let me know what levels you're watching next, and whether you think we get that $108k retest — or we go vertical from here.
1D:
3D:
4D:
1W:
1M:
— Marshy 🔥
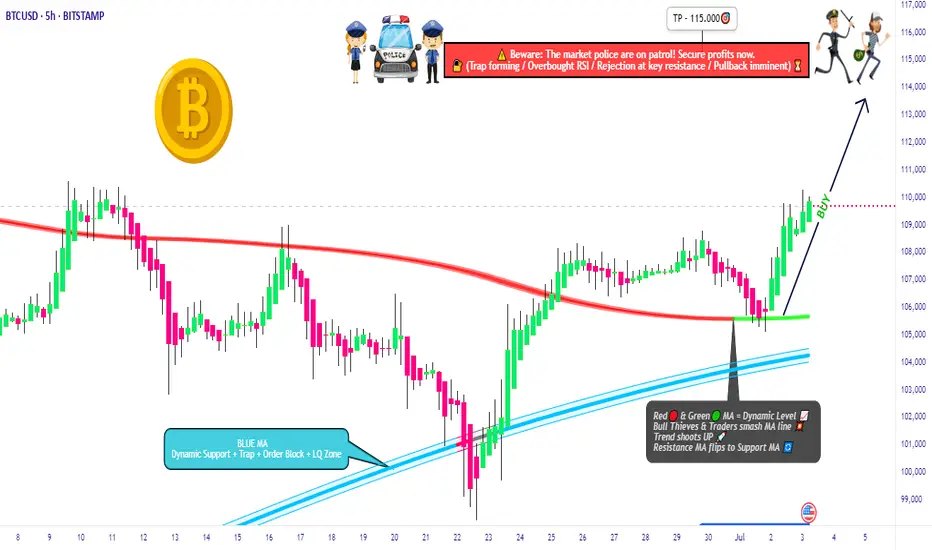
BTC/USD Heist Mode: Buy Low, Escape Rich🔓 BTC/USD Crypto Vault Breach: Thief Strategy for Long Entry Robbery (Swing/Day Setup) 🔓
🌟Hi! Hola! Ola! Bonjour! Hallo! Marhaba!🌟
Dear Money Makers & Robbers, 🤑💰💸✈️
🚨 Welcome to our next Thief Trading-style breakout mission — this time targeting the mighty BTC/USD vault. Using a fusion of technical precision and macro-level insight, we're charting a long entry blueprint for a profitable heist.
🔑 Entry Plan
"The vault is open!" 💥
Buy at current price or set Buy Limit near swing lows (15–30min timeframe pullback entries). We're timing the entry with stealth—precision over panic.
🛑 Stop Loss Setup
SL set near recent swing low (4H TF reference: ~104.000).
Adjust based on position sizing, risk appetite & multi-order tactics.
🎯 Take Profit Target
Targeting 115.000—or exit earlier if price action stalls. Get in, get out. Efficiency is the code.
👀 Scalpers' Notice
Only work the Long side. If your bag’s heavy, strike instantly. If light, ride with swing robbers. Use trailing SLs to protect your bag.
📈 Why We’re Bullish
Market momentum favors the bulls:
Overbought zones acting as lures
Bearish traps ready to flip
Key confluences from sentiment, COT, on-chain & macro analysis
➡️ Full supporting breakdown available 👉👉🔗🔗.
📢 Risk Note – Stay Sharp
Major news events = increased volatility ⚠️
Avoid entries during news. Trail stops to protect running profit. Rob smart.
💖 Boost the Crew
If this blueprint aligns with your mission, hit that Boost button. It fuels the team, and together, we profit like pros. One heist at a time. 💪🎉
🧠 Stay ready—next plan drops soon. Until then, rob safe, rob smart. 🐱👤
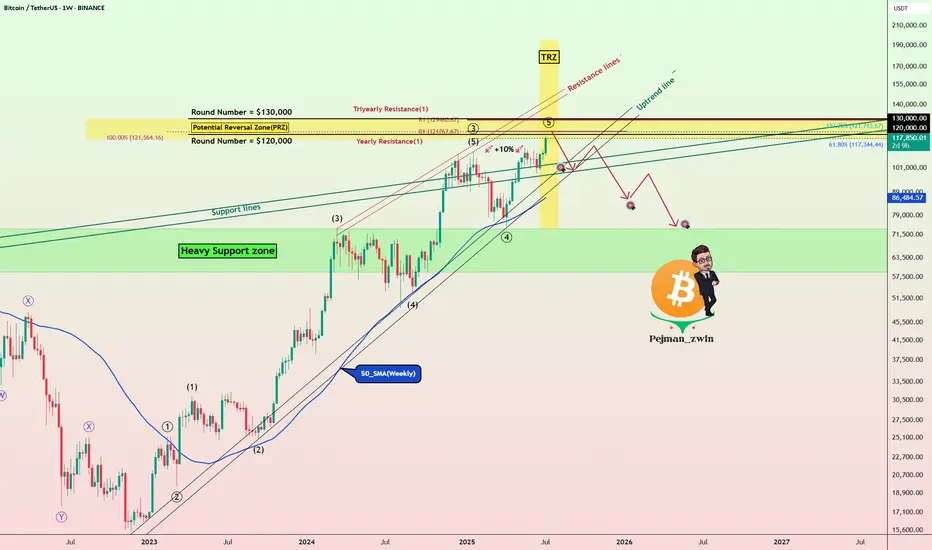
Bitcoin Roadmap=>End of RallyBitcoin ( BINANCE:BTCUSDT ) has gained nearly +10% in the recent weekly candle so far. The question is where this rally could end up. So to get to that zone, let’s go to the weekly timeframe .
Before we start this analysis, let’s take a look at my last analysis on the weekly timeframe , which was well into the Potential Reversal Zone(PRZ) . ( Analysis time: 9 JUN 2025 )
Bitcoin has now entered the Potential Reversal Zone(PRZ) and Time Reversal Zone(TRZ=June 23 to August 4) , and these zones could be the zones where this Bitcoin rally will end. Do you agree with me?
In terms of Elliott Wave theory , Bitcoin appears to be completing a main wave 5 , as the main wave 3 was an extended wave . The main wave 5 could end at the Potential Reversal Zone(PRZ) .
I expect Bitcoin to start a main correction from the Potential Reversal Zone(PRZ) and could continue to support lines and near the $105(at least) .
What do you think about the end of the Bitcoin rally?
Note: Sell orders near $120,000 are very heavy.
Note: Cumulative Long Liquidation Leverage attractive volume for liquidation.
Note: If Bitcoin goes above $130,000, it can continue to rise to the Resistance lines (near $150,000).
Please respect each other's ideas and express them politely if you agree or disagree.
Bitcoin Analyze (BTCUSDT), weekly time frame.
Be sure to follow the updated ideas.
Do not forget to put a Stop loss for your positions (For every position you want to open).
Please follow your strategy and updates; this is just my Idea, and I will gladly see your ideas in this post.
Please do not forget the ✅' like '✅ button 🙏😊 & Share it with your friends; thanks, and Trade safe.
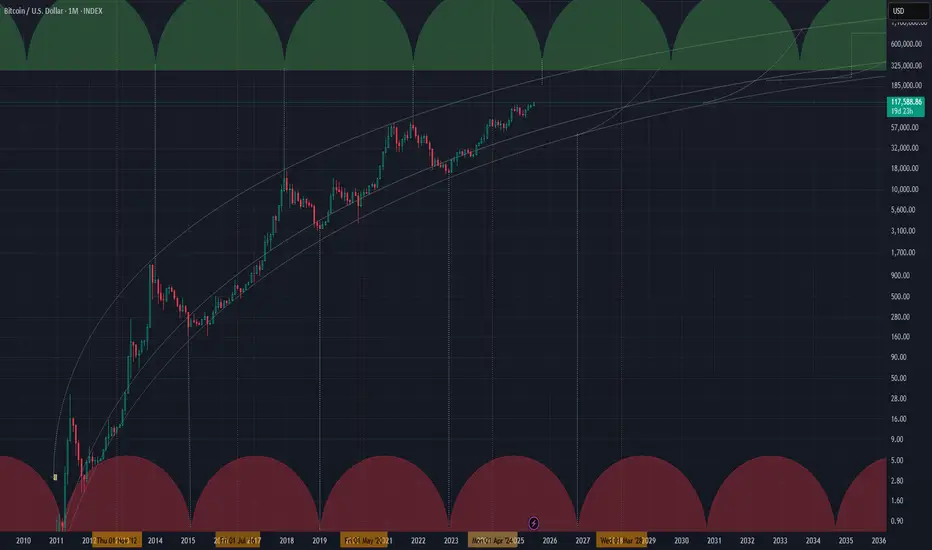
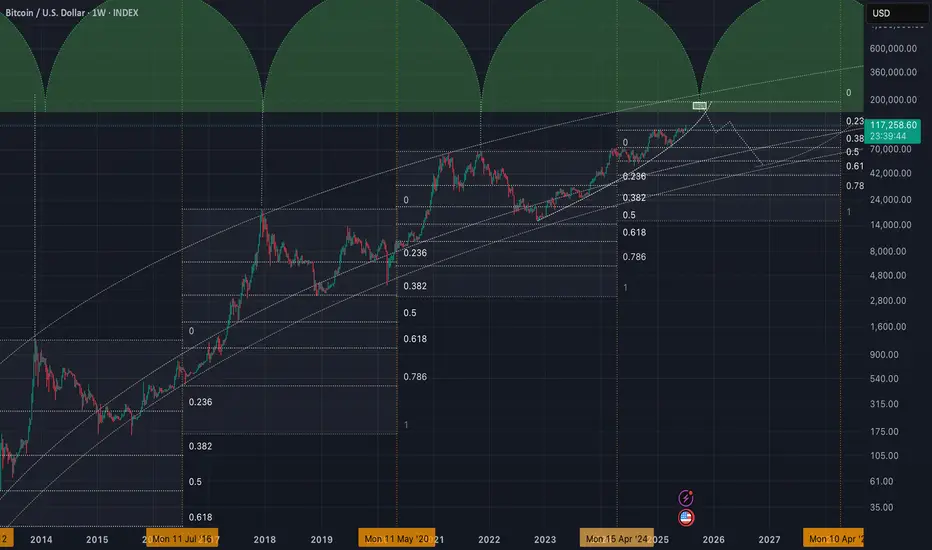
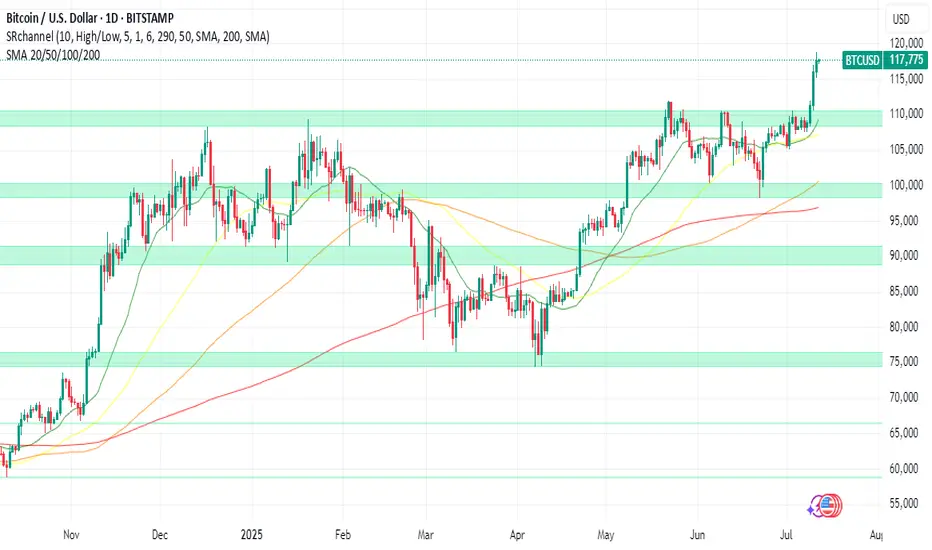
Close to 200k is doable for this cycle!I don't like to bet on targets, I prefer taking profits around October 2025 as I mentioned multiple times. But this idea about topping around 194k is doable according to fib levels. Either way I am going to step out around October no matter the price, even if its bellow 100k.
Bitcoin - Blue Skies, Retest Before $125k?Bitcoin has pushed into blue skies after breaking through a major resistance zone around 110,000 USD. The breakout was sharp and impulsive, pushing price well into uncharted territory above 117,000. At these levels, traditional resistance becomes harder to pinpoint, and the market often behaves irrationally, so caution is warranted. With all-time highs being challenged, any small retracement must be handled with precision.
Support and Retest Zones
The previous resistance zone between 109,000 and 111,000 has now turned into a potential support area. This level acted as a ceiling for weeks and was finally broken with strong momentum. Price already had a minor retest on the breakout candle, which offers a bullish sign of acceptance. However, a deeper retest of this same zone remains a valid possibility, especially if short-term profit-taking intensifies.
Trendline Confluence
Alongside the horizontal support, we have an ascending trendline that has guided price from the June lows. This trendline now intersects with the 111,000–113,000 area, offering a secondary potential bounce level. If Bitcoin holds the trendline, a shallower correction could be enough to reset before another rally. But if we break below it, the horizontal support remains the final stronghold before deeper downside risks emerge.
Short-Term Scenarios
There are two likely short-term paths here. Either Bitcoin continues higher without a deep pullback, targeting 120,000–125,000 directly, or we see one more sweep into the 111,000 area before the trend resumes. The first scenario would trap sidelined traders, forcing late entries at higher levels. The second would provide a clean retest of structure, fueling a healthier, more sustainable breakout.
Price Target and Expectations
Assuming the retest scenario plays out cleanly and price confirms support at either the trendline or the former resistance zone, upside targets sit around 120,000 as the next psychological barrier, with 125,000 as a likely extension. These are natural magnet levels in a trending environment, especially with momentum still intact from the previous breakout.
Conclusion
Bitcoin is currently in price discovery, which means the structure must guide our expectations. A retest of either the trendline or former resistance could provide the next best entry. As long as we hold above the green support zone, the bullish structure remains intact, and higher targets remain in sight.
Disclosure: I am part of Trade Nation's Influencer program and receive a monthly fee for using their TradingView charts in my analysis.
___________________________________
Thanks for your support!
If you found this idea helpful or learned something new, drop a like 👍 and leave a comment, I’d love to hear your thoughts! 🚀

#BTCUSDT(BITCOIN): Two Targets First $130,000 And Then $150,000Bitcoin is poised for significant distribution, with a potential price surge to $130,000, followed by a swing target of $150,000. The current accumulation phase is poised to transition into a substantial bullish move. We anticipate a surge in bullish volume in the coming days or weeks. Our analysis anticipates this transition to be completed by the end of the year or sooner.
It is important to note that this analysis does not guarantee a specific price movement and is provided solely for educational purposes.
We extend our best wishes for your successful trading endeavours. If our analysis has been of assistance, we would appreciate it if you could express your gratitude by liking and commenting.
For further insights, please follow our account.
Team Setupsfx_
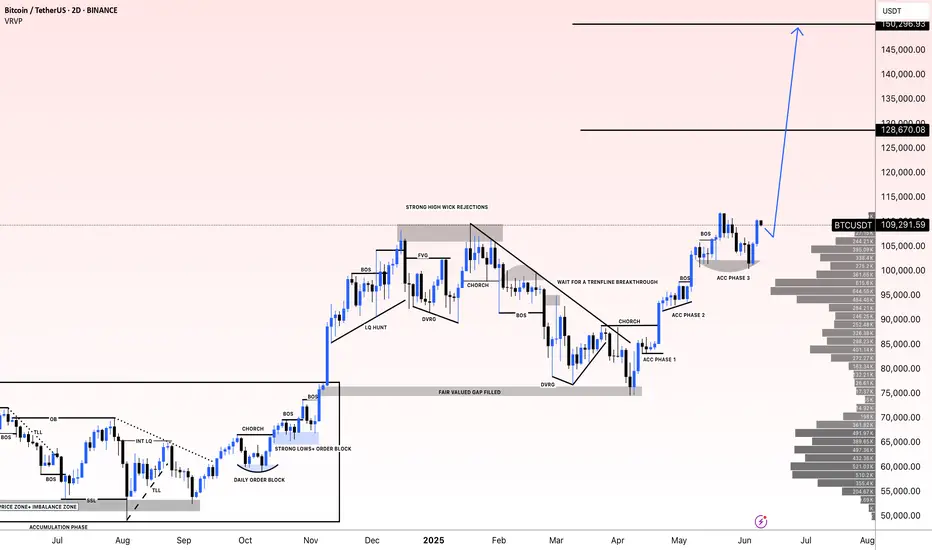
#BITCOIN: Accumulated Volume, Time For $150,000Bitcoin has accumulated nicely, but we don’t expect the price to distribute strongly towards $150k. We have set two targets: 125k and a swing target at 150k. Remember to have a confirmation before entering.
Good luck and trade safely,
Team Setupsfx_

Prepare for the 2025 Crypto Summer as Bitcoin Shatters RecordBitcoin Experiences Impact of a $12B Short Squeeze: Here is How to Prepare for Imminent Crypto Summer
July 12, 2025 - The digital asset landscape has been irrevocably altered. In a move that will be etched into financial history, Bitcoin has shattered its previous all-time highs, surging with a ferocity that has left bears in utter ruin and bulls in a state of euphoric disbelief. After decisively breaking the formidable $109,000 barrier, the world’s premier cryptocurrency rocketed past $118,000, liquidating an estimated $12 billion in leveraged short positions in a cascade of forced buy-ins that added jet fuel to an already roaring fire.
This is not just another bull run. This is the manifestation of a market that has fundamentally matured. The "Crypto Summer" of 2025, long whispered about in investor circles, has arrived, and it is being majorly fueled by an unprecedented influx of institutional capital and a newly established clear regulatory outlook. While the price charts paint a picture of blistering gains, the underlying story is one of a structural shift in the global financial order.
For those who have watched from the sidelines, the question is no longer if they should pay attention, but how they can possibly prepare for the seismic shifts to come. This article will dissect the anatomy of this historic market event, explore the powerful forces driving this new paradigm, and offer a guide to navigating the thrilling, albeit treacherous, terrain of the 2025 Crypto Summer.
Part 1: The Anatomy of a $12 Billion Cataclysm
To comprehend the sheer violence of Bitcoin's recent ascent, one must first understand the market dynamics that preceded it. A short squeeze is a market phenomenon that occurs when a heavily shorted asset experiences a rapid price increase. This forces traders who bet on a price drop (short sellers) to buy back the asset to cover their positions and cut their losses. This sudden surge in buying demand creates a feedback loop, pushing the price even higher and liquidating more short positions along the way.
In the weeks leading up to the breakout, a palpable sense of bearishness had settled among many derivative traders. They saw the price range between $100,000 and $110,000 as a formidable distribution zone—a ceiling where bulls would run out of steam. Emboldened by this conviction, they began to build massive short positions. It's estimated that prior to Bitcoin’s bullish breakout above $109k, short traders had accumulated around $12B in leveraged positions, with many of these bets entered around the $118k level, anticipating a strong rejection from that point.
The trap was set. But it was the bears, not the bulls, who were about to be caught.
The initial catalyst was the clean break above the $109,000 resistance. This was followed by a swift move above a key bearish trend line that had formed on shorter timeframes, with resistance at $111,000. As the price then confidently reclaimed the $112,500 zone and began trading above the 100-hourly Simple Moving Average, the first wave of liquidations began.
What followed was a textbook short squeeze of epic proportions. As automated margin calls were triggered, computer algorithms began to market-buy Bitcoin at any price to close the losing short positions. This forced buying pressure propelled BTC through $113,000, then $114,000, and $115,000 in what felt like mere moments. The higher the price went, the more short sellers were forced to capitulate. The $12 billion in leveraged positions, once a wall of sell-side pressure, became a colossal wave of buy-side demand. The price action culminated in a spectacular surge past $116,000 and eventually screaming past $118,800, leaving market commentators and traders alike breathless. This event was a brutal lesson in the inherent risks of shorting a structurally bullish asset in a high-leverage environment.
Part 2: A New Paradigm: Institutional Capital and Regulatory Clarity
While the short squeeze provided the explosive catalyst, the true engine of this bull market is fundamentally different from those of the past. The frenzied, retail-driven manias of 2017 and 2021 have been replaced by a more deliberate, capital-heavy, and institutionally-led advance. The "Crypto Summer" of 2025 is built on the bedrock of legitimacy that only Wall Street and a clear regulatory stance could provide.
The ETF Revolution Matures
The launch of spot Bitcoin ETFs in early 2024 was a watershed moment, but 2025 is the year their impact has become undeniably dominant. These regulated financial products have provided a secure and familiar bridge for institutional investors, hedge funds, and even sovereign wealth funds to gain exposure to Bitcoin. The results have been staggering. In a clear sign of a changing of the guard in the world of alternative assets, spot Bitcoin ETFs have captured an astonishing 70% of gold’s inflows in 2025.
This statistic is more than just a headline; it represents the tangible manifestation of the "digital gold" narrative. For years, proponents have argued that Bitcoin's provable scarcity and decentralized nature make it a superior store of value to the yellow metal. Now, the flow of funds from the world's largest asset managers is proving this thesis correct. BlackRock’s IBIT, in particular, has shattered ETF records, becoming one of the fastest-growing funds in history and signaling to the entire financial establishment that Bitcoin is no longer a fringe asset but a core portfolio component.
The Certainty of Regulation
For years, the spectre of regulatory uncertainty has cast a long shadow over the crypto markets, deterring conservative institutional players. A key driver of the 2025 bull market has been the emergence of a clear regulatory outlook in major jurisdictions like the United States and Europe. With comprehensive market structure bills passed, clear guidelines on custody, and a defined tax framework, the biggest obstacle for institutional adoption has been removed.
This regulatory clarity has done more than just open the floodgates for capital; it has legitimized the entire asset class. Institutions operate on long-term horizons and require predictable rules of engagement. With these in place, they are no longer making a speculative bet but a strategic allocation to a new, globally recognized asset class. This influx of what is often called "stickier" capital—long-term investment rather than short-term speculation—is helping to build a more stable market foundation and reduce some of the notorious volatility associated with Bitcoin.
Part 3: Reading the Charts and Chains
The story of this bull run is written not only in the headlines but also in the data. A confluence of technical chart patterns, on-chain analytics, and market sentiment indicators paints a uniquely bullish picture, suggesting that this rally may have much further to run.
Technical Analysis: Echoes of the Past, Pointers to the Future
For seasoned market observers, the BTC price action in 2025 has mirrored the 2017 macro bullish breakout. The fractal nature of Bitcoin's four-year cycles, often centered around its programmatic "halving" events, appears to be playing out once again. The structure of the consolidation below $100,000 and the subsequent explosive breakout bears a striking resemblance to the patterns that preceded the parabolic run to $20,000 in 2017.
On a more granular level, the price has decisively conquered several key technical levels. The break above the bearish trend line at $111,000 was a critical signal that the downtrend pressure had been absorbed. Now, with the price trading firmly above $113,500 and the 100-hourly Simple Moving Average, these former resistance zones are expected to act as strong support levels for any potential pullbacks. The next major hurdle appears to be the $116,800 resistance zone, a level that, if cleared, could open the door to a much larger upward expansion.
Perhaps the most tantalizing model for predicting the cycle top is the Bitcoin "power law" model. This model suggests that Bitcoin's price growth over time follows a predictable exponential path when plotted on a logarithmic scale. Developed by analyst Giovanni Santostasi, the model views Bitcoin's long-term growth not as a random walk but as a structured, measurable trajectory akin to natural growth phenomena. According to analysts applying this model, Bitcoin is currently trading ahead of its long-term power law curve. Historically, this has been a sign that the market is entering the final, euphoric phase of its bull cycle. Based on this model, some analysts believe a Bitcoin Christmas rally to $200K or even $300K is possible, with the parabolic rally potentially lasting until the end of the year.
On-Chain Analysis: A Supply Shock in the Making
On-chain analysis, which involves examining data directly from the blockchain, provides a transparent view of investor behavior. One of the most encouraging signs for this rally is that Bitcoin Supply On Exchanges Remain Low Amid Latest Milestone. When investors move their BTC off exchanges, it is typically to place them in secure, self-custody wallets for long-term holding. This reduces the immediately available supply that can be sold on the market, creating a "supply shock" dynamic where even a small increase in demand can have an outsized impact on price. The current trend indicates that new institutional buyers and long-term believers are accumulating coins and have no intention of selling at current prices.
Further bolstering the bullish case is the metric of profitability. The market has reached a point where Bitcoin has broken records with 100% profitable days and unmatched returns. This means that for a vast majority of its history, buying and holding Bitcoin has been a profitable endeavor, reinforcing its narrative as one of an incredibly successful long-term asset.
However, a note of caution comes from on-chain analytics firm Glassnode, which warns that despite the breakout to over $118,000, liquidity is still thin. This means the order books on exchanges are not particularly deep. While this can amplify moves to the upside, it also means that a large sell order could cause a sharp and swift correction. This thin liquidity explains the continued volatility and serves as a reminder that the market, while more mature, is still susceptible to violent price swings.
Sentiment Analysis: A Rally Without the Mania
Perhaps the most compelling argument for further upside potential is what is absent from this rally: hype. In previous cycle tops, the market was characterized by a palpable mania. Bitcoin dominated mainstream news, celebrity endorsements were rampant, and stories of overnight crypto millionaires were inescapable.
This time is different. In a sign that suggests significant further upside potential, the current Bitcoin All-Time High Lacks Hype. Google Trends for "Bitcoin" are not at their peak, social media is not yet in a state of collective FOMO (Fear Of Missing Out), and the general public is not yet clamoring to get in. This suggests that the rally so far has been driven by the "smart money" of institutions. The retail-driven "mania phase," which typically marks the final blow-off top of a bull cycle, has not yet begun. This quiet confidence, devoid of irrational exuberance, is seen by many analysts as one of the healthiest indicators for the market's future.
Part 4: The Macroeconomic Tailwinds
A key factor is the falling dollar and anticipated Federal Reserve interest rate cuts. The US Dollar Index (DXY), which measures the greenback against a basket of foreign currencies, has been in a significant downtrend throughout 2025, hitting its lowest levels in over two decades relative to its moving averages. There is a historically strong inverse correlation between the DXY and Bitcoin; a weaker dollar makes assets priced in dollars, like BTC, more attractive to foreign investors and also pushes domestic investors to seek hedges against currency debasement.
Furthermore, the anticipation of interest rate cuts by the Federal Reserve to stimulate a slowing economy makes holding cash and low-yielding government bonds less attractive. This monetary policy shift encourages a "risk-on" environment, where capital flows out of safe-haven assets and into those with higher growth potential. As the ultimate digital risk-on asset, Bitcoin stands as a major beneficiary of this capital rotation.
The magnitude of this rally has also had fascinating side effects, such as the fact that the Bitcoin Surge Pushes Satoshi Nakamoto Into Global Top 15 Rich List. Based on the estimated 1.1 million BTC held by Bitcoin's pseudonymous creator, the recent price surge would place their net worth among the wealthiest individuals on the planet—a testament to the incredible value creation of this new technology.
Part 5: How to Prepare for the Imminent Crypto Summer
With a potential parabolic rally to $200,000 or $300,000 on the horizon, the central question for every investor is how to position themselves. The answer depends heavily on one's experience and risk tolerance. (This section is for informational purposes and should not be construed as financial advice).
For the Newcomer:
1. Education Before Allocation: Before investing a single dollar, take the time to understand what Bitcoin is. Learn about its core principles of decentralization, scarcity, and self-custody. Do not simply buy based on FOMO.
2. Dollar-Cost Averaging (DCA): Entering a market that is already in a parabolic uptrend can be risky. DCA involves investing a fixed amount of money at regular intervals, regardless of the price. This strategy reduces the risk of buying the top and smooths out your average entry price over time.
3. ETFs vs. Self-Custody: For the first time, investors have a simple choice. Buying a spot Bitcoin ETF through a traditional brokerage account is easy and secure. However, the core ethos of Bitcoin is self-sovereignty ("not your keys, not your coins"). Learning to use a hardware wallet to take self-custody of your coins is the ultimate way to embrace the technology, but it comes with greater personal responsibility.
For the Experienced Investor:
1. Prudent Risk Management: The warning of thin liquidity should be heeded. Volatility will remain high. Use stop-losses to protect capital, avoid excessive leverage, and do not get caught up in the euphoria. Have a clear plan for both entry and exit points.
2. Develop a Profit-Taking Strategy: No asset goes up forever. It is crucial to have a plan for taking profits. This could involve selling a certain percentage of your holdings at pre-determined price targets (e.g., $150k, $200k, $250k) or using technical indicators to signal a potential market top.
3. Look Beyond Bitcoin: Historically, a major Bitcoin rally paves the way for a subsequent "alt-season." As Bitcoin's dominance peaks, capital often rotates into Ethereum and other alternative cryptocurrencies with strong fundamentals, leading to explosive gains in those assets. Researching promising projects now could position you for the next phase of the crypto summer.
Finally, it is essential to address the question: Breakout Or Brutal Bull Trap? While all signs point to a sustained, institutionally-backed bull market, the risk of sharp corrections remains. Parabolic advances are often followed by equally dramatic pullbacks. The thin liquidity could exacerbate such a move. Staying grounded, managing risk, and sticking to a well-defined plan are the keys to surviving and thriving.
Conclusion
The Bitcoin story of 2025 is a symphony of powerful forces playing in perfect harmony. The violent crescendo of a $12 billion short squeeze announced its arrival, but the enduring melody is one of profound structural change. The unwavering commitment of institutional capital, flowing through newly approved and highly successful ETFs, has provided a stable and deep foundation for the market. This, combined with a clear regulatory framework and supportive macroeconomic tailwinds from a weakening dollar, has created the conditions for a historic "Crypto Summer."
Unlike the retail-driven manias of the past, this rally is characterized by a quiet confidence, a lack of widespread hype, and on-chain data that points to a severe supply shock. Models like the power law suggest that the journey is far from over, with potential targets that would have seemed fantastical just a year ago.
The road ahead will undoubtedly be volatile. But for those who understand the underlying dynamics at play—the institutional shift, the market structure, the on-chain truths—the path to navigating this new era is clear. The summer has just begun.
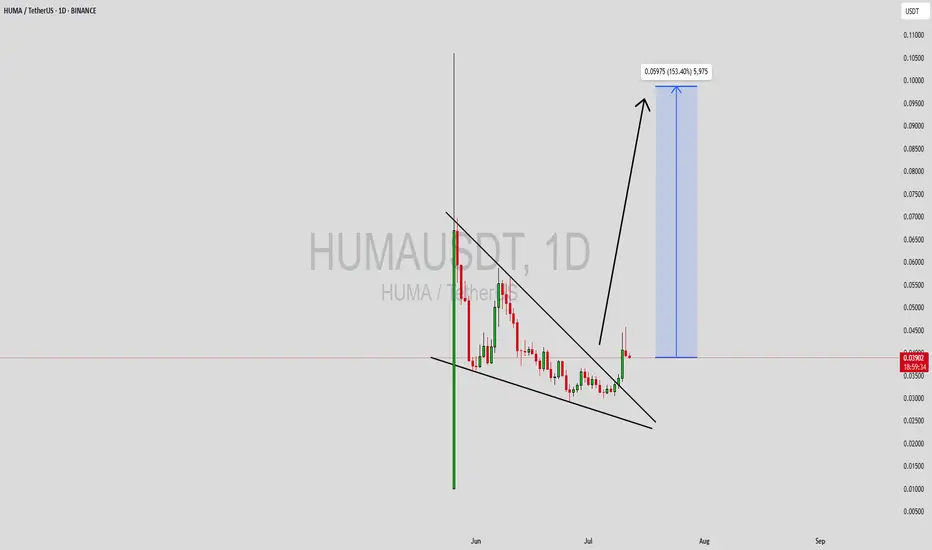
HUMAUSDT Forming Falling WedgeHUMAUSDT is displaying a promising falling wedge pattern, which is widely recognized by traders as a powerful bullish reversal setup. This pattern suggests that the coin may be nearing the end of its consolidation phase, setting the stage for a potential breakout with significant upside. Backed by good trading volume, this scenario looks increasingly likely, with price targets pointing to an impressive gain potential of 140% to 150% in the medium term.
The Huma project is steadily gaining traction among crypto investors due to its innovative use cases and expanding community. As the DeFi ecosystem evolves, projects like Huma that focus on human-centric decentralized solutions are getting more recognition. With growing investor confidence, HUMAUSDT could become one of the standout performers in the altcoin market, especially if the current technical structure plays out as expected.
From a technical perspective, the falling wedge pattern is characterized by descending resistance and support lines converging towards a breakout point. When price finally breaches the upper trendline with convincing volume, it often sparks a rapid upward move as short positions get squeezed and new buyers jump in. Traders should watch for a daily close above resistance and monitor volume levels to validate the breakout.
✅ Show your support by hitting the like button and
✅ Leaving a comment below! (What is You opinion about this Coin)
Your feedback and engagement keep me inspired to share more insightful market analysis with you!
Cycle time tool sugesting topping prices around October 2025 As expected in previous analysis this idea support my thesis for topping close to October. i will be unloading soon to buy back around November 2026. Cheers!