Bitcoin Crash To $93k Incoming?!!!!I am discussing the bearish signs i am seeing right now on Bitcoin, and talking about the confirmations I want to see, that will confirm that Bitcoin is about to crash down to 93k!!!
Bitcoinprediction

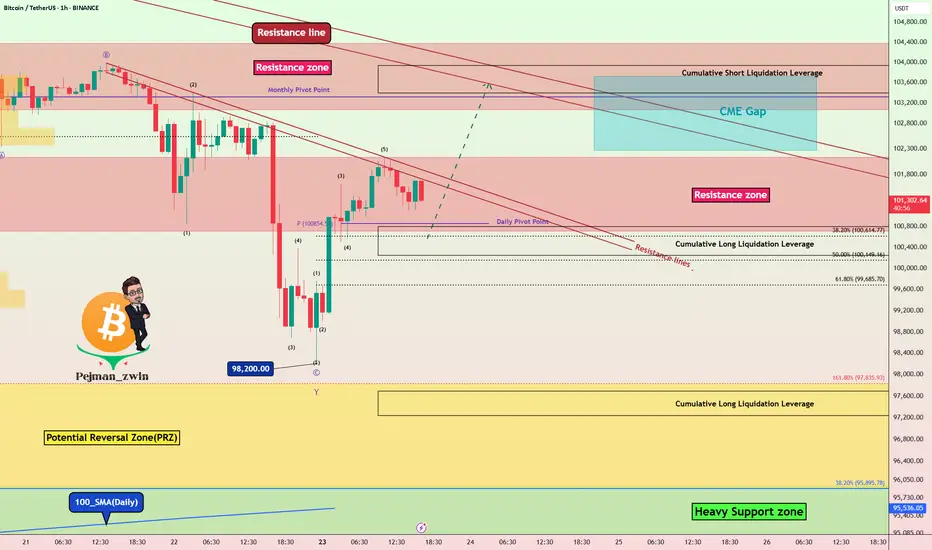
Bitcoin Breakout Incoming? Flash PMI & CME Gap in FocusBitcoin ( BINANCE:BTCUSDT ) started to fall ( about -4%) after the news that the US was involved in the Middle East tension , but it has risen again with good momentum .
Do you think Bitcoin will go below the previous bottom($98,200) again on the 1-hour time frame?
Bitcoin is trading in the Resistance zonezone($102,130-$100,700) and near the Resistance lines .
In terms of Elliott Wave theory , it appears that a Double Three Correction(WXY) has been completed near the Potential Reversal Zone(PRZ) . Also, the first 5 microwaves of the Impulsive have now been completed .
---------------------------------
Bitcoin traders should monitor today’s Flash Manufacturing (expected 51.1) and Services PMI (expected 52.9) . Both forecasts are already lower than last month’s figures (51.3 and 54.8) , but I see a chance they come in even weaker.
Why weaker PMI is likely?
Slowing retail sales and softer labor data point to reduced consumer demand.
High interest rates are starting to pressure both the production and services sectors.
Regional Fed surveys already showed a cooling in business activity.
If the PMI prints below expectations, the market may anticipate a more dovish Fed, pushing the dollar( TVC:DXY ) down and giving Bitcoin a potential bullish boost.
---------------------------------
I expect Bitcoin to move towards filling the CME Gap($103,730-$102,275) after breaking the Resistance lines , and if the Resistance zone($104,380-$103,060) is broken, we should expect further increases.
Cumulative Short Liquidation Leverage: $103,391-$103,934
Cumulative Long Liquidation Leverage: $100,800-$100,250
Cumulative Long Liquidation Leverage: $97,691-$97,241
Note: Increased tensions in the Middle East or new and important news surrounding this news can make the analysis invalid, so be more careful with capital management.
Note: If Bitcoin can touch $98,170 , we can expect more dumps.
Please respect each other's ideas and express them politely if you agree or disagree.
Bitcoin Analyze (BTCUSDT), 1-hour time frame.
Be sure to follow the updated ideas.
Do not forget to put a Stop loss for your positions (For every position you want to open).
Please follow your strategy and updates; this is just my Idea, and I will gladly see your ideas in this post.
Please do not forget the ✅' like '✅ button 🙏😊 & Share it with your friends; thanks, and Trade safe.
₿itcoin: PullbackBitcoin has experienced significant selling since Friday, briefly slipping below the $100,000 mark. We previously mentioned that a sharper pullback wouldn't surprise us. Whether prices will drop a bit further remains to be seen for the moment. Ultimately, we still expect Bitcoin to climb into the upper blue Target Zone (coordinates: $117,553 – $130,891) before a broader C-wave sell-off occurs, pushing the price down to the lower blue Target Zone (coordinates: $62,395 – $51,323). There, we anticipate the low of the larger orange wave a, which should mark the start of another corrective upward move. Afterward, we're preparing for the last downward leg of blue wave (ii). However, if Bitcoin directly surpasses the resistance at $130,891 – and thus our upper blue Target Zone – we'll locate it still in blue wave alt.(i) (30% probability).
📈 Over 190 precise analyses, clear entry points, and defined Target Zones - that's what we do.

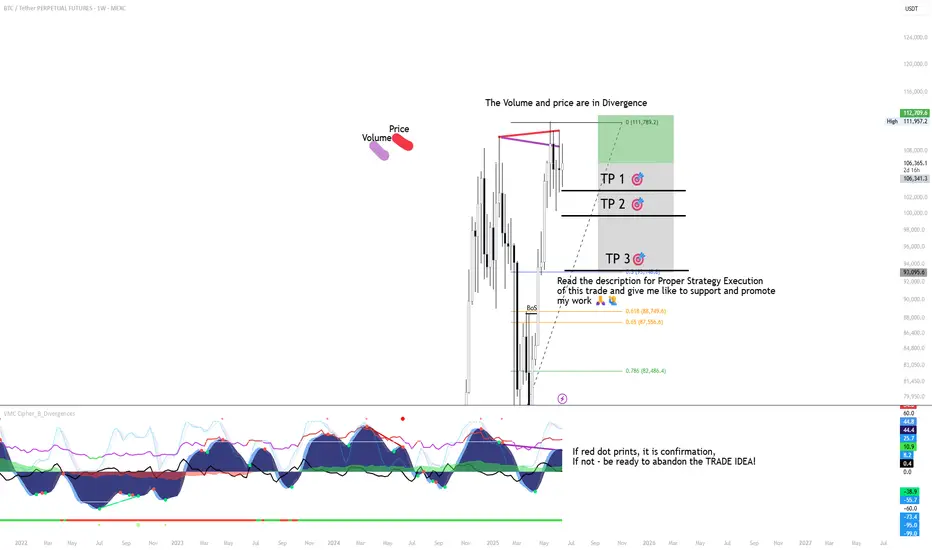
BTC MACRO PLAY - SHORT TRADE SETUP📉 BTC/USDT SHORT TRADE SETUP – WEEKLY TIMEFRAME
🔍 Trade Idea Overview:
We are seeing a bearish divergence between price and volume on the weekly chart — while price makes higher highs, volume is decreasing, signaling a potential reversal or weakening trend.
Further confluence is seen with the VMC Cipher indicator. If a red dot prints, it will confirm the short entry. If not, the trade idea should be abandoned.
📊 Trade Plan:
Entry Zone: Around $106,300–$107,000 (wait for confirmation)
TP 1 🎯: $102,000
TP 2 🎯: $97,500
TP 3 🎯: $93,000
🛑 Risk Management:
Stop-Loss: Above recent highs at $111,800 (or adjusted based on your entry)
⚠️ Disclaimer:
Once TP 1 is reached, move stop-loss to breakeven to protect capital and eliminate risk.
TP 3 may never be reached, but it remains part of the plan to capture extended downside if momentum continues.
If no red dot prints, there is no confirmation — be ready to abandon the trade.
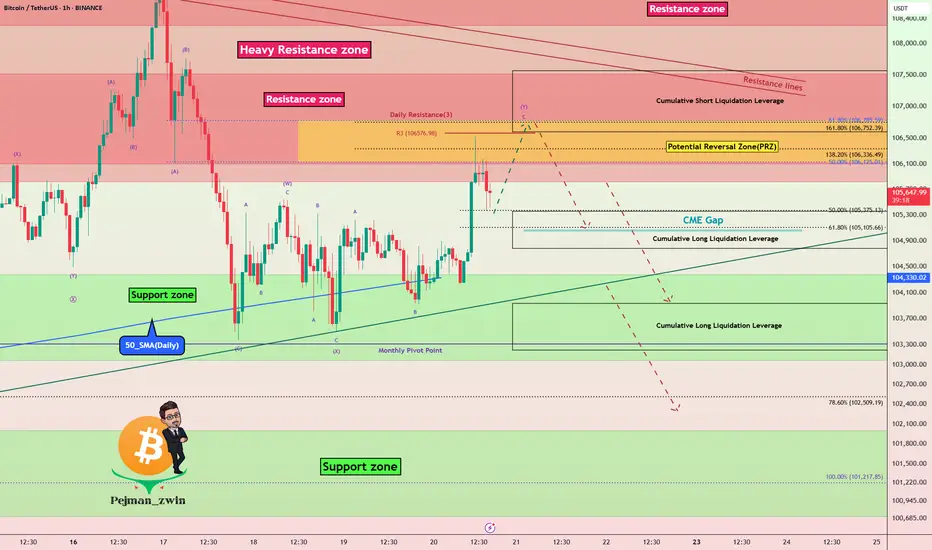
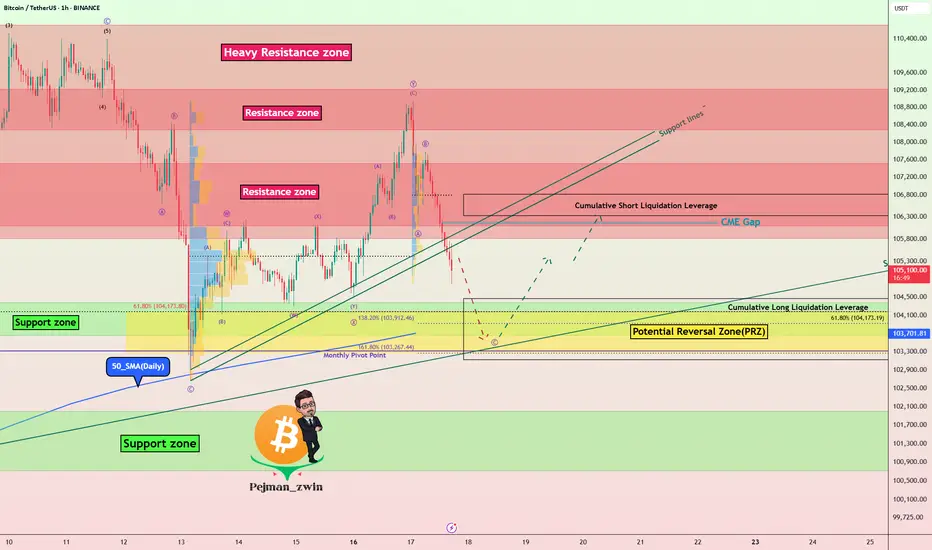
Bitcoin Hits PRZ — Is This the Perfect Short Entry?Bitcoin ( BINANCE:BTCUSDT ) has entered the Potential Reversal Zone (PRZ) after a strong bullish impulse , testing the confluence of Daily Resistance(3) .
In terms of Elliott Wave analysis , the market seems to have completed a complex WXY corrective structure , with the recent rally likely representing the final wave Y . This makes the current zone highly reactive for potential reversal .
I expect Bitcoin to retrace toward the CME Gap($105,075-$105,055) and possibly continue downward toward the Support zone($104,380-$103,060) and Cumulative Long Liquidation levels if the sellers regain momentum .
Cumulative Short Liquidation Leverage: $107,568-$106,601
Cumulative Long Liquidation Leverage: $105,360-$104,784
Cumulative Long Liquidation Leverage: $103,937-$103,217
Note: It is better to look for short positions at the Potential Reversal Zone (PRZ) or if Bitcoin touches $104,780 before reaching PRZ. That is why I chose to label this analysis as ''Short".
Note: If Bitcoin can touch $107,620 , there is a possibility of breaking the resistance lines and increasing further.
Please respect each other's ideas and express them politely if you agree or disagree.
Bitcoin Analyze (BTCUSDT), 1-hour time frame.
Be sure to follow the updated ideas.
Do not forget to put a Stop loss for your positions (For every position you want to open).
Please follow your strategy and updates; this is just my Idea, and I will gladly see your ideas in this post.
Please do not forget the ✅' like '✅ button 🙏😊 & Share it with your friends; thanks, and Trade safe.
Bitcoin will go to it's next arc for sure around 170K!Btc will gravitate to the next arc After this consolidation!

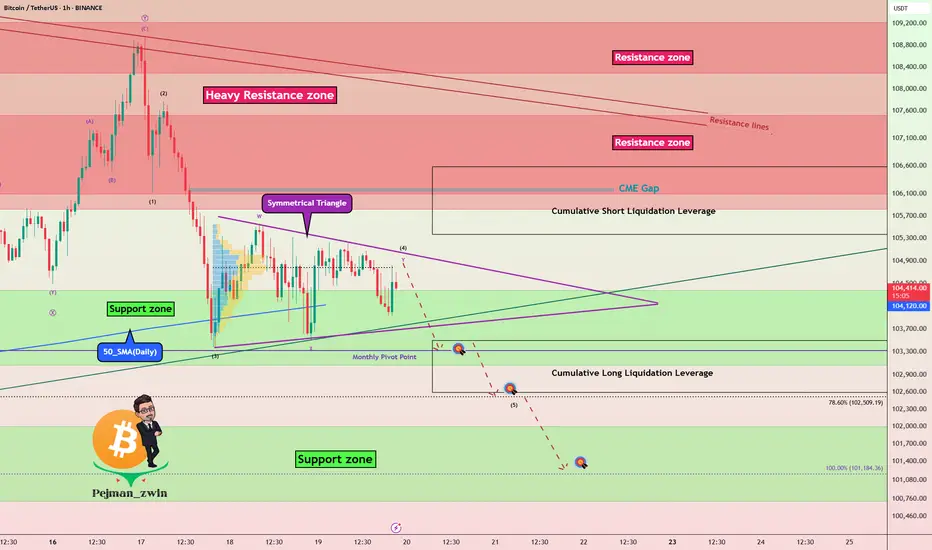
BTC - Key Battle Between Bulls and Bears – Symmetrical TriangleBitcoin ( BINANCE:BTCUSDT ) is currently consolidating within a Symmetrical Triangle , showing indecision among Bulls and Bears around the Support zone($104,380-$103,060) and just above the 50_SMA (Daily) .
From an Elliott Wave perspective, the current range may represent a WXY corrective structure . The market seems to be waiting for a breakout direction , potentially aiming to complete wave 5 after this correction.
The Monthly Pivot Point($103,300) and the presence of significant Cumulative Liquidation Leverage Zones (both Long and Short ) are key liquidity magnets to watch in the short term .
I expect Bitcoin to re-attack the Support zone($104,380-$103,060) AFTER breaking the lower line of the Symmetrical Triangle Pattern and decline to the targets I have outlined on the chart.
Note: Stop Loss: $106,703 = Worst Stop Loss(SL)
Please respect each other's ideas and express them politely if you agree or disagree.
Bitcoin Analyze (BTCUSDT), 1-hour time frame.
Be sure to follow the updated ideas.
Do not forget to put a Stop loss for your positions (For every position you want to open).
Please follow your strategy and updates; this is just my Idea, and I will gladly see your ideas in this post.
Please do not forget the ✅' like '✅ button 🙏😊 & Share it with your friends; thanks, and Trade safe.
BTC is squeezing between descending resistance.📊 BTC/USDT – 1H Chart Analysis: The Calm Before the Storm?
Bitcoin is currently coiling within a symmetrical triangle on the 1-hour chart – a technical pattern that often signals a strong breakout is just around the corner. The market is compressing, and momentum is building.
🔍 Key Levels to Watch:
🔹 Symmetrical Triangle:
BTC is squeezing between descending resistance and ascending support. This equilibrium usually doesn’t last long – expect a sharp move soon.
🔹 Demand Zone ($$$ / BPR):
A solid floor is forming near the BPR (Bullish Price Range), signaling potential buyer interest and liquidity resting just below.
🔹 Fair Value Gap (FVG):
To the upside, BTC is facing a liquidity pocket (FVG) that could act as a magnet if bulls take control.
⚡ Potential Scenarios:
📈 Bullish Breakout: A break and close above the triangle could trigger a rally towards the $105K–$106K zone. Watch for volume to confirm!
📉 Bearish Breakdown: Losing the lower trendline support might send BTC into a deeper correction toward previous demand zones.
🧠 Final Thoughts:
We're approaching a critical inflection point. The triangle is narrowing, and Wednesday, June 25 could be the date the market decides. Both bulls and bears should prepare for volatility.
🚨 As always: This is not financial advice.
🧠 DYOR – Do Your Own Research.
Manage risk. Trade smart. Stay sharp. 💹

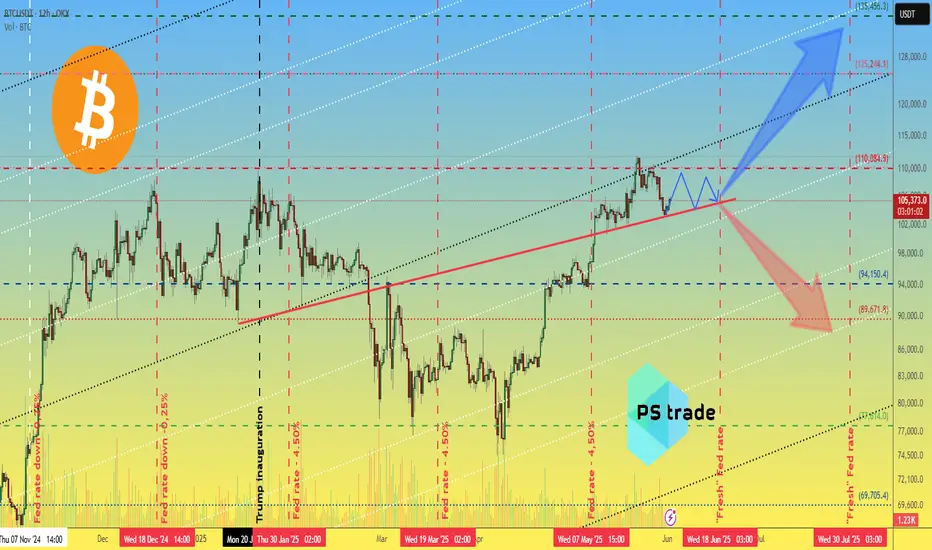
BITCOIN, trend outlook for this summerWhile the fundamentals are still very complicated on the stock market at present, with the FED intransigent, trade war/diplomacy (deadline set for July 9 to reach trade agreements) and extreme geopolitical tensions, can the bitcoin price withstand all these challenges and continue its annual bull run over the summer? Let's take a look at a number of elements, including a major technical risk and two factors that are, on the contrary, favorable to a new record this summer.
1) Bitcoin's bullish cycle linked to the spring 2024 halving is still long
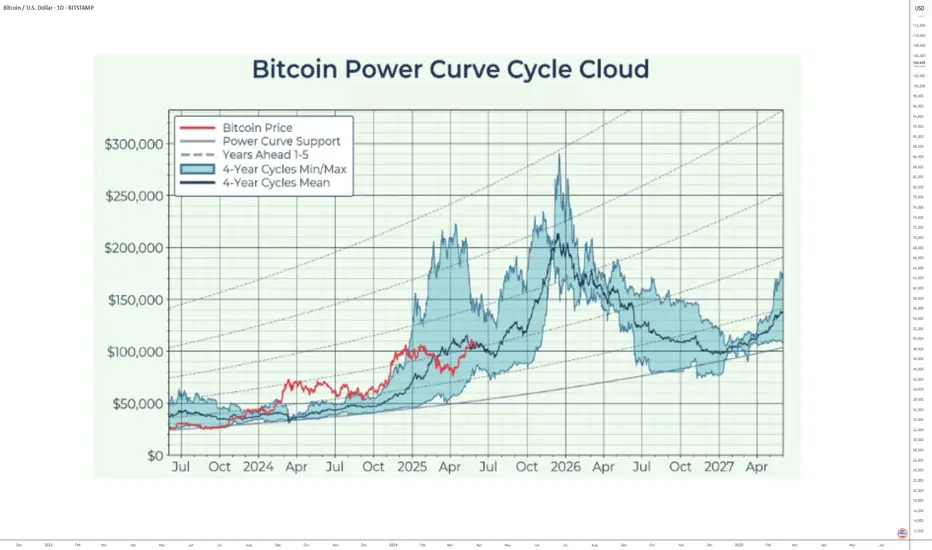
Let's start with the cyclical aspect of bitcoin, the famous 4-year cycle built around the quadrennial halving. The last halving took place in April 2024, and if the cycle repetition works again, then the current cycle is due to end at the end of 2025. So there's still time for bitcoin to set a new record, even if it comes under short-term pressure - it still has 5 months to go.
The first chart below summarizes the 4-year cycle by averaging the time and price of all previous cycles since 2009. Our current cycle is represented by the red curve, and in terms of probability, the end of the cycle is expected between October and December 2025.
There's still time, and this is the first major piece of information in our article.
2) A bearish technical divergence in weekly data calls for great caution
On the other hand, technical analysis of the bitcoin price in weekly data gives a warning signal with the presence of a bearish price/momentum divergence, market momentum being represented here by the RSI technical indicator.
This bearish divergence resembles that at the end of the previous cycle in November 2021, but the comparison stops here. At that time, all end-of-cycle models were on alert, but this is not the case today. Nevertheless, we must be aware that this bearish divergence could be a pressure factor this summer.
3) Global liquidity as represented by the M2 monetary aggregate gives grounds for optimism about bitcoin's summer trend
Global M2 deploys a strong positive correlation with the bitcoin price, and it takes an average of 12 weeks for this liquidity to act on BTC. This monetary aggregate measures the sum of the money supply (M2) of the major economies - USA, China, Eurozone - converted into US dollars. It includes sight deposits, savings accounts and certain short-term instruments, representing the gross liquidity immediately available in the global economy.
This level of liquidity is directly influenced by monetary (key rates, QE/QT), fiscal and wage policies. The evolution of the US dollar plays a crucial role: a strong dollar mechanically reduces global M2 in USD, while a weak dollar increases it. In this respect, Chinese and US dynamics are often divergent, as they are driven by different credit logics (centralized planning on the Chinese side, rate-based adjustment on the US side).
Since the beginning of April, Bitcoin has been on a marked uptrend. This progression, which we have followed step by step, raises an essential question: can this momentum be maintained this summer, despite the fundamental challenges of the moment?
Such a hypothesis is plausible, provided that a key - and often underestimated - driver continues to act: the unprecedented increase in global liquidity, as measured by the M2 monetary aggregate. According to the latest available data, global M2 has set a new all-time record, and this is a factor supporting the BTC trend for the first part of the summer.
DISCLAIMER:
This content is intended for individuals who are familiar with financial markets and instruments and is for information purposes only. The presented idea (including market commentary, market data and observations) is not a work product of any research department of Swissquote or its affiliates. This material is intended to highlight market action and does not constitute investment, legal or tax advice. If you are a retail investor or lack experience in trading complex financial products, it is advisable to seek professional advice from licensed advisor before making any financial decisions.
This content is not intended to manipulate the market or encourage any specific financial behavior.
Swissquote makes no representation or warranty as to the quality, completeness, accuracy, comprehensiveness or non-infringement of such content. The views expressed are those of the consultant and are provided for educational purposes only. Any information provided relating to a product or market should not be construed as recommending an investment strategy or transaction. Past performance is not a guarantee of future results.
Swissquote and its employees and representatives shall in no event be held liable for any damages or losses arising directly or indirectly from decisions made on the basis of this content.
The use of any third-party brands or trademarks is for information only and does not imply endorsement by Swissquote, or that the trademark owner has authorised Swissquote to promote its products or services.
Swissquote is the marketing brand for the activities of Swissquote Bank Ltd (Switzerland) regulated by FINMA, Swissquote Capital Markets Limited regulated by CySEC (Cyprus), Swissquote Bank Europe SA (Luxembourg) regulated by the CSSF, Swissquote Ltd (UK) regulated by the FCA, Swissquote Financial Services (Malta) Ltd regulated by the Malta Financial Services Authority, Swissquote MEA Ltd. (UAE) regulated by the Dubai Financial Services Authority, Swissquote Pte Ltd (Singapore) regulated by the Monetary Authority of Singapore, Swissquote Asia Limited (Hong Kong) licensed by the Hong Kong Securities and Futures Commission (SFC) and Swissquote South Africa (Pty) Ltd supervised by the FSCA.
Products and services of Swissquote are only intended for those permitted to receive them under local law.
All investments carry a degree of risk. The risk of loss in trading or holding financial instruments can be substantial. The value of financial instruments, including but not limited to stocks, bonds, cryptocurrencies, and other assets, can fluctuate both upwards and downwards. There is a significant risk of financial loss when buying, selling, holding, staking, or investing in these instruments. SQBE makes no recommendations regarding any specific investment, transaction, or the use of any particular investment strategy.
CFDs are complex instruments and come with a high risk of losing money rapidly due to leverage. The vast majority of retail client accounts suffer capital losses when trading in CFDs. You should consider whether you understand how CFDs work and whether you can afford to take the high risk of losing your money.
Digital Assets are unregulated in most countries and consumer protection rules may not apply. As highly volatile speculative investments, Digital Assets are not suitable for investors without a high-risk tolerance. Make sure you understand each Digital Asset before you trade.
Cryptocurrencies are not considered legal tender in some jurisdictions and are subject to regulatory uncertainties.
The use of Internet-based systems can involve high risks, including, but not limited to, fraud, cyber-attacks, network and communication failures, as well as identity theft and phishing attacks related to crypto-assets.
BTC Approaching Key Confluence Zone: Pivot + PRZ + LiquidationsBitcoin ( BINANCE:BTCUSDT ) appears to have broken the Support lines and is currently declining .
In terms of Elliott Wave theory , Bitcoin appears to be completing a corrective wave C . The corrective wave structure is a Zigzag Correction(ABC/5-3-5) .
I expect Bitcoin to start rising again from the Support zone($104,380-$103,660) , Potential Reversal Zone(PRZ) , Cumulative Long Liquidation Leverage($104,471-$103,124) , Monthly Pivot Point , Support line , and 50_SMA(Daily) , and the small CME Gap($106,190-$106,150) will also fill.
Note: Stop Loss: $102,520
Please respect each other's ideas and express them politely if you agree or disagree.
Bitcoin Analyze (BTCUSDT), 1-hour time frame.
Be sure to follow the updated ideas.
Do not forget to put a Stop loss for your positions (For every position you want to open).
Please follow your strategy and updates; this is just my Idea, and I will gladly see your ideas in this post.
Please do not forget the ✅' like '✅ button 🙏😊 & Share it with your friends; thanks, and Trade safe.
Bitcoin BTC price analysis🍿 At the OKX:BTCUSDT chart, we show one of the scenarios that could play out in the first half of June.
Much will be decided today with the opening of the US market. It is very likely that there will be a downward movement at the opening in response to the new tariffs announced by Trump on Friday after the markets closed.
🕯 Well, then we'll have to “keep our fingers crossed” that market players show their strength and hold on and buy back the drop — like say: we're tired of shaking with every crazy statement from Trump.
💰 If the price of CRYPTOCAP:BTC stays above $103k, there is a chance that it will be “stuck” in the $103-110k consolidation. The market needs to digest and redistribute the results of two months of #BTCUSD price growth from $75k to $112k.
And considering the position of the BTC.D and USDT.D indices, there is a chance that the “little bit” of capital will pass to the altcoins, and they will shoot up a little.
⁉️ Probably, the safest thing to do would be to watch the altcoins and buy only those that have started a significant upward movement with volume.
What do you think?
₿itcoin: Holding steadySince our last update, Bitcoin has traded in a relatively stable range. As expected, there's still a strong case for the crypto leader to climb into the upper blue Target Zone between $117,553 and $130,891. However, a deeper pullback below the $100,000 mark remains a real possibility before that move unfolds. Regardless of the path it takes, we continue to expect Bitcoin to reach this upper zone, completing green wave B. From there, a corrective wave C—also in green—is likely to follow, driving the price down toward the lower blue Target Zone between $62,395 and $51,323. This move would mark the end of the broader orange wave a. For now, we’re watching for a potential b-wave recovery before the final leg lower toward the bottom of blue wave (ii) takes shape. That said, there's still a 30% chance that blue wave (i) isn’t done yet and could extend significantly above $130,891 before any meaningful correction begins.
📈 Over 190 precise analyses, clear entry points, and defined Target Zones - that's what we do.

Bitcoin extended cycle, $120,000-$140,000 next july-augustBitcoin looks like its gonna be a good summer imo, too much people say it will a boring summer and we top in oktober-dec but what if we top in august and drop 50%, and sep-dec will be correction month, and we continue the bullrun end 2025 till q1 2026 and we print a top in q1 2026,

Final Shakeout Before BTC’s Last Leg Up?BTC Update
Well due update here...
Since my last forecast, price pushed higher without giving the pullback I was anticipating — instead sweeping liquidity above the prior ATH.
After taking that BSL, price stalled and has since been ranging, showing clear signs of bearish momentum creeping in. We're seeing bearish orderflow on the LTF and daily, and volume is thinning out up at these highs — not ideal for bulls.
USDT.D is also pushing higher and showing strength, which typically leans bearish for BTC in the short term. The structure on that chart is bullish and supports the idea of a BTC pullback being likely before any continuation higher.
That said, I'm still pro-trend bullish overall — as I mentioned in April — thanks to the clean bullish shift from the range lows and clear signs of accumulation. We’ve got textbook last points of support (LPS) and unmitigated demand sitting below current price, which are prime candidates for a reversal.
Right now I’m eyeing two key levels:
Upper demand zone / LPS — lining up with the top of the prior accumulation range. This has strong confluence as a breakout-retest zone.
Lower refined weekly/2W demand — valid if we see a deeper flush or capitulation leg, though less likely in the short term.
My focus is on the first level. I’ll be watching for reactions and reversal signals if price taps into it. Same logic applies to USDT.D as it approaches nearby supply zones.
Overall, I see this as a healthy correction — overdue after an extended leg — and expect BTC to push higher and break ATHs once demand is retested and confirmed.
Zooming out: the 4-year cycle is approaching its final stages, with data suggesting a cycle top could form around Q3/Q4 2025 — likely between August and October, if past cycles rhyme. I’ll be monitoring major assets against that timeline and will look to scale out and risk-off when the confluences begin aligning with that macro cycle window.
Just think...
1 last BTC leg up...
Final altseason hype to drag in latecomers...
Then the cycle ends — and the trap shuts as we re-enter bear territory.
Charts:
1D:
3D:
1W:
Extra:
1M:

Bitcoin 4-Year Cycle Structure – Technical BreakdownBitcoin 4-Year Cycle Structure – Technical Breakdown
This chart examines Bitcoin’s historical 4-year cycle behaviour, focusing on the repeating market structure observed across the last three cycles: Bull Market → Bear Market → Accumulation/Recovery → Halving → Expansion.
Key Observations:
🔹 Cycle Timing Consistency
Each of the past three cycles has shown a consistent duration between the halving and the final bull market peak—typically between 500–550 days. Based on that timing, the current cycle suggests we are still ~100 days away from a potential macro top.
🔹 Post-Halving Correction is Expected
Corrections shortly after the halving have historically marked mid-cycle retracements, not macro tops. The current pullback is structurally aligned with the 2017 and 2021 expansions, where Bitcoin consolidated before pushing to final highs.
🔹 Altcoin Market Segments Lagging
TOTAL2 (Total Market Cap excluding BTC)
TOTAL3 (Excluding BTC & ETH)
OTHERS (Altcoins excluding top 10 by market cap)
All remain below their prior cycle all-time highs, which historically occurs before the full market cycle concludes. These segments often accelerate after BTC has established dominance, typically in the later stages of the bull market.
🔹 USDT Dominance Suggests More Upside
USDT.D is still trending down, which historically reflects increasing risk appetite and capital rotation into crypto assets. Prior cycle tops have aligned with much lower dominance levels, indicating further downside risk for USDT.D, and potential upside for crypto markets.
Conclusion:
Despite short-term volatility, the technical structure across Bitcoin and broader market indicators suggests the cycle remains in its expansion phase. Timing models, altcoin lag, and dominance signals all point to further upside potential before a full cycle peak is in.
1W:
1M:

₿itcoin: SetbackBitcoin has come under selling pressure in recent hours. We cannot rule out that a deeper dip may precede the next leg higher into the upper blue Target Zone between $117,553 and $130,891. Once green wave B concludes in this range, we anticipate a wave C decline into the lower blue Target Zone between $62,395 and $51,323 to complete the larger orange wave a. From there, a corrective rally in orange wave b is expected, which should set the stage for a final leg lower to finalize blue wave (ii). Meanwhile, we’re still monitoring the alternative scenario (30% probability), in which blue wave alt.(i) is still in progress. In this case, BTC would stage an immediate breakout above resistance at $130,891.
📈 Over 190 precise analyses, clear entry points, and defined Target Zones - that's what we do.

xauusd daily level📌 Title:
GOLD | Supply & Demand Zones + Structure Break Analysis
📝 Description:
This chart showcases a price action-based analysis of XAUUSD (Gold) on the 15-minute timeframe.
Key highlights:
Clear Supply & Demand Zones are marked using recent price reactions and consolidation areas.
Price Structure Breaks confirm bearish control as multiple lower highs and lower lows are forming.
The price is currently reacting between two demand zones; potential for bounce or breakdown.
A strong supply area is observed around 3398–3405, which caused sharp rejections.
Watch how price behaves around 3370 zone, a key demand area which has held previously.
🔔 Trading Plan:
If price retests the upper supply zone and shows weakness (e.g., wick rejections, bearish engulfing), it may offer a short opportunity.
If price breaks below the current demand zone at 3370 with volume, expect further downside.
Bullish bias only above 3405 zone with strong candle close.
📈 Tools used:
Manual Supply & Demand Marking
Pure Price Action
Structure Break Confirmation

BTC/USDT in Consolidation: How To Trade the RangeBitcoin (BTC/USDT) is currently in a clear consolidation phase on the 4-hour chart 📊. Price action is trapped within a well-defined range, and for now, no dominant trend has emerged — we’re simply trading sideways between key support and resistance levels 🔁
In the video, we dive into how to tactically approach this kind of environment by trading the lower time frame trend shifts within the range — focusing on lower timeframe moves from range highs to range lows, and vice versa ⬆️⬇️
We also reference the broader macro picture — looking at the NASDAQ (US100) and the Magnificent 7 (MAGS) for potential clues about Bitcoin’s next directional move 🧠💡. Risk-on or risk-off sentiment in these key tech equities often correlates with Bitcoin’s momentum, making them critical confluence factors for BTC traders.
For now, the strategy is to remain range-conscious and reactive, rather than predictive. Until we get a confirmed breakout or breakdown, patience and precision remain key 🎯

At the moment, Bitcoin is hovering around the newly created FVG.🚨 BITCOIN MARKET UPDATE 🚨
Bitcoin has recently broken below the previous BPR (Balanced Price Range), signaling a significant shift in market structure. Along with this breakdown, a Bearish Fair Value Gap (FVG) has also formed — a strong indication that the market may be preparing for a further move to the downside.
📉 What This Means:
The break below BPR, combined with the emergence of a bearish FVG, suggests that bearish momentum is currently in play. This is often a sign that the market intends to seek out lower liquidity zones, potentially targeting new lower lows.
🔎 Current Setup:
At the moment, Bitcoin is hovering around the newly created FVG. If price retraces into this zone and gives us a clear bearish confirmation (such as a rejection candle, bearish engulfing, or other MSS confirmation), it could provide a high-probability sell opportunity.
🎯 Target:
The primary target would be liquidity below the most recent lower lows.
⚠️ Risk Management Reminder:
Always wait for proper confirmation before entering a trade. These setups are best traded using MSS (Market Structure Shift) or BPR strategies for higher probability outcomes.
📚 DYOR — Do Your Own Research!
Trading involves risk. Ensure you have a strategy in place and never trade blindly.

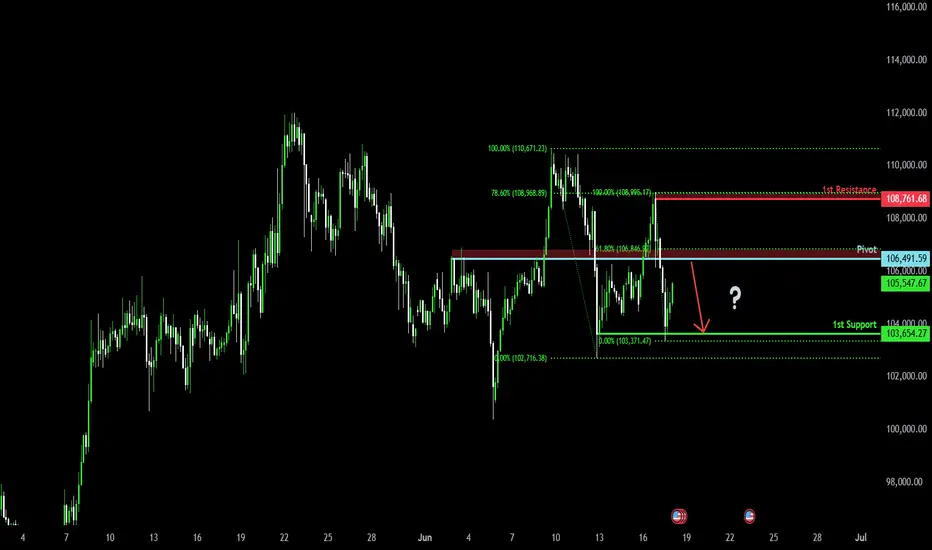
Bearish reversal?The Bitcoin (BTC/USD) is rising towards the pivot which is a pullback support and could reverse to the 1st support which is also a pullback support.
Pivot: 106,391.59
1st Support: 103,654.27
1st Resistance: 108,761.68
Risk Warning:
Trading Forex and CFDs carries a high level of risk to your capital and you should only trade with money you can afford to lose. Trading Forex and CFDs may not be suitable for all investors, so please ensure that you fully understand the risks involved and seek independent advice if necessary.
Disclaimer:
The above opinions given constitute general market commentary, and do not constitute the opinion or advice of IC Markets or any form of personal or investment advice.
Any opinions, news, research, analyses, prices, other information, or links to third-party sites contained on this website are provided on an "as-is" basis, are intended only to be informative, is not an advice nor a recommendation, nor research, or a record of our trading prices, or an offer of, or solicitation for a transaction in any financial instrument and thus should not be treated as such. The information provided does not involve any specific investment objectives, financial situation and needs of any specific person who may receive it. Please be aware, that past performance is not a reliable indicator of future performance and/or results. Past Performance or Forward-looking scenarios based upon the reasonable beliefs of the third-party provider are not a guarantee of future performance. Actual results may differ materially from those anticipated in forward-looking or past performance statements. IC Markets makes no representation or warranty and assumes no liability as to the accuracy or completeness of the information provided, nor any loss arising from any investment based on a recommendation, forecast or any information supplied by any third-party.
BTC/USDT Long Trade Setup – 1H Chart AnalysisBTC/USDT Long Trade Setup – 1H Chart Analysis
BINANCE:BTCUSDT
Hello traders! Sharing a recent long entry I took on Bitcoin (BTC/USDT) based on price action and liquidity concepts. This trade is taken on the 1-hour timeframe and aligns with my strategy of combining liquidity sweeps, support zones, and market structure shifts.
---
🔍 Trade Overview:
Entry Price: 104,704 USDT
Stop Loss: 103,660 USDT
Take Profit (Target): 108,349 USDT
Risk-to-Reward Ratio (RRR): Approximately 1:3
---
🧠 Trade Idea Behind the Entry:
As you can see on the chart, BTC had been in a downtrend and recently made a strong move into a key liquidity zone. This zone had previously seen multiple touches and rejections, making it an area of interest for both buyers and sellers.
The price swept liquidity below the previous low (labelled as “Liquidity Sweep $$$”), grabbing stop losses of early buyers and triggering limit orders of smart money. This move into the liquidity zone was followed by a strong bullish reaction – a signal that buyers may be stepping in.
Additionally, the "Break of Structure" (BOS) confirms a potential shift in market direction. The reaction from the liquidity zone indicates that this level is holding as new support.
---
🛠️ Why I Took the Trade:
1. Liquidity Sweep: The wick that pierced the liquidity zone signals stop-hunting and accumulation. These moves often precede a strong reversal.
2. Demand Zone Reaction: After the sweep, the candle closed bullish inside the demand box. This shows buyer strength.
3. Risk Management: The stop loss is set just below the liquidity zone to protect from deeper sweeps while keeping the RR healthy.
4. High Probability Target: The target is placed near the next resistance level around 108,349, which also aligns with a clean imbalance that price may want to fill.
---
📊 Technical Confidence:
Confluence Factors:
✅ Liquidity sweep
✅ Demand zone reaction
✅ Market structure shift
✅ High RR
✅ No immediate resistance till target
This type of setup reflects smart money behavior – first pushing price below structure to grab liquidity and then reversing sharply. The bullish momentum after the sweep gave extra confirmation.
---
🧭 What I’m Watching Now:
I will continue monitoring how price reacts around the 105,500–106,000 range. If momentum continues with higher highs and higher lows, I may trail my stop loss to lock in profits.
---
Let me know what you think of this setup! Have you taken a similar trade or are you waiting for confirmation? Drop your thoughts or charts below 👇
Stay disciplined, manage your risk, and trust the process. 🚀
#Bitcoin #BTCUSD #PriceAction #LiquiditySweep #SmartMoney #CryptoTrading #TradingSetup #TechnicalAnalysis #TradeJournal

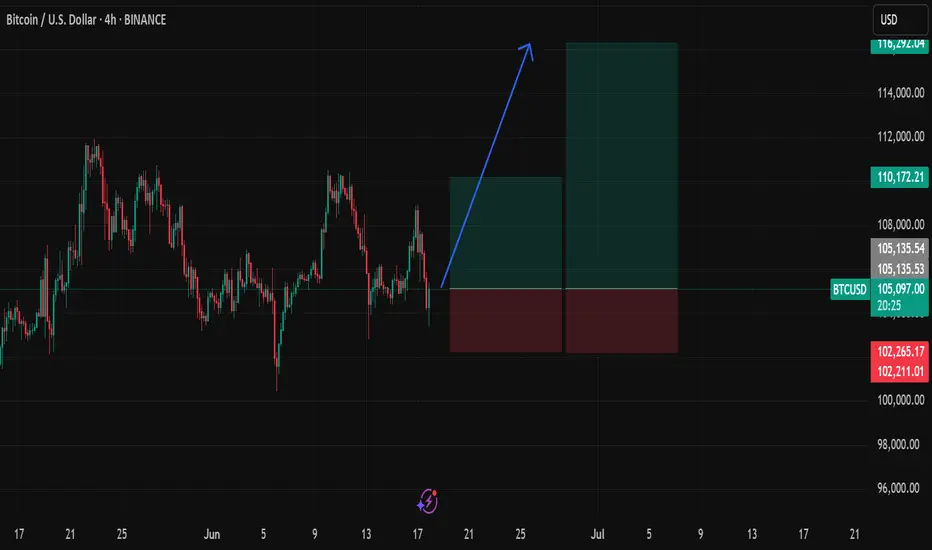
btc/usd good risk/reward bullish move!No need for words — just follow the arrow and check the risk/reward.
I'm starting a signal room soon, but for now, it's all free. Watch and decide for yourself.
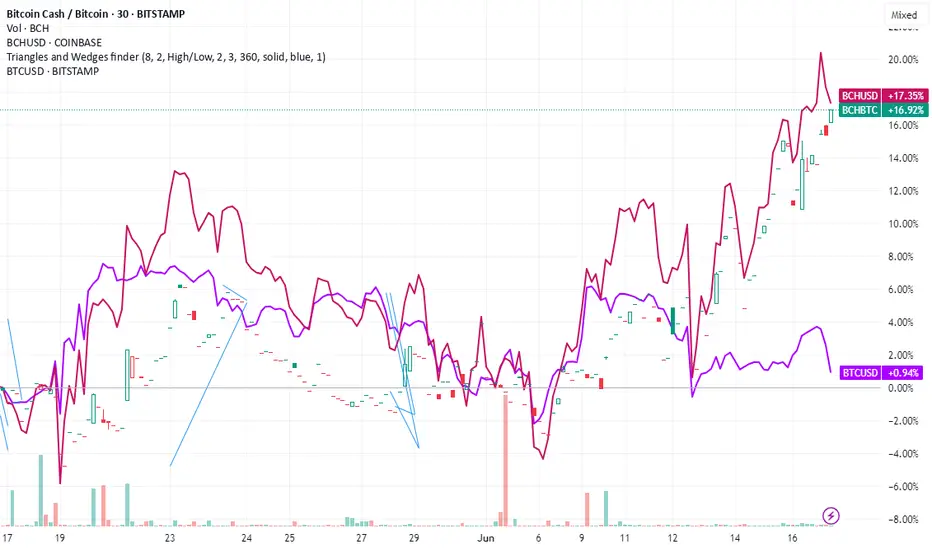
Is the Bitcoin Cash Hype Over? BCH/BTC Ratio Flashes WarningThe Great Divergence: Why the Bitcoin Cash-Bitcoin Ratio Breakdown Signals More Than Just a Price Drop
In the unforgiving arena of the cryptocurrency markets, every chart tells a story. Some whisper of quiet accumulation, others scream of speculative frenzy. But few charts tell a story as profound and historically charged as the Bitcoin Cash to Bitcoin (BCH/BTC) ratio. For years, this ratio has been the ultimate barometer of a digital civil war, a measure of the hopes and failures of a project born from a contentious schism. Recently, that barometer has given its clearest signal in months: a decisive and powerful breakdown from a multi-month triangle pattern.
This technical event is far more than a simple squiggle on a screen for traders. It represents the potential end of a speculative, hype-driven rally and the forceful reassertion of a brutal, long-term trend. It signals that the fundamental chasm between Bitcoin, the undisputed king of digital assets, and Bitcoin Cash, its most famous and ambitious offshoot, may be widening once again. The breakdown suggests that the brief period of optimism for Bitcoin Cash, fueled by its own halving event and a broader market updraft, may be conclusively over. To understand the gravity of this moment, one must dissect not only the technical pattern itself but also the deep-seated historical and fundamental weaknesses that made this breakdown almost inevitable.
The Anatomy of a Technical Collapse: Smashing the Triangle
For much of 2024, the BCH/BTC ratio was trapped in a state of compression. On the chart, this appeared as a classic symmetrical triangle pattern. This pattern is defined by a series of lower highs and higher lows, creating two converging trendlines that form the shape of a triangle. In market terms, it represents a period of intense equilibrium and indecision. Buyers and sellers are locked in a fierce battle, with neither side able to gain a definitive edge. The price coils tighter and tighter, like a compressed spring, building up energy for an explosive move. The only question is which direction it will break.
In the case of the BCH/BTC ratio, that question has been answered with a resounding crash. The price has decisively broken below the lower trendline of the triangle. This is known as a "breakdown," and it is a powerfully bearish signal. It signifies that the sellers have overwhelmed the buyers, the equilibrium has been shattered, and the path of least resistance is now firmly downwards.
Traders often measure the potential target of such a breakdown by taking the height of the triangle at its widest point and projecting that distance downwards from the point of the breakdown. Given the scale of this particular pattern, this technical measurement points to a significant further decline in the ratio, potentially revisiting and even surpassing its all-time lows. This isn't just a minor dip; it's a structural failure on the chart that suggests a new, sustained leg down in Bitcoin Cash's performance relative to Bitcoin. The "hype rally" that saw the ratio climb in the lead-up to the Bitcoin Cash halving has been effectively erased, and the market is signaling that the fundamental gravity of the long-term downtrend is taking hold once more.
A Ghost in the Machine: The Lingering Shadow of the 2017 Fork
This technical breakdown did not occur in a vacuum. It is a single chapter in a long and bitter saga that began in 2017. To grasp its significance, we must revisit the great "Block Size War" that tore the Bitcoin community apart. At its heart was a philosophical disagreement about how to scale Bitcoin to accommodate more users.
One camp, which included many of the earliest adopters and evangelists, argued for a simple solution: increase the block size. By allowing more transactions to fit into each block, the network could process more volume and keep fees low, preserving what they saw as Bitcoin's original vision of a "peer-to-peer electronic cash system."
The other camp, which ultimately retained control of the Bitcoin protocol, argued for a more cautious approach. They feared that large blocks would lead to centralization, making it too expensive for ordinary users to run a full node and validate the blockchain. Their solution was to keep the base layer small and secure, and to build scaling solutions on top of it, such as the Lightning Network.
This ideological impasse led to a "hard fork" in August 2017, creating Bitcoin Cash. For a brief, euphoric period, BCH was seen as a legitimate contender. Fueled by a powerful narrative and influential backers, its price soared, and the BCH/BTC ratio hit an all-time high of over 0.5 in late 2017, sparking serious talk of a "flippening"—the moment BCH would overtake BTC in market capitalization.
That moment never came. Since that peak, the BCH/BTC ratio has been locked in a devastating, multi-year downtrend. The recent triangle pattern was merely a pause, a brief consolidation within this much larger waterfall decline. The breakdown from the triangle is therefore not a new event, but a continuation of a historical trend. It is the market's brutal verdict on the outcome of that civil war.
The Fundamental Chasm: Why Bitcoin Cash Keeps Losing Ground
A chart pattern is ultimately a reflection of underlying fundamentals. The relentless decline of the BCH/BTC ratio is a direct consequence of the widening gap between the two networks across every meaningful metric.
1. Narrative and Brand Identity: Bitcoin has successfully cultivated a simple, powerful, and globally understood narrative: it is digital gold. It is a store of value, a hedge against inflation, and a pristine, unconfiscatable asset. This narrative has attracted institutions, nation-states, and trillions of dollars in potential capital. Bitcoin Cash, meanwhile, has struggled to define itself. Its narrative as "peer-to-peer electronic cash" is less compelling in a world with countless low-fee payment options, including stablecoins and Bitcoin's own Lightning Network. Without a clear and unique value proposition, it has failed to capture the market's imagination.
2. Security and Hash Rate: The most critical measure of a proof-of-work blockchain's health is its hash rate—the total computational power dedicated to securing the network. Here, the difference is staggering. Bitcoin's hash rate is orders of magnitude higher than Bitcoin Cash's. This makes Bitcoin exponentially more secure and resistant to a 51% attack, where a malicious actor could gain control of the network. Bitcoin Cash, with its comparatively minuscule hash rate, remains theoretically vulnerable, a fundamental flaw that deters serious institutional capital.
3. Developer Activity and Innovation: The heart of any technology is its developer community. The most innovative and exciting developments in the Bitcoin ecosystem are happening on the main chain. The activation of Taproot, the explosion of Ordinals and Inscriptions, and the continued growth of the Lightning Network all demonstrate a vibrant and evolving protocol. In contrast, the developer ecosystem for Bitcoin Cash has been far less dynamic. While it has its dedicated builders, it has not produced the kind of groundbreaking innovation needed to attract new users and capital.
3. Adoption and Network Effects: Bitcoin's network effect is its ultimate moat. It has spot ETFs trading on major stock exchanges, granting it unparalleled access to traditional finance. It is held on the balance sheets of public companies and is recognized as legal tender in some countries. Bitcoin Cash has none of these things. Merchant adoption has stalled, and institutional interest is virtually non-existent. In the world of networks, winners tend to take all, and Bitcoin's lead has become seemingly insurmountable.
The Aftermath: What Comes Next for the BCH/BTC Ratio?
With the triangle pattern now shattered, the path forward for the BCH/BTC ratio looks precarious. The most likely scenario is a continuation of the bearish trend that has been in place for over six years. The breakdown has released the coiled energy to the downside, and the ratio will likely seek out lower levels of support, potentially bleeding towards its all-time lows. For investors, this serves as a stark reminder of the risks of holding assets that are fundamentally and technically weaker than the market leader.
Is there any hope for a reversal? A bull case for Bitcoin Cash would require a monumental shift. It would need to carve out a sustainable niche that Bitcoin cannot serve, perhaps in ultra-low-fee microtransactions. It would require a renaissance in developer activity, producing a "killer app" that draws in millions of users. More likely, any significant bounce in the BCH/BTC ratio would probably be a result of a massive, indiscriminate altcoin rally that lifts all boats, rather than a specific vote of confidence in Bitcoin Cash itself. Even then, history suggests such bounces are temporary and ultimately present better opportunities to sell than to buy for the long term.
Conclusion: The Market Has Spoken
The breakdown of the BCH/BTC ratio from its multi-month triangle is a technically significant event with profound fundamental implications. It is the market's latest verdict in the long-running war for the "real Bitcoin" title. The verdict is clear: the hype is over. The dream of a "flippening" is a distant memory, a ghost from 2017.
The story of the BCH/BTC chart is a powerful lesson in market dynamics. It shows that in the brutal competition of open-source protocols, a superior narrative, impenetrable security, and a powerful network effect are the ultimate weapons. Bitcoin Cash began its life as a legitimate contender with a compelling vision. But over time, it has been outmaneuvered, out-developed, and out-adopted. The chart does not lie. It simply reflects this divergent reality, and its latest signal suggests that the great divergence between Bitcoin and its most famous offspring is set to continue.