Bitcoins has slipped back under Long Term resistance. CAUTION
It is VERY clear to see and some just do not want to see it
That Blue Arc, Arrowed, is an Arc that has rejected EVERY ATH since Bitcoin began rising from its early Low.
And also understand, that arc is not just a random line, It is Calculated and is part of a Fibonacci Spiral.
ANYWAY, as we can see on the chart. PA is heading to a Squeeze with this Arc and a rising line of support below.
This line of support has NEVER failed since PA crossed over it.
So we have a n arc of Resistance that has Never been broken.
We have a line of support that has Never been Broken.
One of these two line Has to break.
The Apex of this Squeeze us Dec this year and, as we all know, PA always react before the Apex.
So, How accurate is the placement of this Arc ?
Lets see the Daily chart
Here we can see that PA has for most of this year, been trying to break over and, in July, succeeded, only to fall back below a week ago.
To many extents this played along Very well with the monthly Candle Colour patterns I been posting.
But the fact remains, we are once again BELOW a HUGE powerful line of resistance that we MUST break above and stay above.
We do have many lines of Support below, Local and some, longer term.
We can close on the 4 hour just to see where we are in a more local time frame.
Here, we can see that 105K is a very possible line of support initially that we need to watch and see what happens. Hopefully, we range above this level and let RSI cool off.
The RSI is always a great gauge to watch here and the daily offers some hope of remaining in this current PA range
It must be said that RSI could still drop lower, though we have room to rise before PA becomes OverBought on the Daily.
But the weekly shows us a longer term CAUTION flag.
While we have not been OverBought on the weekly for a long time, we ARE up high, leaving the potential for a Drop.
But with the Daily in good shape, this could be postponed. In this cycle, previous times we got overbought, PA ranged while RSI dropped.
This could repeatover and over........But PA needs to rise OVER that line of resistance and turn it into Support.
This is NOT a choice//it is a MUST HAPPEN if Bitcoin is to continue its rise higher.
The current Price line of this Blue Arc is around 116K.
What we realy need to understand about this Arc is that once we pass December 2025, that arc begins to DROP.
And if PA is below it still, PA will get dragged down with it, into an ever decreasing price model.
So, there we have it
Simple as that.
Bitcoinrsi
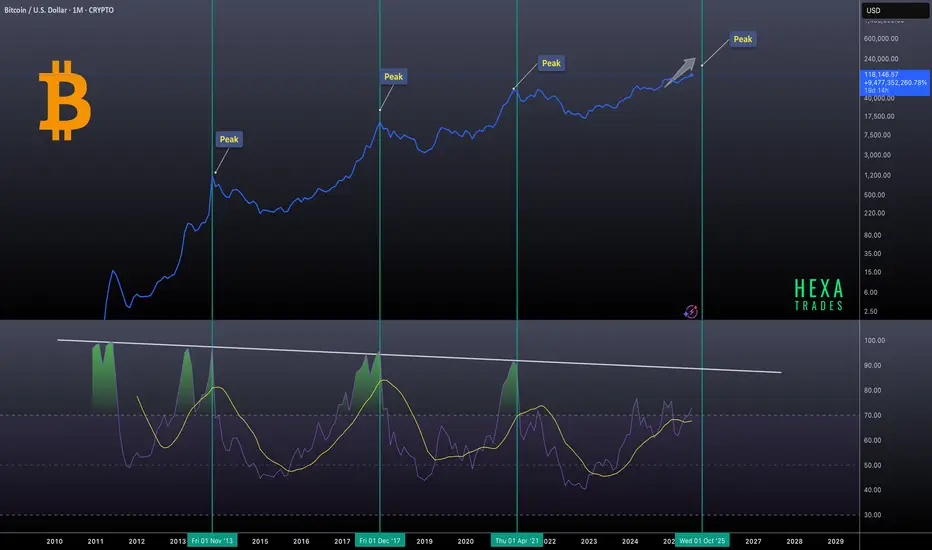
Bitcoin Macro Cycles: Sell Signal at RSI 90Bitcoin’s historical market cycles, using monthly RSI data to identify previous bull market peaks. Notable tops in 2013, 2017, and 2021 are highlighted, with the next potential peak projected around October 2025. A consistent pattern emerges where each market top aligns with the monthly RSI reaching or nearing the 90 level, indicating extremely overbought conditions.
Sell when the monthly RSI hits 90. This has consistently marked previous market tops and can serve as a reliable signal for long-term investors.
BITCOIN new week open Green - Will we get 8 weeks Green in a row
These are all WEEKLY chart
7 weeks in a row closed Green.
At Time of writing, Bitcoin is around 109800 usd
So Very Bullish and every possibility that this week will also close Green though we are getting near a point of resistance.
If we zoom into the same chart, we can see more detail
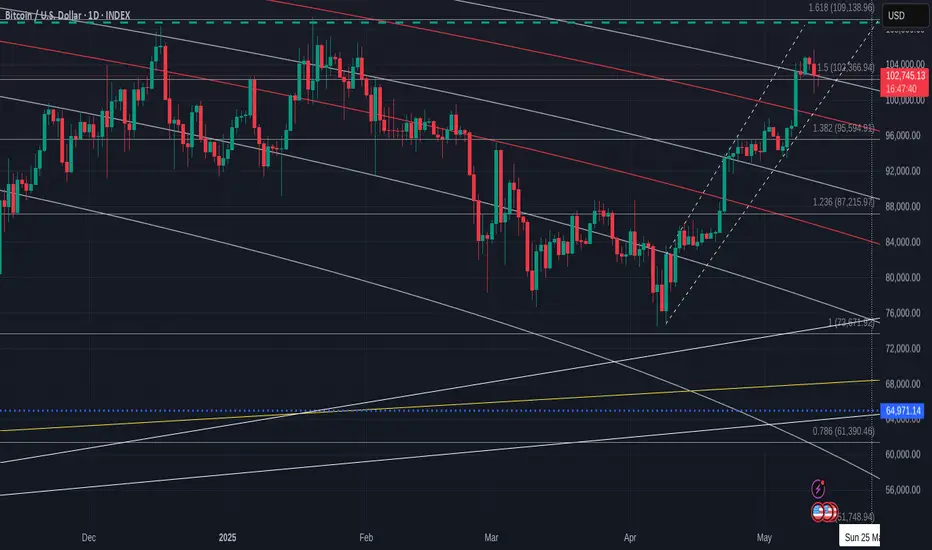
We are above the 2.618 Fib extension and we could return to the 103K zone to test this as support. We may need to do this as it has only ever been resistance previously.
We are also very close to a 618 Fib circle.( Blue )
We do not know if this is an area of strong resistance yet but PA is now in the area that we may react to it.
As a result of this Fib circle, we need to be prepared for the possibility of reentering that rising channel,
We may not do that ,The reasons being that PA still has enough strength.
The MACD - or Moving Average Convergence Divergence, is a technical analysis tool used in trading to identify momentum and trend direction.
The 2 vertical lines on the left are the 2021 ATH points, to give a comparison.
In this cycle we have had 2 previous peaks and then the cooling off period from OverBought.
The Cooling off were the periods were BTC PA ranged..
We are currently rising Bullish, with room to move higher but we should be aware that we are in the area that rejected the 2nd ATH in 2021. The daily is in a very similar position but getting choppy.
The RSI - Relative Strength Index, a technical indicator used to understand the momentum of a price trend . The RSI helps signal when to buy and sell in a trending market by identifying overbought or oversold conditions in a security.
Again, the Vertical lines on the left show you the 2021 ATH points as reference.
See how RSI peaks before BTC PA Peaks.
We have not been fully OverBought since March 2024. RSI is rising Bullish with Room to move higher, though, again, note how it is in an area were rejection has occurred previously.
The Mayer Multiple is a ratio used in trading that compares the current market price of an asset, such as Bitcoin, to its 200-day moving average (SMA) price.
This indicator is particularly useful for swing traders to find zones of extreme overbuys and
It is generally considered a bullish indicator when the price is above the long-term moving average ( Yellow ) and bearish when the price is below it, although significant deviations from the moving average can indicate overvaluation or undervaluation.
Again, take note of the vertical lines and were this Mayer Multiple was.
Again, the tendency is that when this Drops, BTC PA has Ranged to cool off and when it crosses above its Average, it leads to a High on the push higher.
And once again, remembering what has been said above, we need to wait to see if this crosses its average or get rejected by it.
But as you can see, the Average is more often used as support amd mpt resistance.
So, in conclusion, I remain Bullish but with a note of Caution till we get a push higher conformed.
We could see a pull back and , if that happens, this maybe the last sensible buying Zone for Bitcoin this time round. The Risk is increasing as more and more coins enter into good profit margins. People may get tempted to sell.
On a longer term , this month has confirmed a very bullish intent and we have one week to go before month end. I will expand on this on 2nd June
This week. we wait and see how Bitcoin will react.
Be Kind to others. The world Needs LOVE

BITCOIN Daily Bullish / Bearish days ahaed with Big push after
Even though I have mentioned that we maybe in for some RED days this week, this chart shows how, ultimately, we are in a Bullish momentum still.
The CUP pattern that we have printed ( adjusted since I last posted this) , Goes from ATH line back to the ATH line.
We also see how there is this APEX that PA has fallen into that has its peak at the end of this month.
PA always reacts before the APEX
But before this, we may range across or drop down onto the CUP. This has Strong support and could possibly propel PA above thaT ATH line.
We do need to also understand, there is a 618 Fib circle at this intersection and that may not be easy to break through.
But PA has often searched out intersections of resistance to break through and so I am looking to this as the way forward.
The 2.618 Fib Ext on this chart may also offer support at around 98K if we loose support higher.
The RSI is already dropping from OverBought and so will probably continue to do so till we reach Neutral / Over Sold again.
And the Daily MACD, is also turning Bearish, But as mentioned before, this is possibly repeating what happened in Nv 2024
See the Arrow on the left...The Histogram is the one to take note of. Two Green peaks and then a red Dip
We have just begun the Red bit after the two Green peaks.
The scale is larger here and so we may have to wait longer till we return out of the green.
In 10 dayts, we will be near end of month
So, for me, this week will be possibly Red but towards the end of the month, things will begin to move higher.
All depends on PA following expected patterns and that does not always happen
We can only look, plan and react.

Bitcoin Daily update , MACD & RSI - whats possibility short Term
Bitcoin has reached above the next Fib circle. You can see how PA reacts to these by looking back
For me, I can see PA sliding down the 618 Circle we currently sit on until we reach that dashed line that shows the lower line of support of the rising channel.
We reach that around 17 May if we range sideways, slide along fib circle.
It could also be said that the 1.5 "local" Fib extension is what is offering Support here and the same date is used for when PA reached that dashed line of support.
Which ever option you choose, PA has support here and we should remain around this area unless the inflation figures released TODAY are not good
Why will PA range and not continue to Rise ?
RSI is up in overbought
This can range high and we need to watch and see if the RSI bounces of its own MA ( yellow line)
The Daily MACD is showing a desire to turn Bearish. for the 2nd time, it is curling over and not just pushing higher as previously.
This is NOT an over all Bearish signal to me but one that shows that PA is pushing hard against resistance. See how the histogram has reduced in size
The 4 hour MACD is still falling Bearish, recovering from the previous pushes.
In conclusion
The combination of a High RSI and Weakening MACD leads me to think that PA will Range across at best for a while, Till the 4 hour MACD reverses and climbs, Maybe with small Dips and Troughs.
If BTC Looses 100K, that is a big mental blow and I think the Bulls will try and avoid this.
However There is a possibility that we could drop back to the Low around 82K by the end of this month. I think this is a low possibility and I will post a report on this today but it is Good to look at all possibilities.
Long Term still Very BULLISH
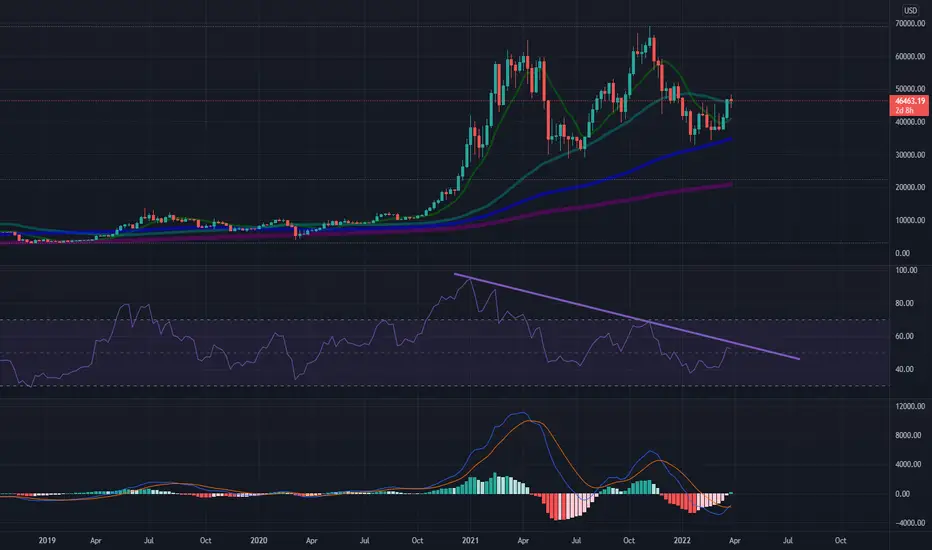
$btc #Bitcoin at a pivotal test on the weekly RSIWatching for rejection of the RSI weekly trendline for this bull run. The bearish divergence on this timeframe is obvious but I feel the trendline is what to watch. If we can break through that trendline on the RSI I believe we can at least hit 52k till our next retest. These plays take a long time to work out due to the timeframe, but it shall be an interesting one as I feel that trendline is extreme resistance.
Coupled with the 50wSMA rolling over....Im more bearish.