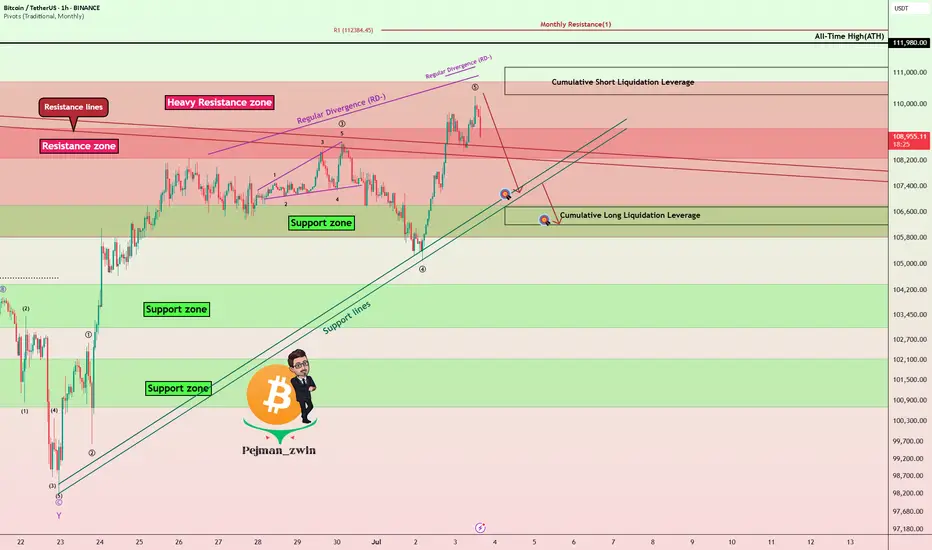
Bitcoin Roadmap => Short-termBitcoin ( BINANCE:BTCUSDT ) is moving above a Heavy Resistance zone($110,720-$105,820) , Cumulative Short Liquidation Leverage($110,300-$111,177) and is approaching All-Time High(ATH) .
Do you think Bitcoin will create a new All-Time High(ATH) in this rally?
In terms of Elliott Wave theory , Bitcoin's rise over the last two days appears to have been in the form of wave 5 .
Also, we can see the Regular Divergence(RD-) between Consecutive Peaks.
I expect Bitcoin to start declining in the coming hours. Targets are marked on the chart.
Cumulative Long Liquidation Leverage: $106,750-$106,202
Note: Stop Loss(SL)= $111,223
Please respect each other's ideas and express them politely if you agree or disagree.
Bitcoin Analyze (BTCUSDT), 1-hour time frame.
Be sure to follow the updated ideas.
Do not forget to put a Stop loss for your positions (For every position you want to open).
Please follow your strategy and updates; this is just my Idea, and I will gladly see your ideas in this post.
Please do not forget the ✅' like '✅ button 🙏😊 & Share it with your friends; thanks, and Trade safe.
Bitcoinsignals
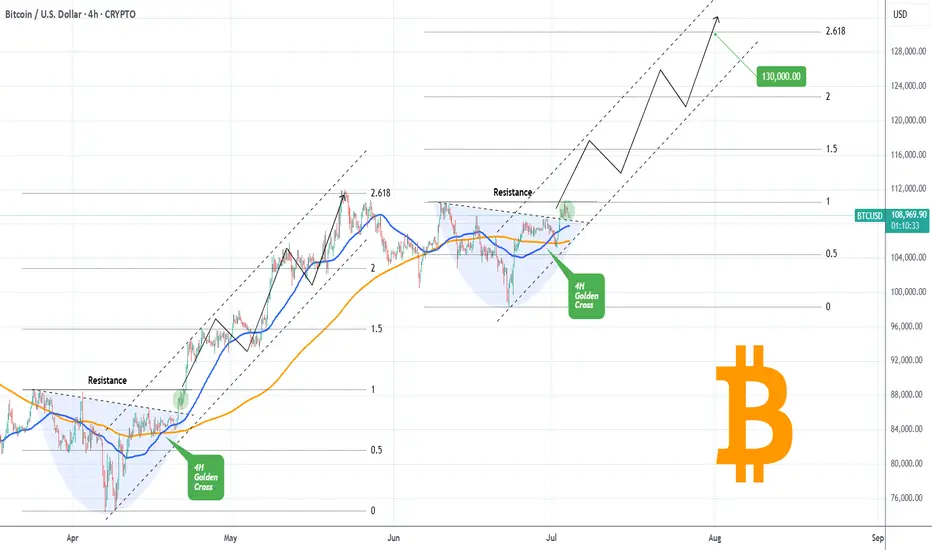
BITCOIN Golden Cross going to slingshot it to $130kBitcoin (BTCUSD) has completed a Golden Cross on the 4H time-frame and is attempting to keep the 4H MA50 (blue trend-line) as Support. If successful, it has high probabilities of staging a Channel Up similar to April - May, which peaked on the 2.618 Fibonacci extension.
So far, the bases of those to fractals are virtually identical, with a Lower Highs trend-line initially acting as a Resistance, which broke and on the current one it is testing the final Resistance (dotted trend-line).
This is the green circle, which on April 21 staged a quick consolidation before breaking aggressively upwards. If the pattern continues to repeat itself, we can get $130k (Fib 2.618 ext) at the end of the Channel Up.
Do you think it will? Feel free to let us know in the comments section below!
-------------------------------------------------------------------------------
** Please LIKE 👍, FOLLOW ✅, SHARE 🙌 and COMMENT ✍ if you enjoy this idea! Also share your ideas and charts in the comments section below! This is best way to keep it relevant, support us, keep the content here free and allow the idea to reach as many people as possible. **
-------------------------------------------------------------------------------
💸💸💸💸💸💸
👇 👇 👇 👇 👇 👇
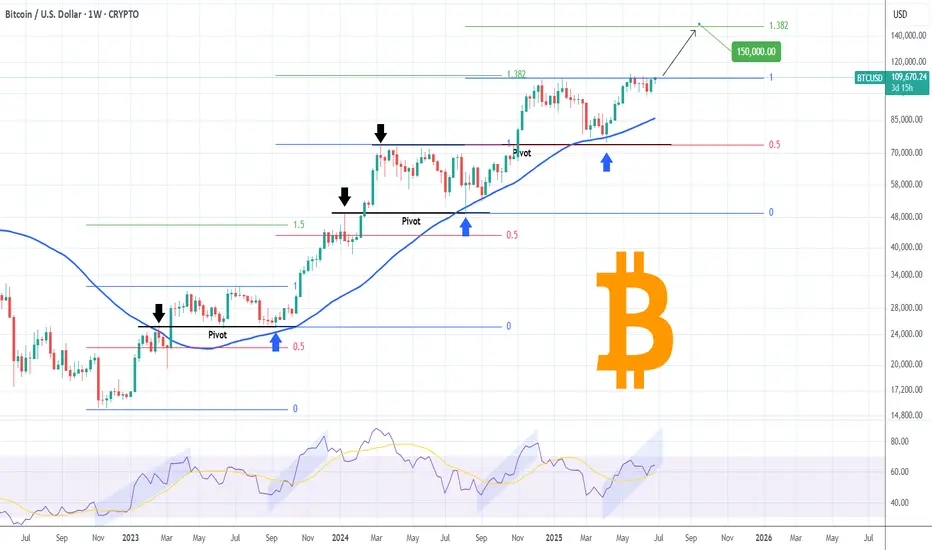
BITCOIN now starts ascent to $150k.Bitcoin (BTCUSD) closed last week with a strong green 1W candle, recovering all loses and has started the current one with a stable rise. As stable as the whole Bull Cycle has been so far since the November 2022 market bottom.
The current uptrend is the technical Bullish Leg that has always emerged the Triple Support Combo of the 1W MA50 (blue trend-line), 0.5 Fibonacci retracement level and former Resistance, turned Support (Pivot).
As you can see, this has happened 2 times already and this is the 3rd. The previous one peaked a little above the 1.382 Fibonacci extension, which gives us an immediate Target on a 2-month horizon at $150000. This confirms a number of previous studies we conducted, all leading towards this price or around it.
So do you think all roads lead to $150k? Feel free to let us know in the comments section below!
-------------------------------------------------------------------------------
** Please LIKE 👍, FOLLOW ✅, SHARE 🙌 and COMMENT ✍ if you enjoy this idea! Also share your ideas and charts in the comments section below! This is best way to keep it relevant, support us, keep the content here free and allow the idea to reach as many people as possible. **
-------------------------------------------------------------------------------
💸💸💸💸💸💸
👇 👇 👇 👇 👇 👇
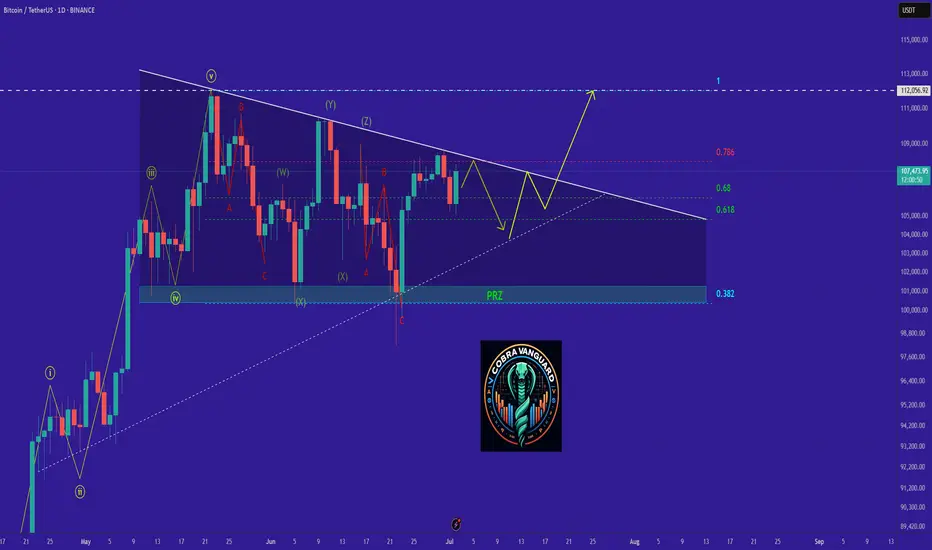
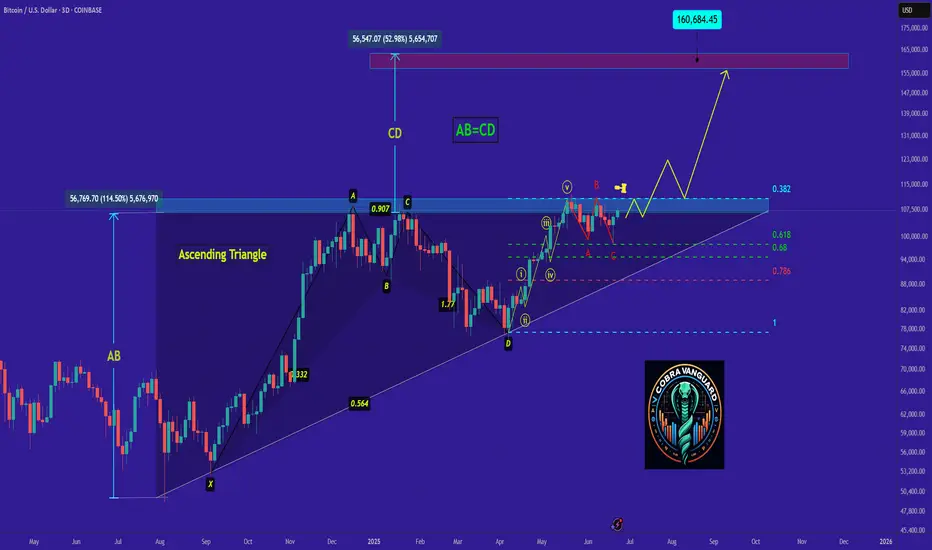
BTC's Situation, A Comprehensive Analysis !!!The situation has become quite strange. Bitcoin is forming deceptive patterns, and altcoins continue their downward trend. Currently, Bitcoin is positioned within two triangles—one symmetrical and the other descending. Now that Bitcoin has reached the top of the triangle and appears ready to break upward, it might actually be hiding yet another trap within the price action.
This market has shown disregard for technical patterns, and every time the price approaches historically significant levels, it reveals its true intentions and disappoints us. This cycle tends to repeat.
In my opinion, we’re likely to see one more drop in Bitcoin’s price. After that, instead of continuing the expected downtrend from the pattern, the price could break the descending formation and experience a strong upward move.
Stay Awesome , CobraVanguard.
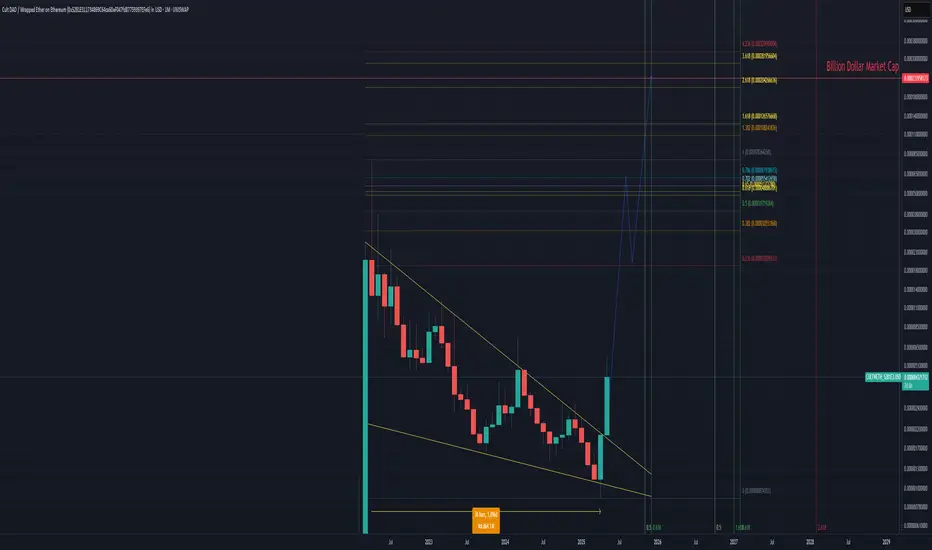
CULT DAO ON ITS WAY TO A BILLION DOLLAR MARKET CAPIf you want an in-depth look at everything CULT DAO, check out the TA below:
This is just a technical update.
A massive breakout occurred as expected. I’ve been highlighting the divergence forming in the MACD for months — it’s all detailed in the TA above.
Over the last 1,096 days, CULT DAO has formed a giant descending wedge — both in price structure and on the MACD. The path was clear.
Onwards and upwards.
A billion-dollar market cap is very possible by Q4 2025.
Breakthrough tech.
Mainnet launch around the corner.
Rocket ship loading.
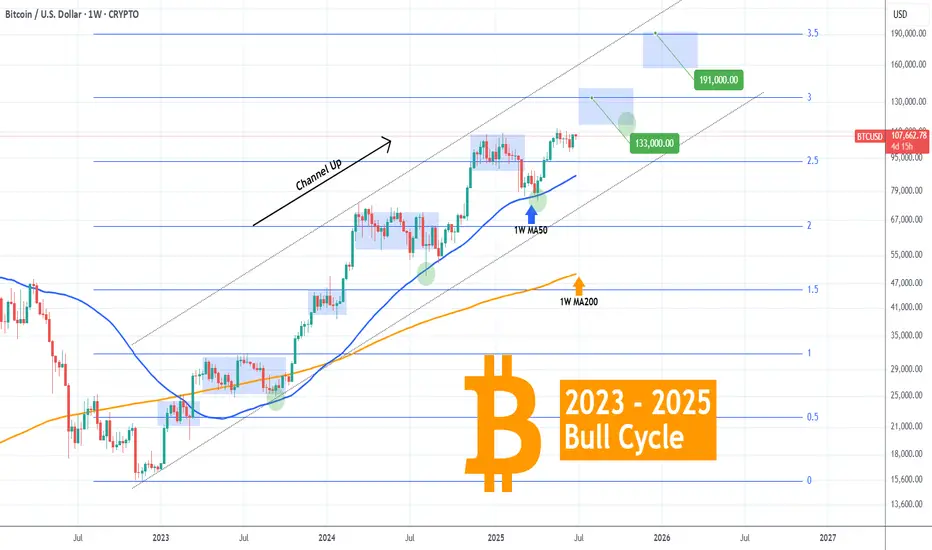
BITCOIN Bull Cycle's next two probable stops..Bitcoin (BTCUSD) has been trading within a 2.5-year Channel Up throughout the entirety of its 2023 - 2025 Bull Cycle, showcasing incredible consistency. This is perhaps BTC's most stable Bull Cycle and that can help us estimate to some degree its next two key levels, before its tops.
As you can see, every major Higher High of this pattern has been either on or marginally above a +0.5 Fibonacci interval:
Fib 0.5 was the February 2023 High and Accumulation Phase.
Fib 1.0 the April - September 2023 Accumulation.
Fib 1.5 December 2023 - January 2024.
Fib 2.0 March - September 2024.
Fib 2.5 December 2024 - February 2025.
Right now the market seems to be attempting a break-out above a Bull Flag, following the massive April 07 2025 rebound on the 1W MA50 (blue trend-line), a level that has been the most optimal buy entry in the past 2 years.
The next stop based on this model is the 3.0 Fibonacci extension level at 133000, where there are high probabilities for the market to consolidate (accumulation phase) in preparation for perhaps the final stop and Cycle peak on the 3.5 Fib ext around 191000. As we've discussed on previous analyses, a final Target between those two around $150000 may be more fitting, carrying less risk into the final months of the Bull Cycle.
So what do you think? Do you believe that's the blueprint to follow until the end of the year/ Cycle? Feel free to let us know in the comments section below!
-------------------------------------------------------------------------------
** Please LIKE 👍, FOLLOW ✅, SHARE 🙌 and COMMENT ✍ if you enjoy this idea! Also share your ideas and charts in the comments section below! This is best way to keep it relevant, support us, keep the content here free and allow the idea to reach as many people as possible. **
-------------------------------------------------------------------------------
💸💸💸💸💸💸
👇 👇 👇 👇 👇 👇
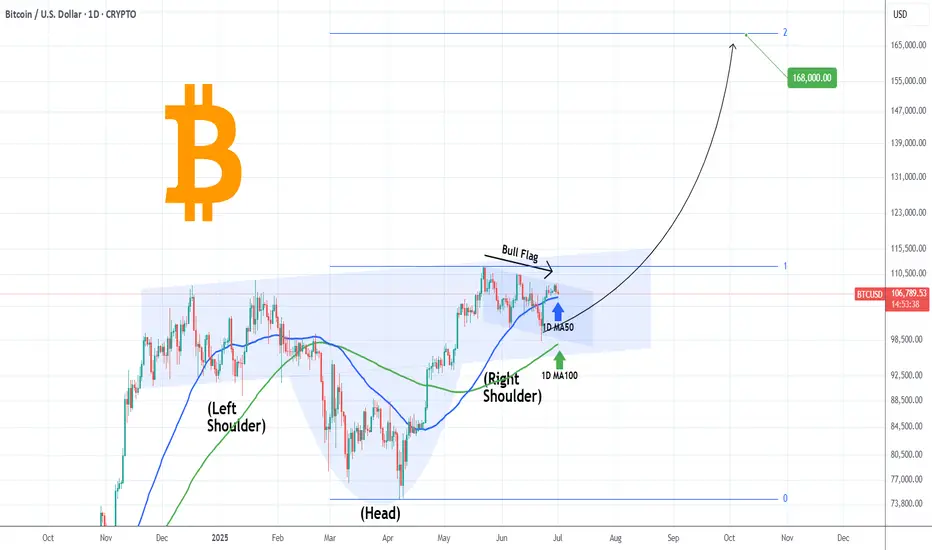
BITCOIN Can this Inverse Head and Shoulders deliver $168000?We saw yesterday how Bitcoin (BTCUSD) has been trading within a short-term Channel Down pattern, which as mentioned was just a Bull Flag on the long-term scale.
Today we examine this on the longer term time-frame and what stands out on 1D is an Inverse Head and Shoulders (IH&S). Such patterns are incredibly bullish but are more often seen on market bottoms initiating strong long-term bullish reversals.
This time it has been formed on a 1W Bull Cycle uptrend (Channel Up), so it technically serves as a (very) long-term Accumulation Phase between the Cycle's previous All Time High (ATH) and the next one, which most likely will be the final (peak) of the Bull Cycle.
As mentioned numerous times in the past, IH&S patterns target their 2.0 Fibonacci extension level once broken. That is now at $168000 and falls well within the broader 150 - 200k range that most studies have as a potential Cycle Top.
So do you think that is realistic to expect? Feel free to let us know in the comments section below!
-------------------------------------------------------------------------------
** Please LIKE 👍, FOLLOW ✅, SHARE 🙌 and COMMENT ✍ if you enjoy this idea! Also share your ideas and charts in the comments section below! This is best way to keep it relevant, support us, keep the content here free and allow the idea to reach as many people as possible. **
-------------------------------------------------------------------------------
💸💸💸💸💸💸
👇 👇 👇 👇 👇 👇
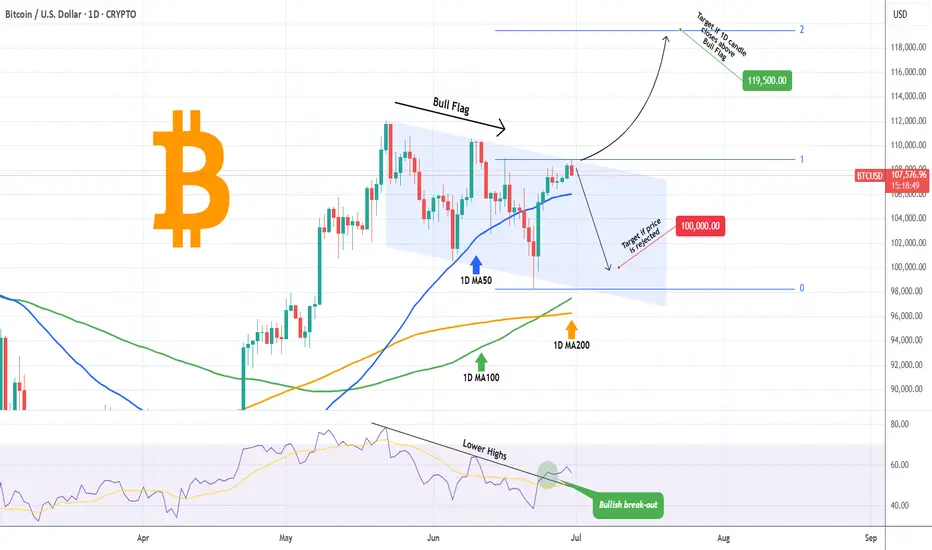
BITCOIN Rejected (so far) where it absolutely SHOULDN'T!!Bitcoin (BTCUSD) hit today the top of the Channel Down pattern, which as we've discussed numerous times, is most likely on the long-term a Bull Flag technically. Still, this early test has so far turned into a rejection.
Early on to tell as the price remains above even the 1D MA50 (blue trend-line) but if it breaks above the closes a 1D candle above the top of the pattern, we expect it to immediately target the 2.0 Fibonacci extension level at 119500. We have analyzed of course why on the long-term the Target is at least $150k, but this is a shorter term analysis. Notice also how the 1D RSI has already broken above its Lower Highs trend-line.
As long as the price remains rejected within the Channel Down, it is possible to look for support on the 100000 level again, where this time it may make contact with the 1D MA100 (green trend-line) in an attempt to 'attract' the last batch of buyers.
Which scenario do you think will prevail? Feel free to let us know in the comments section below!
-------------------------------------------------------------------------------
** Please LIKE 👍, FOLLOW ✅, SHARE 🙌 and COMMENT ✍ if you enjoy this idea! Also share your ideas and charts in the comments section below! This is best way to keep it relevant, support us, keep the content here free and allow the idea to reach as many people as possible. **
-------------------------------------------------------------------------------
💸💸💸💸💸💸
👇 👇 👇 👇 👇 👇
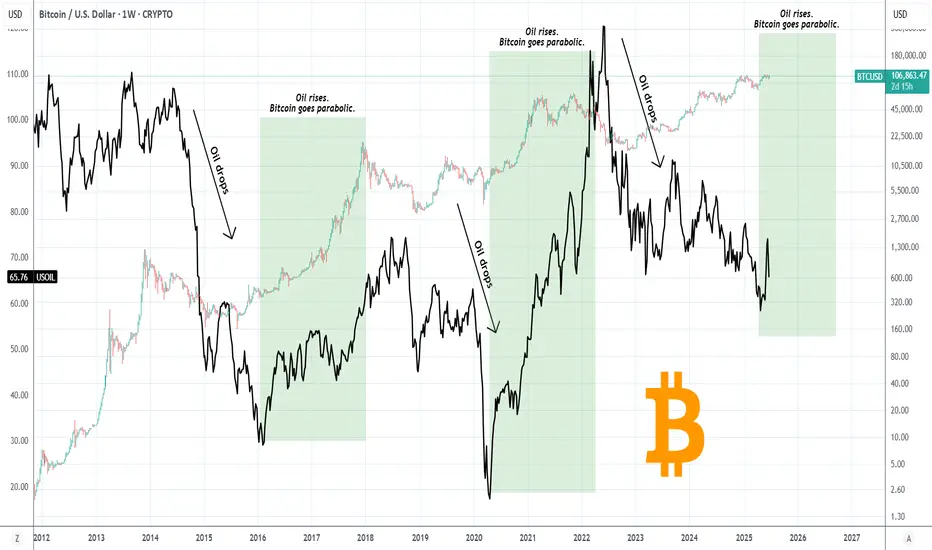
BITCOIN Just wait until OIL turns bullish!Bitcoin (BTCUSD) has a unique long-term relationship/ correlation with WTI Oil (USOIL) and this charts shows why.
In the past 11 years, when Oil started to decline sharply, Bitcoin formed a market bottom before Oil did. When Oil started to rise again, Bitcoin was out of its bottom and has initiated its Parabolic Rally stage (green Rectangle). Then Oil peaked after BTC has already priced its own Cycle Top.
Based on this correlation, we can assume that we haven't yet seen BTC's Parabolic stage as Oil hasn't yet started to rise. If we assume that the late April Low on Oil was its market bottom, then only now it has started its rise, so at best BTC has just started the Cycle's Parabolic Rally. If that turns out o be true, then the upside potential is huge for BTC. Needless to say other key macroeconomic factors have to assist e.g. higher adoption, ETF inflows, FED Rate Cut, but that's what the current chart says!
So do you think that Oil can be the driver behind a new Bitcoin parabolic rally? Feel free to let us know in the comments section below!
-------------------------------------------------------------------------------
** Please LIKE 👍, FOLLOW , SHARE and COMMENT if you enjoy this idea! Also share your ideas and charts in the comments section below! This is best way to keep it relevant, support us, keep the content here free and allow the idea to reach as many people as possible. **
-------------------------------------------------------------------------------
💸💸💸💸💸💸
👇 👇 👇 👇 👇 👇
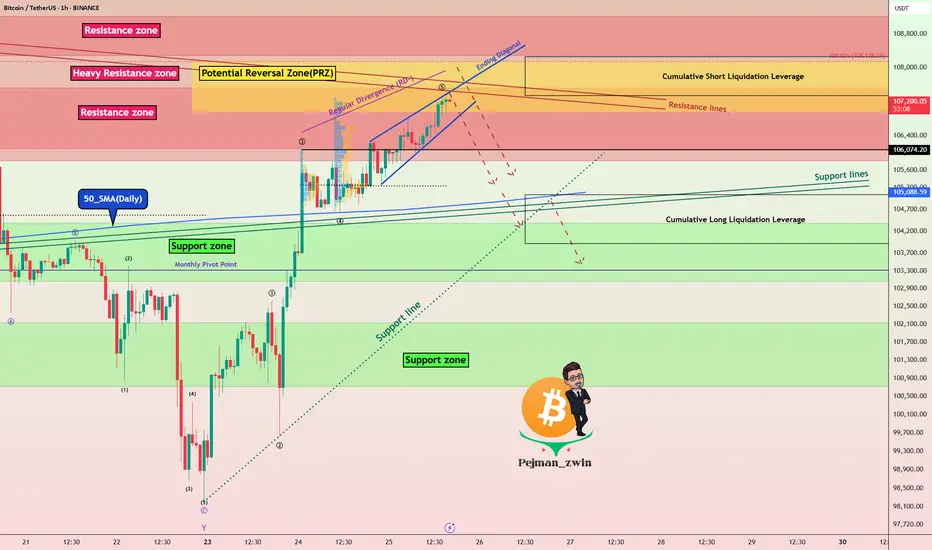
Bitcoin Reaches PRZ with Bearish Signals — Is a Drop Imminent?Bitcoin ( BINANCE:BTCUSDT ) has reached the Potential Reversal Zone(PRZ) as I expected in yesterday's post .
Bitcoin is trading in the Heavy Resistance zone($110,720-$105,820) , Potential Reversal Zone(PRZ) , and near the Resistance lines .
In terms of Elliott Wave theory , it seems that Bitcoin has managed to complete the main wave 5 with the help of the Ending Diagonal . The structure of wave 5 can be different.
Also, we can see the Regular Divergence(RD-) between Consecutive Peaks.
I expect Bitcoin to drop to at least $105,400 .
Cumulative Short Liquidation Leverage: $107,334-$108,250
Cumulative Long Liquidation Leverage: $105,037-$103,392
Note: We could be in for a bit of excitement in the financial markets during Federal Reserve Chairman Powell's speech.
Note: Stop Loss(SL)= $109,020 = We can expect more pumps.
Please respect each other's ideas and express them politely if you agree or disagree.
Bitcoin Analyze (BTCUSDT), 1-hour time frame.
Be sure to follow the updated ideas.
Do not forget to put a Stop loss for your positions (For every position you want to open).
Please follow your strategy and updates; this is just my Idea, and I will gladly see your ideas in this post.
Please do not forget the ✅' like '✅ button 🙏😊 & Share it with your friends; thanks, and Trade safe.
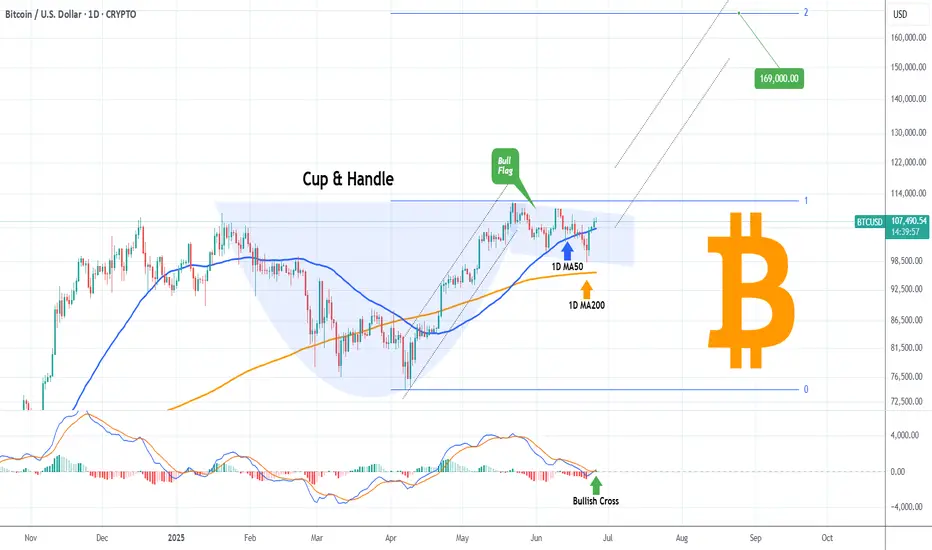
BITCOIN Cup & Handle completed! Technical Target $169k!Bitcoin (BTCUSD) is about to complete the Handle of a Cup and Handle (C&H) pattern. This comes only days after breaking below its 1D MA50 (blue trend-line) buy holding the 1D MA200 (orange trend-line) and rebounding.
Well the 1D MA50 has been recovered and on top of that, the 1D MACD just formed a Bullish Cross. This (isolated) Bull Flag, which is the Handle, technically targets the 2.0 Fibonacci extension at $169000.
Do you think that's realistic or a little excessive within thin time-frame? Feel free to let us know in the comments section below!
-------------------------------------------------------------------------------
** Please LIKE 👍, FOLLOW ✅, SHARE 🙌 and COMMENT ✍ if you enjoy this idea! Also share your ideas and charts in the comments section below! This is best way to keep it relevant, support us, keep the content here free and allow the idea to reach as many people as possible. **
-------------------------------------------------------------------------------
💸💸💸💸💸💸
👇 👇 👇 👇 👇 👇
I don't know why ???Bitcoin is now at a point where it cannot be ignored! In my view, the bullish wave has started after the corrective wave ended. This wave could continue until it breaks the ascending triangle, then with a slight correction, push the price upward again. The current period and the coming days could be crucial in determining the market's trend.
Best regards CobraVanguard.💚
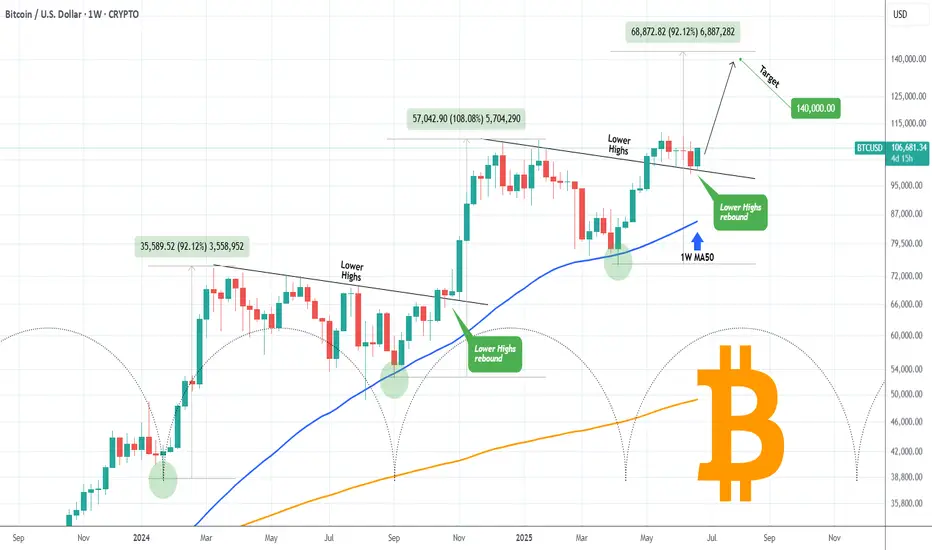
BITCOIN Major Pivot bounce eyes $140000!Bitcoin (BTCUSD) has started off the week with a huge 1W candle bounce on the former Lower Highs trend-line (that started on its All Time High), which has now turned into a Pivot. That trend-line held both last week and 3 weeks ago.
The very same Pivot test took place (October 2024) at the start of the previous Bullish Leg, resulting into a massive rebound that peaked upon a +108.08% rise. That was even higher than the Bullish Leg before it (+92.12%), which also started after a 1.5 month consolidation (Dec 2023 - Jan 2024).
Interestingly enough those Legs show an amazing frequency as the Time Cycles show on their bottoms. Assuming the current Bullish Leg will follow the 'bad case' scenario of +92.12%, we should be expecting to see at least $140000 before the next pull-back/ consolidation.
Do you think such Target is feasible by the end of August? Feel free to let us know in the comments section below!
-------------------------------------------------------------------------------
** Please LIKE 👍, FOLLOW ✅, SHARE 🙌 and COMMENT ✍ if you enjoy this idea! Also share your ideas and charts in the comments section below! This is best way to keep it relevant, support us, keep the content here free and allow the idea to reach as many people as possible. **
-------------------------------------------------------------------------------
💸💸💸💸💸💸
👇 👇 👇 👇 👇 👇
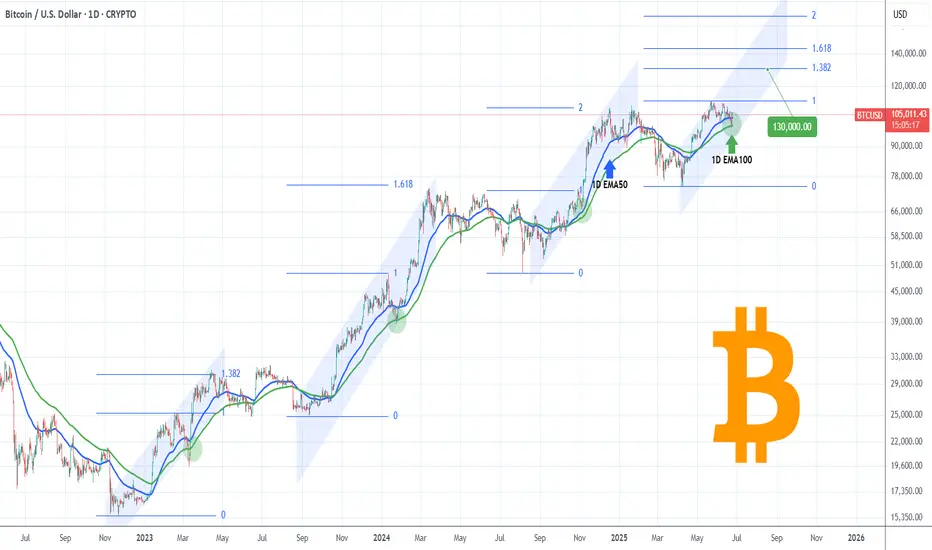
BITCOIN Trump and the 1D EMA100 saved the day!Bitcoin (BTCUSD) rebounded yesterday on its 1D EMA100 (green trend-line) and along with Trump's truce announcement between Israel and Iran, it sent the market into a buying frenzy and back above the $105k mark.
Technically, the 1D EMA100 isn't something to be ignored as since the November 2022 market bottom, each Bullish Leg (Channel Up) that started had a contact (or near) with it that resulted into a considerable bullish extension.
The 1st Channel Up even breached below it, but after rebounding, it reached the 1.382 Fibonacci extension before the next correction. The 2nd Channel Up rebounded exactly on the 1D EMA100, and reached the 1.618 Fibonacci extension. The 3rd Channel Up almost hit the 1D EMA100 and then rebounded to the 2.0 Fibonacci extension.
It is obvious that the pattern follows a progression and each Fib extension peak is higher than on the previous Channel Up. As a result, it is not unlikely to see a High even above the 2.0 Fib ext ($168k) on the current (4th) Channel Up, however on the short-term we would still welcome the 1.382 Fib 'minimum' expectation, targeting $130000.
Do you think we should at least be expecting that? Feel free to let us know in the comments section below!
-------------------------------------------------------------------------------
** Please LIKE 👍, FOLLOW ✅, SHARE 🙌 and COMMENT ✍ if you enjoy this idea! Also share your ideas and charts in the comments section below! This is best way to keep it relevant, support us, keep the content here free and allow the idea to reach as many people as possible. **
-------------------------------------------------------------------------------
💸💸💸💸💸💸
👇 👇 👇 👇 👇 👇
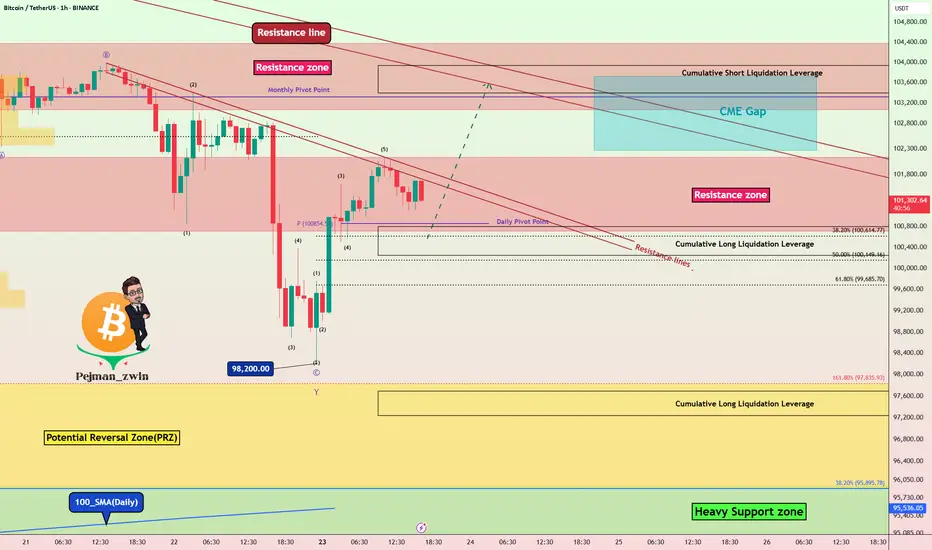
Bitcoin Breakout Incoming? Flash PMI & CME Gap in FocusBitcoin ( BINANCE:BTCUSDT ) started to fall ( about -4%) after the news that the US was involved in the Middle East tension , but it has risen again with good momentum .
Do you think Bitcoin will go below the previous bottom($98,200) again on the 1-hour time frame?
Bitcoin is trading in the Resistance zonezone($102,130-$100,700) and near the Resistance lines .
In terms of Elliott Wave theory , it appears that a Double Three Correction(WXY) has been completed near the Potential Reversal Zone(PRZ) . Also, the first 5 microwaves of the Impulsive have now been completed .
---------------------------------
Bitcoin traders should monitor today’s Flash Manufacturing (expected 51.1) and Services PMI (expected 52.9) . Both forecasts are already lower than last month’s figures (51.3 and 54.8) , but I see a chance they come in even weaker.
Why weaker PMI is likely?
Slowing retail sales and softer labor data point to reduced consumer demand.
High interest rates are starting to pressure both the production and services sectors.
Regional Fed surveys already showed a cooling in business activity.
If the PMI prints below expectations, the market may anticipate a more dovish Fed, pushing the dollar( TVC:DXY ) down and giving Bitcoin a potential bullish boost.
---------------------------------
I expect Bitcoin to move towards filling the CME Gap($103,730-$102,275) after breaking the Resistance lines , and if the Resistance zone($104,380-$103,060) is broken, we should expect further increases.
Cumulative Short Liquidation Leverage: $103,391-$103,934
Cumulative Long Liquidation Leverage: $100,800-$100,250
Cumulative Long Liquidation Leverage: $97,691-$97,241
Note: Increased tensions in the Middle East or new and important news surrounding this news can make the analysis invalid, so be more careful with capital management.
Note: If Bitcoin can touch $98,170 , we can expect more dumps.
Please respect each other's ideas and express them politely if you agree or disagree.
Bitcoin Analyze (BTCUSDT), 1-hour time frame.
Be sure to follow the updated ideas.
Do not forget to put a Stop loss for your positions (For every position you want to open).
Please follow your strategy and updates; this is just my Idea, and I will gladly see your ideas in this post.
Please do not forget the ✅' like '✅ button 🙏😊 & Share it with your friends; thanks, and Trade safe.
BITCOIN Is this just a giant Bull Flag??Bitcoin (BTCUSD) saw a strong sell-off yesterday in the aftermath of the U.S. strike in Iran and fears of retaliation, but in later hours recovered some of the lost ground. The recovery is being extended into the Asian and early E.U. hours today and the emerging Channel Down pattern already draws strong similarities with the one in December 17 2024 - January 13 2025.
Both broke below their respective 1D MA50 (blue trend-lines) to form a Lower Low, which in the case of Jan 2025, it initiated a rebound that tested the All Time High (ATH) Resistance. See also how similar their 1D RSI patterns are, testing the same Support level too (41.20).
Given that this time the uptrend has been much shorter since the April 07 2025 Low, this Channel Down may be nothing but a giant Bull Flag in the middle of a standard Bull Cycle Leg. Until confirmed with a 1W candle closing above the ATH Resistance though, the medium-term Target is $111900.
Notice also the formation today of a 1D MA100/200 Bullish Cross, the first since November 13 2024.
So what do you think? Is $111900 your short-term Target? Feel free to let us know in the comments section below!
-------------------------------------------------------------------------------
** Please LIKE 👍, FOLLOW ✅, SHARE 🙌 and COMMENT ✍ if you enjoy this idea! Also share your ideas and charts in the comments section below! This is best way to keep it relevant, support us, keep the content here free and allow the idea to reach as many people as possible. **
-------------------------------------------------------------------------------
💸💸💸💸💸💸
👇 👇 👇 👇 👇 👇

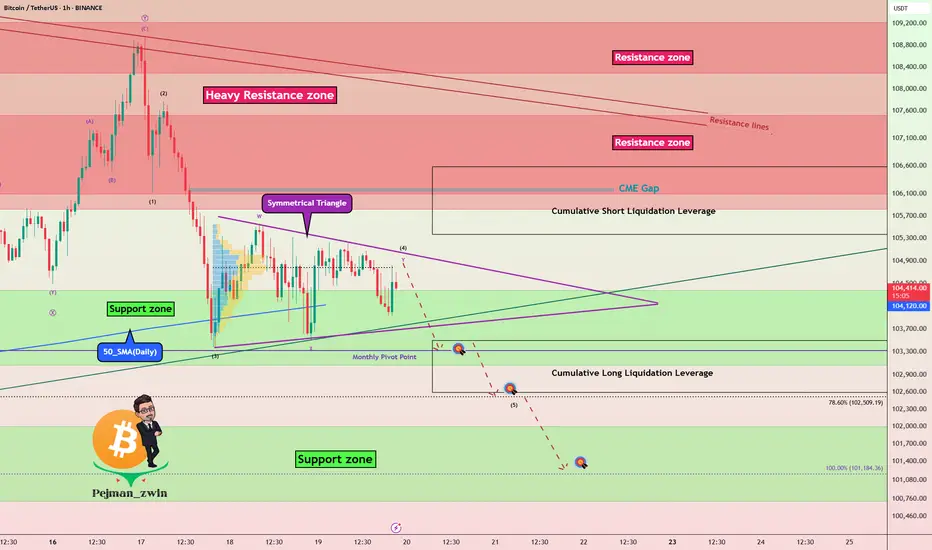
BTC - Key Battle Between Bulls and Bears – Symmetrical TriangleBitcoin ( BINANCE:BTCUSDT ) is currently consolidating within a Symmetrical Triangle , showing indecision among Bulls and Bears around the Support zone($104,380-$103,060) and just above the 50_SMA (Daily) .
From an Elliott Wave perspective, the current range may represent a WXY corrective structure . The market seems to be waiting for a breakout direction , potentially aiming to complete wave 5 after this correction.
The Monthly Pivot Point($103,300) and the presence of significant Cumulative Liquidation Leverage Zones (both Long and Short ) are key liquidity magnets to watch in the short term .
I expect Bitcoin to re-attack the Support zone($104,380-$103,060) AFTER breaking the lower line of the Symmetrical Triangle Pattern and decline to the targets I have outlined on the chart.
Note: Stop Loss: $106,703 = Worst Stop Loss(SL)
Please respect each other's ideas and express them politely if you agree or disagree.
Bitcoin Analyze (BTCUSDT), 1-hour time frame.
Be sure to follow the updated ideas.
Do not forget to put a Stop loss for your positions (For every position you want to open).
Please follow your strategy and updates; this is just my Idea, and I will gladly see your ideas in this post.
Please do not forget the ✅' like '✅ button 🙏😊 & Share it with your friends; thanks, and Trade safe.
BITCOIN This is the long-term picture. Don't get distracted.Bitcoin (BTCUSD) has been consolidating lately after making a new All Time High (ATH) last month and this is already making part of the market nervous over whether that's the Cycle Top or not.
This is one of those times when it would be best to ignore the short-term noise/ volatility and stick to the long-term picture. And that's exactly what's shown on this chart, with BTC on the 1M time-frame showing the incredible symmetry among its 4-year Cycles, with Bear Markets lasting 12 - 13 months and Bull Markets 35.
Based on that, this Cycle's Top is expected to be priced by October (2025). This also matches the Sine Waves as implied by the 1M RSI, which as been trading within a Channel Down (diminishing returns) since Bitcoin's inception.
So do you also think that we have around 4 months before the market tops? Feel free to let us know in the comments section below!
-------------------------------------------------------------------------------
** Please LIKE 👍, FOLLOW ✅, SHARE 🙌 and COMMENT ✍ if you enjoy this idea! Also share your ideas and charts in the comments section below! This is best way to keep it relevant, support us, keep the content here free and allow the idea to reach as many people as possible. **
-------------------------------------------------------------------------------
💸💸💸💸💸💸
👇 👇 👇 👇 👇 👇

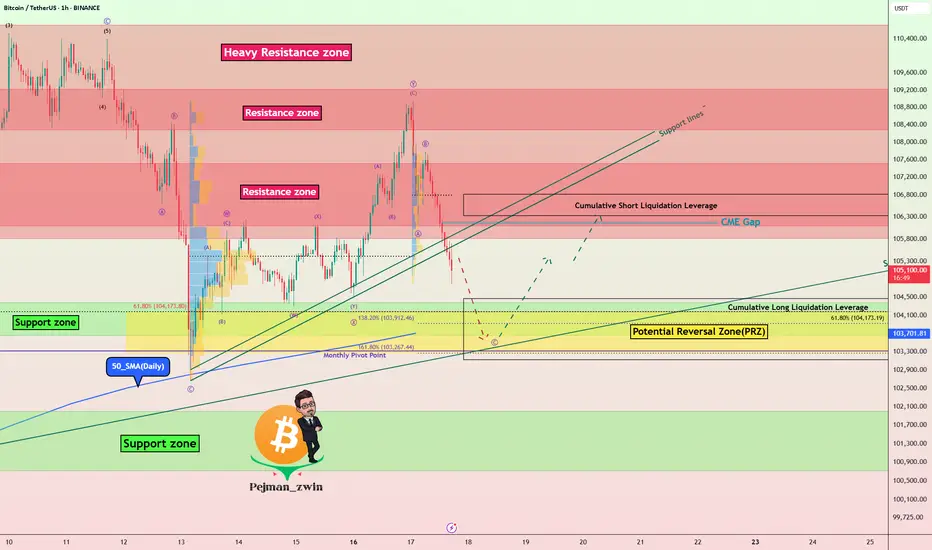
BTC Approaching Key Confluence Zone: Pivot + PRZ + LiquidationsBitcoin ( BINANCE:BTCUSDT ) appears to have broken the Support lines and is currently declining .
In terms of Elliott Wave theory , Bitcoin appears to be completing a corrective wave C . The corrective wave structure is a Zigzag Correction(ABC/5-3-5) .
I expect Bitcoin to start rising again from the Support zone($104,380-$103,660) , Potential Reversal Zone(PRZ) , Cumulative Long Liquidation Leverage($104,471-$103,124) , Monthly Pivot Point , Support line , and 50_SMA(Daily) , and the small CME Gap($106,190-$106,150) will also fill.
Note: Stop Loss: $102,520
Please respect each other's ideas and express them politely if you agree or disagree.
Bitcoin Analyze (BTCUSDT), 1-hour time frame.
Be sure to follow the updated ideas.
Do not forget to put a Stop loss for your positions (For every position you want to open).
Please follow your strategy and updates; this is just my Idea, and I will gladly see your ideas in this post.
Please do not forget the ✅' like '✅ button 🙏😊 & Share it with your friends; thanks, and Trade safe.
BITCOIN All boxes checked. Couldn't be more bullish than this!Bitcoin (BTCUSD) has filled numerous bullish conditions with the latest being holding the 1D MA50 (blue trend-line) as Support. This is basically the 3rd time testing and holding it since June 05. Even if that doesn't hold, we have the 1D MA200 (orange trend-line) directly below it as the ultimate long-term Support.
This trend-line just so happens to be exactly on the neckline of the Right Shoulder on the long-term Inverse Head and Shoulders (IH&S) pattern that has been in development since December 17 2024.
On top of all these, the market also formed a 1D Golden Cross a month ago, always a strong long-term bullish signal. IH&S patterns typically target their 2.0 Fibonacci extension, which sits at $168000.
Is that another indication that Bitcoin is going after 150k at least on its next run? Feel free to let us know in the comments section below!
-------------------------------------------------------------------------------
** Please LIKE 👍, FOLLOW ✅, SHARE 🙌 and COMMENT ✍ if you enjoy this idea! Also share your ideas and charts in the comments section below! This is best way to keep it relevant, support us, keep the content here free and allow the idea to reach as many people as possible. **
-------------------------------------------------------------------------------
💸💸💸💸💸💸
👇 👇 👇 👇 👇 👇

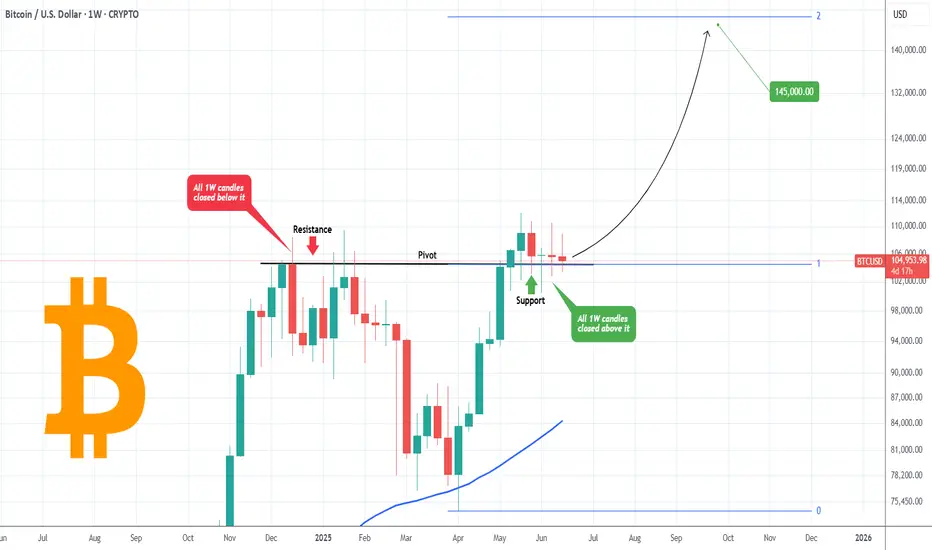
BITCOIN The secret trend-line that no one notices..Bitcoin (BTCUSD) was under heavy selling pressure yesterday and even the 1D time-frame turned marginally bearish. What most seem to ignore however is the larger picture. On the 1W time-frame, BTC has managed to close the last 5 weeks above the Pivot trend-line.
What that trend-line is? It is the level that initially started as a Resistance from December 09 2024 to January 27 2025, closing all 1W candles below it, despite occasional candle wicks breaking above it. That confirmed it's status as a Resistance at the time.
Now we see the opposite, five straight 1W candles closing above that Pivot line. Check in particular, how flat the last two 1W candles closed, showcasing no just the high volatility that the market is under in the past weeks, but also the same amount of sellers and buyers existing in the market (neutral).
This is an indication that this is a consolidation phase, preparing BTC for the next rally. If we place the top Fibonacci level (1.0) on that Pivot, we get the 2.0 Fib extension just above the $145000 mark. That gels perfectly with various other studies we've conducted showing a similar long-term Target.
So do you think the Pivot line will hold and push Bitcoin to $145k? Feel free to let us know in the comments section below!
-------------------------------------------------------------------------------
** Please LIKE 👍, FOLLOW ✅, SHARE 🙌 and COMMENT ✍ if you enjoy this idea! Also share your ideas and charts in the comments section below! This is best way to keep it relevant, support us, keep the content here free and allow the idea to reach as many people as possible. **
-------------------------------------------------------------------------------
💸💸💸💸💸💸
👇 👇 👇 👇 👇 👇
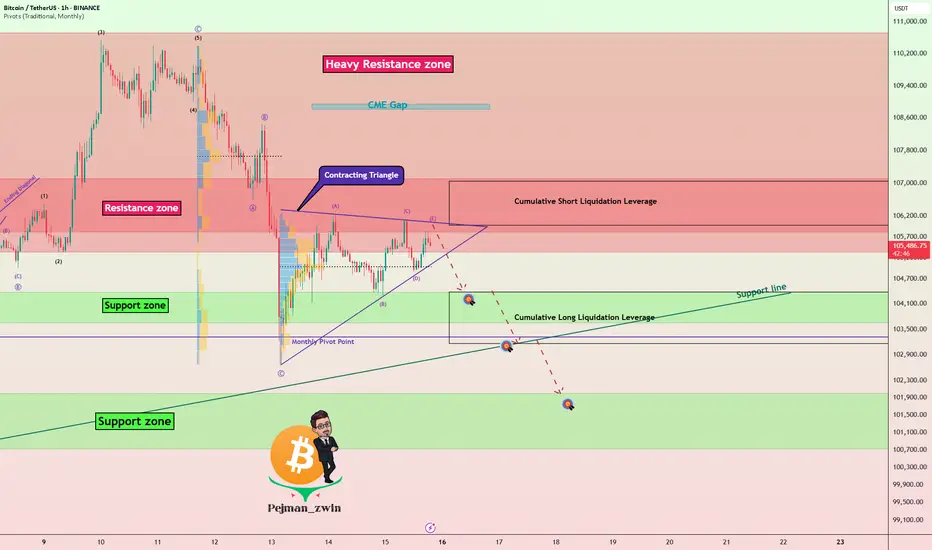
Geopolitical Tensions & Technical Pattern Point to BTC Decline!Bitcoin ( BINANCE:BTCUSDT ) fell about -5% after tensions between Israel and Iran escalated. Unfortunately , these tensions are still escalating, but Bitcoin has managed to recover about +3% so far.
Bitcoin is moving near the Resistance zone($107,120-$105,330) and Cumulative Short Liquidation Leverage .
In terms of Elliott Wave theory , it seems that Bitcoin is completing a corrective wave . The corrective wave structure could be Contracting Triangle . In case of a sharp decline in Bitcoin again, we can consider these waves as five descending waves (if Bitcoin does NOT touch $106,600 ).
I expect Bitcoin to start declining again and at least drop to the Support zone($107,120-$105,330 ). The second Target could be the Support line and Cumulative Long Liquidation Leverage .
Note: If Bitcoin can break the Resistance zone($107,120-$105,330), we can expect further increases in Bitcoin.
Please respect each other's ideas and express them politely if you agree or disagree.
Bitcoin Analyze (BTCUSDT), 1-hour time frame.
Be sure to follow the updated ideas.
Do not forget to put a Stop loss for your positions (For every position you want to open).
Please follow your strategy and updates; this is just my Idea, and I will gladly see your ideas in this post.
Please do not forget the ✅' like '✅ button 🙏😊 & Share it with your friends; thanks, and Trade safe.
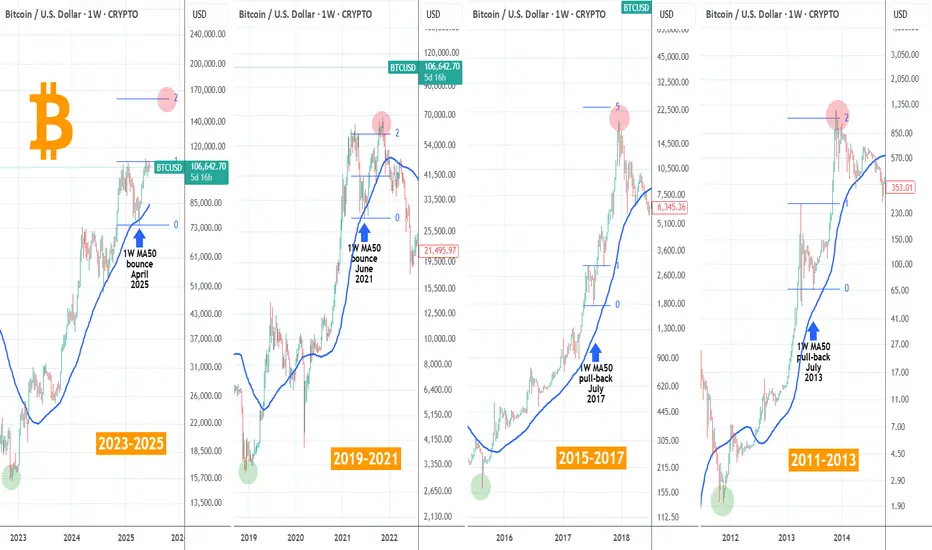
BITCOIN Is exactly where it should be this time on every Cycle!Bitcoin (BTCUSD) has made a new All Time High (ATH) last month, following the April 2025 rebound on the 1W MA50 (blue trend-line). No matter how odd this price action may look to some, BTC is simply replicating the pattern it has during every past Cycle around this time of its final year.
As you can see, besides April 2025, it made 1W MA50 pull-backs and rebounds on June 2021, July 2017 and July 2013. The consistency is remarkable and since we are already now half-way through June, historically Bitcoin only went upwards!
In fact, those pull-backs have been the strongest the market saw before the Cycles peaked on each and every occasion. Two Cycles peaked just above the 2.0 Fibonacci extension while in 2017 it peaked a little below the 5. Fib ext. This indicates that the minimum Cycle Top we can be expecting towards the end of the year is $160000 (marginally below the 2.0 Fib ext).
Many studies point towards the same Target. Do you think it's inevitable? Feel free to let us know in the comments section below!
-------------------------------------------------------------------------------
** Please LIKE 👍, FOLLOW ✅, SHARE 🙌 and COMMENT ✍ if you enjoy this idea! Also share your ideas and charts in the comments section below! This is best way to keep it relevant, support us, keep the content here free and allow the idea to reach as many people as possible. **
-------------------------------------------------------------------------------
💸💸💸💸💸💸
👇 👇 👇 👇 👇 👇