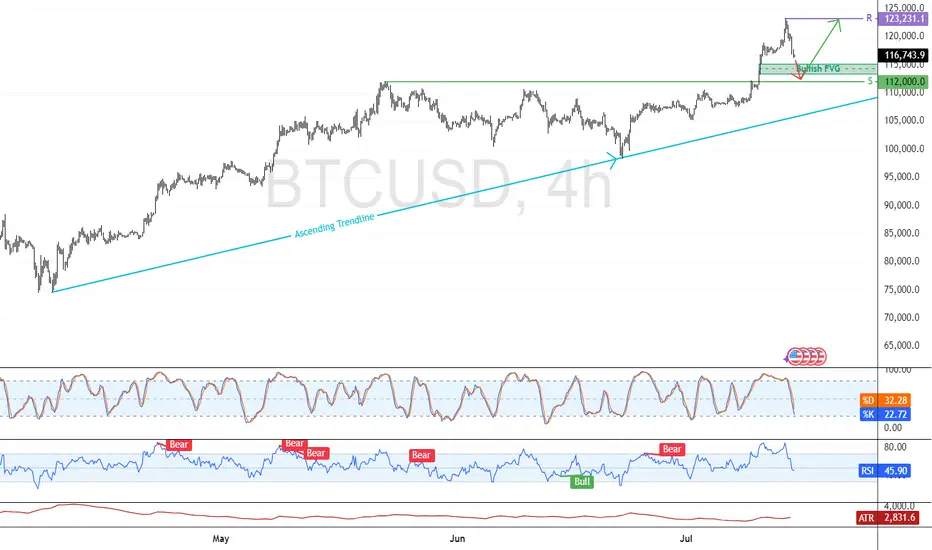
Bitcoin: Support at $112K Holds Key to Bullish ContinuationFenzoFx—Bitcoin is bullish, trading above $112,000.0 after forming a new all-time high at $123,231.0. The current dip may offer a strong reentry if $112,000.0 holds as support, aligning with a bullish fair value gap.
Price remains above the ascending trendline, reinforcing the bullish outlook. If momentum continues and BTC breaks past $123,231.0, the next target could be $130,000.0.
A fall below the trendline would invalidate the bullish setup.
Bitcointechnicalanalysis
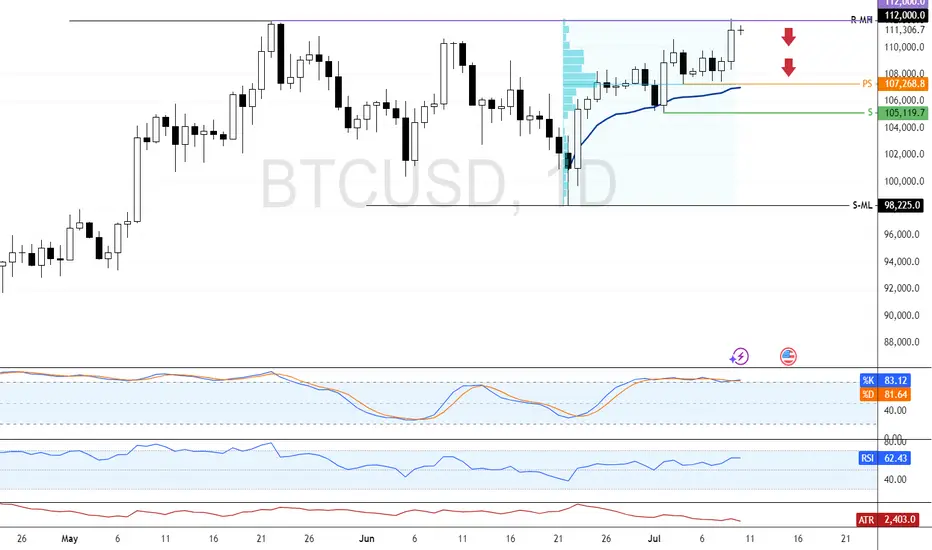
Bitcoin Tests Record High as Momentum FadesBitcoin is bullish, testing the all-time high at $112,000.0. Stochastic shows an overbought reading of 83.0, indicating momentum may stall.
As of now, BTC trades slightly below this level. Since it's the first test of $112,000.0, consolidation could follow. If bulls fail to break higher, price may dip toward $107,268 and $105,119.0 supports.
Something for the weekend? Bitcoin Daily-last for 2 weeks
PA has finally risen above that Fib circle ( falling diagonal arc) that has rejected us since Early June.
PA is currently retesting this as support now and we will hopefully manage to remain above.
Should this fail, we have the lower trendline of the newly formed rising channel to use as support.
Should that fail, we have the 236 Fib circle (Red) and the next rising support line around 102k, depending on sharp the drop is.
If we find support where we are now, we have a good run back to the current ATH line ( Blue Dash line)
The real test is that 236 Fib circle that is dropping form around 114K
99% of the Time, a 236 Fib circle is resistance and if it rejects PA, the Current ATH line is very close below.
This will either create a bounce or a sharp drop. If we get stuck between the 2, we have that APEX around 25 July..PA always reacts BEFORE the Apex
And I am back on the 19th Jully, just in time I hope ;-)
So, The MACD is currently above neutral on the Daily (Below)
The weekly is much the same but on the 4 hour, we are currently dropping towards Neutral and Tomorrow ( sunday) will tell us if it bounces or not.
We are early in July, As mentioned in the monthly report I posted earlier this week, we could see a larger Green candle by month end, though is is not a promise obviously.
But the MACD could support this idea
We just have to wait and, for me, that is what we will do until around Q4
We could still see smaller gains over the summer period but the Bigger moves are in Q4
That is what I am waiting for....and yet, at the same time, I am ready if it comes earlier
stay safe

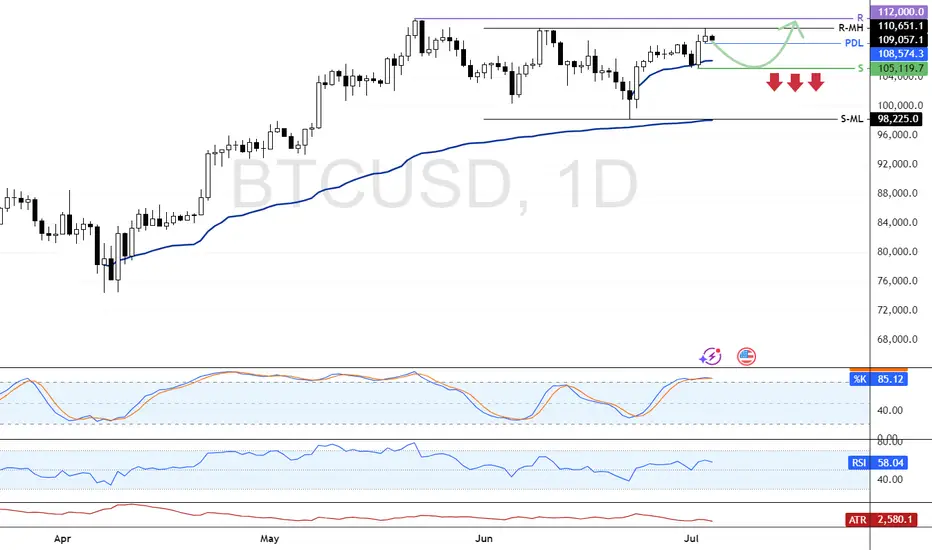
BTC Eyes $105,119 Support Before Targeting $112,000FenzoFx—Bitcoin is trading just below the previous monthly high at $109,110.0, while the Stochastic remains overbought for the third consecutive day, signaling short-term overheating.
Although the broader trend is bullish, a pullback toward the anchored VWAP at $105,119.0 is expected. This level may offer a low-risk reentry, with a potential move toward the all-time high at $112,000.0.
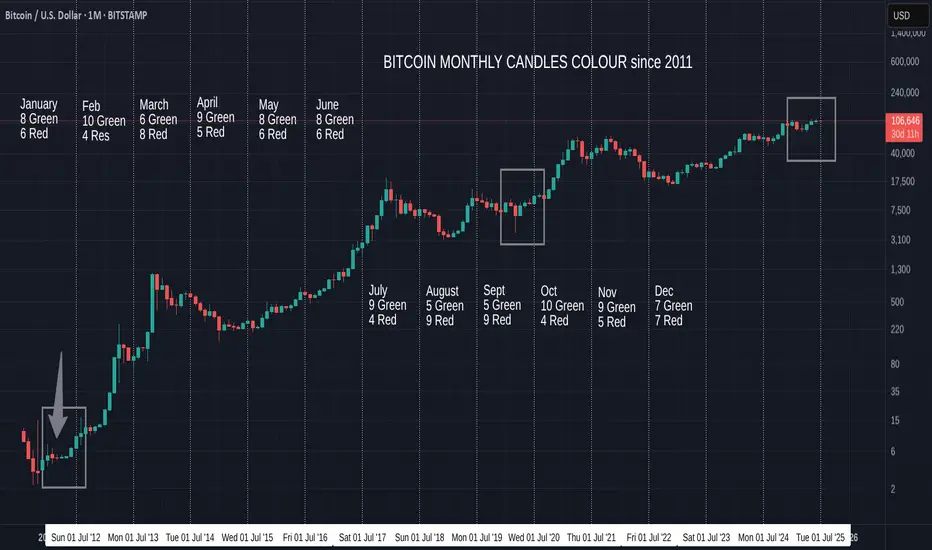
Bitcoin Monthly Candle Close colour and patterns since 2011
At the beginning of June , I wrote this
""On only 2 occasions have we had a GREEN JAN, RED FEB, RED MARCH, GREEN APRIL
And Both of them were on the way to ATH. (Boxes )
On both those occasions we also had a GREEN MAY, though the gains were minimal and one was followed by a Green June and the other by a Red June."
We just got the GREEN June and so this draws my eye to the sequence on the left, ( arrow )
If we are to follow this, then July should be a larger Green (Arrow) - BULLISH
In-fact, in both the sequences we have been following ( boxes), July was GREEN- BULLISH
And using just the month candle colours, we have a higher chance of another Green candle, with July having had 9 Green to 4 Red previously. - BULLISH
However
Of the previous 8 Green June Closes , only 3 went to a Green July - BEARISH
And I have to say, on NONE of the previous Green Junes were we so close to the current ATH.
July 2021 being the closest with a price at 41K, around 18K below the current ATH at the time.
We are currently only around 200 usd below Current ATH
This adds enormous resistance to the ability to rise
I wanted a RED June because I felt it was more sustainable and would lead to a cycle ATH at the end of the year. As can be seen in the middle Box
If we look back toward the 2012 Box on the left, we may now get a Hot July / August , September and then a Cool off for October, November & December.
But something tells me this will not happen.
The Candles for our current cycle in April, May and June are diminishing in size, the opposite of 2012
But they are similar to the 2020 box, except for the red June close.
This could lead to the desired "Cooling" in August & September and a new lift off in autumn.
And if you look at the chart Candle Colour Count, , August and September are usually RED by some majority
This also gives us the Bigger Green July candle that the "Odds" point towards.
So, as ever, we have to wait and see how this plays out.
Odds in favour of a Green July using previous cycle Data
PA position just below current ATH could lead to a slightly Bearish out look in the short term.
And if you are hoping to see ALTS Rally, PLEASE keep your eye on the BTC.D chart
This also points to wards BTC ATH in Q4 this year
And then, we have the BIG question.......Will we ever see a Classix Bear again ?
With so many Holding Bitcoin LongTerm.....How would a Bear market arrive ?
BUY BITCOIN
HOLD BITCOIN
But, as ever, we just have to wait and see,
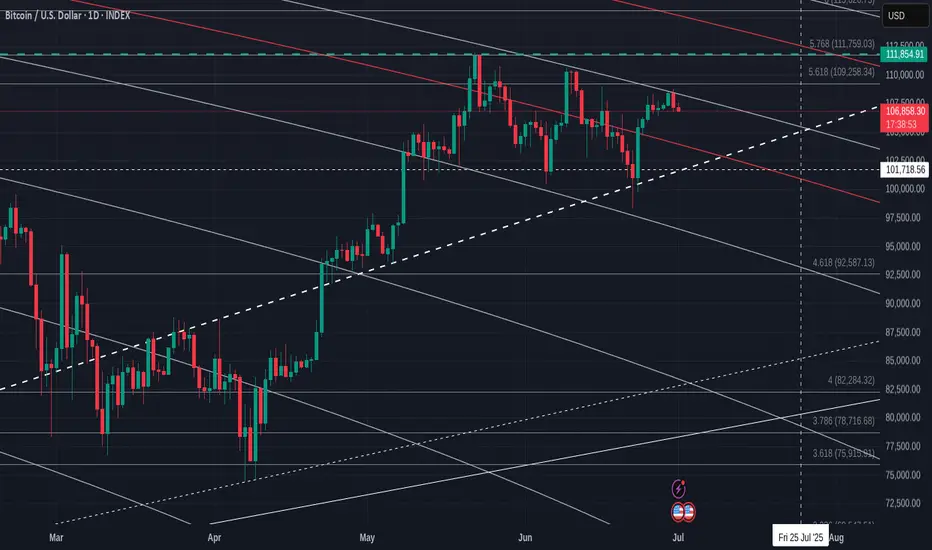
Bitcoin Daily in a large pennant with apex end of July
Bitcoin is once again getting rejected off the Fib circle just above.
This is also just under a 618 Fib extension and so a combined rejection zone.
Beneath this, we have support on that Bold dashed line. This is a Local line of supprt but has strength.
And so, we find outselves in apennant again and that apex is around 22 July.
PA tracts before the apex.
As will be explained in the monthly chart I iwll post later, this all points towards a Calm July, possibly RED month.
PA does however, have the ability and strength to push higher if the Bulls decide to make a move.
The MACD
The Daily MACD is just above Neutral and has enough room to move.
So, if we drop, support is arouns 103K
If we loose that then 100K and then we land on that red 236 Fib circle that will offer a sliding line of support.
But I do not think we will get there just yet
Enjoy
Bitcoin Eyes $110K Target Above Key Support LevelBitcoin trades slightly below last week’s high near $107,660.0, while RSI 14 shows bearish divergence without a clear downward move.
Immediate support is at $107,230.0, and resistance at $108,550.0. If BTC closes above resistance, a rally toward $110,651.0 may follow. The bullish outlook remains valid as long as the price stays above $104,681.0.

Bitcoin Climbs Above $107K with Overbought Signals in PlayBitcoin closed above the 107,792 resistance after breaking the previous day's high. RSI and Stochastic indicators show overbought conditions, signaling short-term overpricing.
BTC may test the $109,000.00 resistance next, followed by a potential pullback toward $104,618.00, offering a favorable entry point for bulls.
Bitcoin Rebounds Above $105K After Liquidity SweepFenzoFx—Bitcoin swept liquidity below $100,703.0 and rebounded to around $105,400.0, just above the volume profile point of interest.
Immediate resistance lies at $106,135.0. A break above this level could lead to a retest of $107,702.0. However, if resistance holds, BTC may consolidate toward $102,662.0, supported by Stochastic overbought signals.

Bitcoin Closed week RED and opens Green but is back in channel
As the title says, BTC PA has fallen back in channel that offers a potential low in the High 80K should confidence fail.
PA also lost support on the Local 2.618 Fib extension.
This is a shame and poses potential problems reclaiming that.
I will say, that I do not consider this a long term Bearish beginning but it could certainly add to the "Calm" Summer I have talked about.
I say "Calm", that does depend on the world not entering a level of Madness.
The Zoomed chart below shows more detail
Here we can see clearly how PA got rejected off that upper trend line, fell through the 2.618 and is currently being rejected by it.
The potential for a further drop does exist and if we repeat the "Pattern" we have since the beginning of 2024, of bounce off Lower trend line, get rejected from Upper zone, re test lower as support and bounce again, we can expect to revisit 89K
This idea is supported from this LINEAR Daily chart
The dashed Trend line that is arrowed has origin in Sep 2024 and was also used again in April 2025.
That intersection the arrow points to is the intersection with the current supporting Fib circle at around 88500 USD
None of this is certain but these levels exist as support.
PA also has the ability to move higher
The Weekly MACD below shows us how MACD is turning down towards its signal line ( red)
We did this before in Jan 2024 ( Arrow) and The MACD bounced.
We talked about this possibility a few weeks ago But on a Daily MACD, things do look a little different.
The FEB 2024 looked like this, Bullish, rising and above Neutral
Currently, the Daily MACD looks like this
We just fell below Neutral and the Signal line just hit it
We may seea bounce but we need to have the idea that this may continue to drop a little further.
But the White bar on the Histogram shows us some recovery is currently in progress
We will have to watch the rest of this month closely. This time next week is last day of month.
I have mentioned a number of times that a small RED Month candle would be potentialy good.
We are currently Only just GREEN, so a further Drop in price is actually almost expected this week.
Interesting days ahead
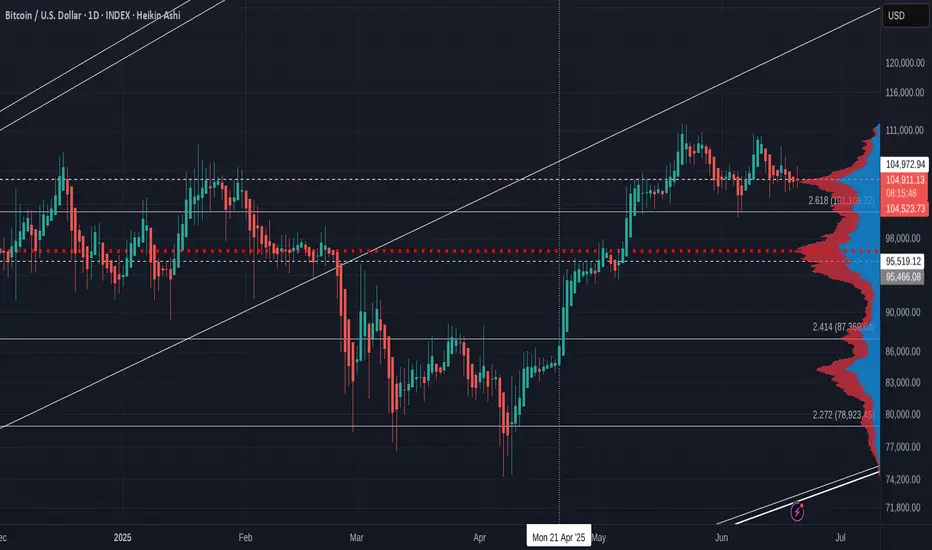
Bitcoin Daily, Something for the weekend Sir / Madame ?This will be the main chart and 3 indicators that could be telling us something.
Main chart is the Heiken Ashi. Each candle starts in the centre of the previous one and so we get rid of noise and get a good understanding of possible Trends.
And Right now, CALM is not the word ! Candles are getting smaller and smaller.
However, we do seem to be forming a bullish pennant with an Apex at the end of the month.
PA always reacts before the Apex.
Other things to note here is that we are now using the previous line of resistance as support. Look back to Dec 2024 to Feb 2025. It was this line that put as back down to 75K
We have tested this 4 times in a small way But not in a real Meaningful Way yet.
Do remain Cautious.......but that 2.518 Fib extension should hold us in place if we drop but there could be a much deeper drop.
But lets take this step by step as there are some Very Bullish signs to.
The ADX chart below shows us that Change is near.
Remember, ADX ( yellow ) NEVER shows trend direction, just trend strength. As you can see, it rarely drops much further below this point and does not spend to long here.
SO, current trend is Weak and a new trend is likely in the near future ( this could be tomorrow or in 3 weeks..near future is a wide window..but it is not 2 months or more)
The DI + ( orange ), positive Directional price Index, and the DI - ( red) , negative Directional price Index, are also low, showing no real price action.
This can happen for longer periods of time and it is impossible to say which will rise, However, as we can see, the price movements have not been huge and so to expect a sudden Massive Dive, as some are suggesting, is not really backed by anything.
But we should never say never. Be cautious
Accumulation / Distribution chart below
What is nice about this, is simply that Accumulation is still the MAJOR movement. The majority are still accumulating and so the idea that we maybe in a Bear market is almost Dismissed. People would not accumulate an asset that is about to Dive for a long eriod of time....Normally.
There has been distribution, as marked by the RED zones. This is heavier distribution and as you can see, this Stopped at the beginning of this month, having begun when we reached the high towards end of 2024.
So many thought that was cycle ATH
They have seen the error of their ways BUT, Again, remain Cautious till we see a bigger move higher.
And now my favorite, MACD
And for me, this is where we will see the decision being made. We are approaching the Neutral zone
Last time we bounced off this area was in October 2024 and we went from 70K to 109K
BUT remain cautious, we have every possibility that we may fall through the neutral zone for a while too....But we are in an area that could show us a time to move.
This is a LINEAR Bitcoin Daily chart
And those descending lines are FIB Circles and you can see how PA often runs along them.
You can also see how we are in a Pinch, a tight Squeeze right now ( arrow) with Horizontal line of support and the rejecting red 236 Fib circle.
That Apex is, again, at the end of the month.
So, to conclude, we are certainly heading towards a Move and possibly a new trend.
I like to think this will be Bullish but there are plenty f reasons for Caution.
I will remain with my Monthly charts that suggest June may be RED and that after than we will see more Green.
A Dip is possible and I have New Buy orders around 98K incase PA wicks down to them but there is NO guarantee this will happen...OR if it does, that it will stop there....
We just have to be prepared.
Stay safe
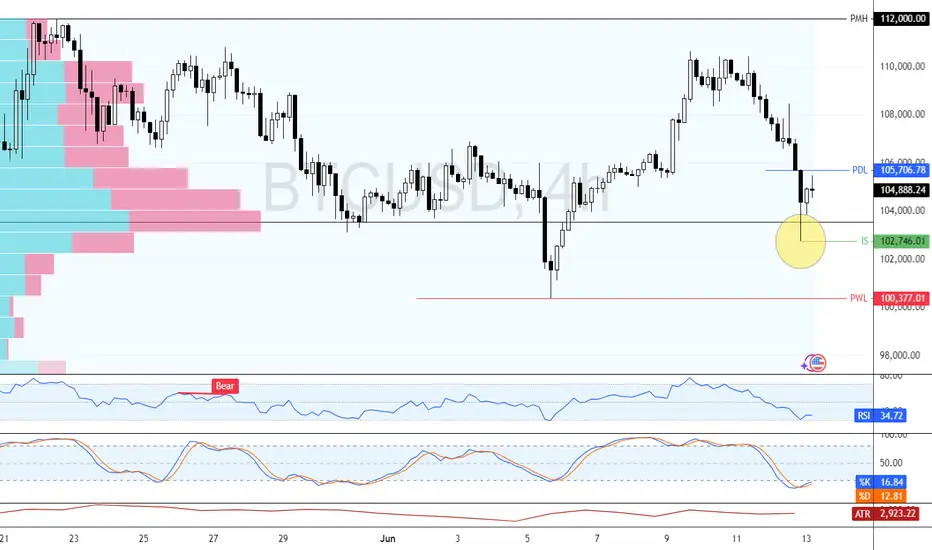
BTC/USD Faces Key Support—What’s Next for Bitcoin? FenzoFx—Bitcoin dipped from its $112,000 monthly high, now trading near $104,900. Liquidity was swept, forming immediate support at $102,746.
Stochastic signals an oversold market, suggesting potential consolidation or an uptrend resumption. BTC/USD must close above $105,706 for bullish momentum, targeting $112,000.
A rejection at $102,746 may invalidate bullish outlooks, driving BTC toward $100,377.
Bitcoin life cycle-stage One ending-Next cycle has to start NOW
There are 3 things to see in this chart
1) The Orange Arc of resistance. I have talked about this previously but to recap a little, it has its origins in Oct 2009 and has rejected EVERY ATH since then, as you can see on the chart. The Arc itself is part of a Fibonacci Spiral.
This Arc has begun to Squeeze PA against the lower trend line, that was formed in 2011.
And we are now in a position where PA MUST react or get pushed below the Long Term line of support.
This could be called Make or Break time for Bitcoin.
The Apex of this pennant is around Jan 2026
PA always reacts before the Apex.....99% of the time.
2) The Vertical Coloured bars are Trend Based Fibonacci Time, It begins on the 1st ATH in the channel that Bitcoin created. This channel is shown in the chart below
See how the Runs to the 2017 & 2021 ATH were all in a Bullish Green zone and how PA never retouched the lower trend line of support in this time
Since Mid 2021, we entered a Bearish Zone.
On the main chart, you will notice how this Fib Time has just ended.
3) The Trend based Fibonacci Extensions. Every single ATH rejected off a Fib extension.
The Root is at the 2009 Low and 1 is at the First ATH in the Bullish Fib time Zone.
The numbers here are all based off the 3,6,9 number sequence.
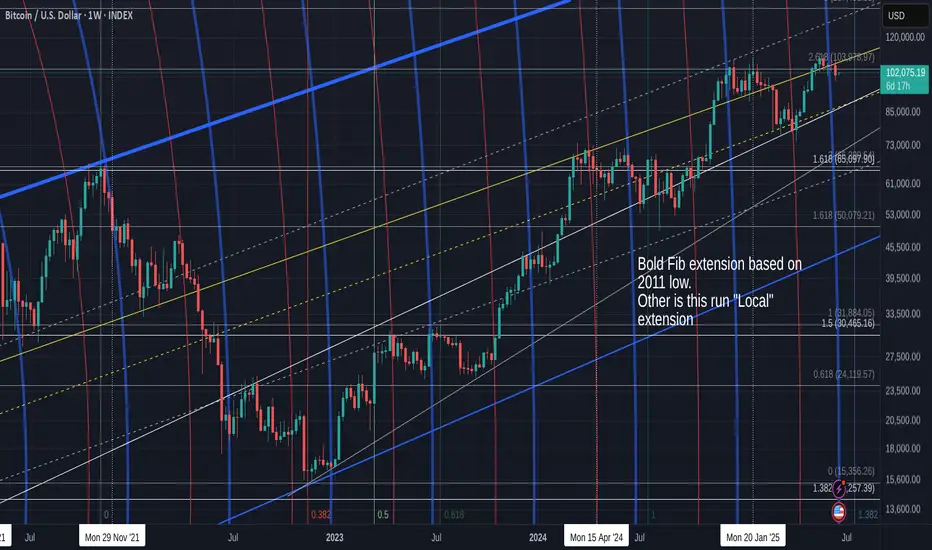
Lets look a little closer at the weekly chart
As we can see, PA got repeatably rejected off this orange Arc of Resistance and Current PA has been up there, trying to break through since 2024.
Many people have also commented on how PA has been so subdued this cycle and could this be reflected in the Fib Time showing us that we are in a Red Bearish Zone.
See how, from Mid 2021, when we entered a Strong Red zone, PA took a Deep dive off the Nov 2021 ATH.
Also note how this zone ended in late 2022 and in Jan 2023, PA began its current cycle Run. See the change in Colour ?
And Currently, while Bitcoin tries to break out of this squeeze, we were in a Red zone again....that just ended.
AND we can also see that we have not yet reached the 6 Fib Extension at 120,251 usd
The situation we face here is that if PA gets rejected off that Fib line, having just broken through the Arc, we could get pushed right back down under the Arc again. It is VERY STRONG RESISTANCE
This next move from Bitcoin HAS to be strong enough to take us up to the 9 fib line at 180,391 usd at a minimum. This way we can use the 6 Fib extension as support when PA cools off from a big push and so remain above the Arc and begin the Next long term cycle.
The Daily chart below shows us where we are right now
You can see how PA has repeatably tried to break above the Arc and been rejected Firmly Every time...so far, PA has avoided going right back down to the Lower trend line and has remained in near distance to this Arc..But we are running out of Time.
Recent attempts by PA have been Strong and I am sure that we will make it over but the real question is can we also get over that 6 Fib extension and stay above.
The weekly MACD certainly has enough strength to cope
Should we have a subdued Summer trading on Bitcoin, we will see this MACD cool off and be stronger before a sustained push near Autumn maybe.
To conclude, Bitcoin is under pressure to move out of its First Full Cycle.
It is getting Squeezed and now it is time for Bitcoin to prove it can cope with its new found "Adulthood"
The Next Big push, maybe later in the year, could very realistically reach 200K or more and this would place us Above that 9 Fibonacci extension I talked about earlier.
Of course, events could change and we could see PA collapse back below the Arc.
If this happens, all is NOT lost but it would certainly weaken the case for Long Term holders to continue doing so.
This then could create a Snownall effect and prices may tumble....And I will buy MORE....
Either way, we are in a HUGE moment for Bitcoin and I am privileged to be able see this all unfold...
Lets see what happens but, for me, I am Still VERY Bullish though Cautious....
We may have to revisit low 70K in the near future if Pa cannot get over this Arc and the 6 Fib extension

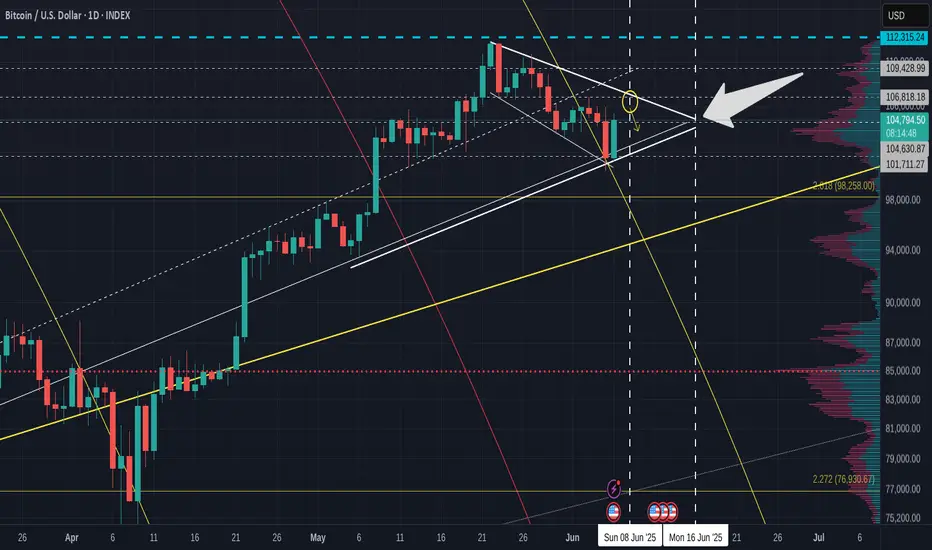
Bitcoin DAILY & 4 hour charts show possible push in 10 days ?
First of all SORRY for all the lines.
This is a working chart but they are all relevant to this post.
Main chart is DAILY and shows ua the Pennant that we appear to be printing with the descending channel inside. The diagonal line falling is the Fib Circle we recently broke through.
See how, once above the fib circle, we slid down the outside, using it as support, as we often do.
Then we hit another line of support and that created this recent push higher.
Should we continue, we will most likely go to the upper trendline, towards that circle. Circle center is around Sunday 6th.
While we are still on the daily, see that Pennant Apex...that is a Week on Sunday, the 15th.
99% of the time, PA reacts BEFORE the apex.
Should things continue, we can expect to see a rise till end of weekend, Rejection back to lower trend line and then a Rise and maybe a push Out of the pennant to new highs.....OR, and I think this is very probable, we go back to around the ATH line ( blue Dash) and Dip back down again.
It is worth remembering that we have inflation data being released in the USA next week.
People will likely wait to hear ths before making to many big moves.
The Daily MACD offers some guidence on this also
MACD nearly back on Neutral and could bounce. The Dashed line is this sunday.
MACD could continue to drop below neutral, we shall have to watch this closely.
As I mentioned, in the short term, BTC likely to reach for this circle in the 4 hour chart below.
I will admit, I expected PA to reach this point in a differnent way as posted earlier in the week, But, Hey, we still getting there..
Should we get rejected there, as I expect we will, then a revisit to 103K before a push back.
But given the inflation figures, things could get very volatile next week so CAUTION
We can see on the 4 hour MACD how we have already been rejected of Neutral once and we are heading there again
The potential to push through the neutral line exists but.......
I do expect some volatility and so we need to be aware things could change rapidly.
The inflation data is a key. Depending on if it is drooping, rising or flat, this WILL effect the situation with regard to the FED Rate decision later this month.
So, we wait, with caution and expectations
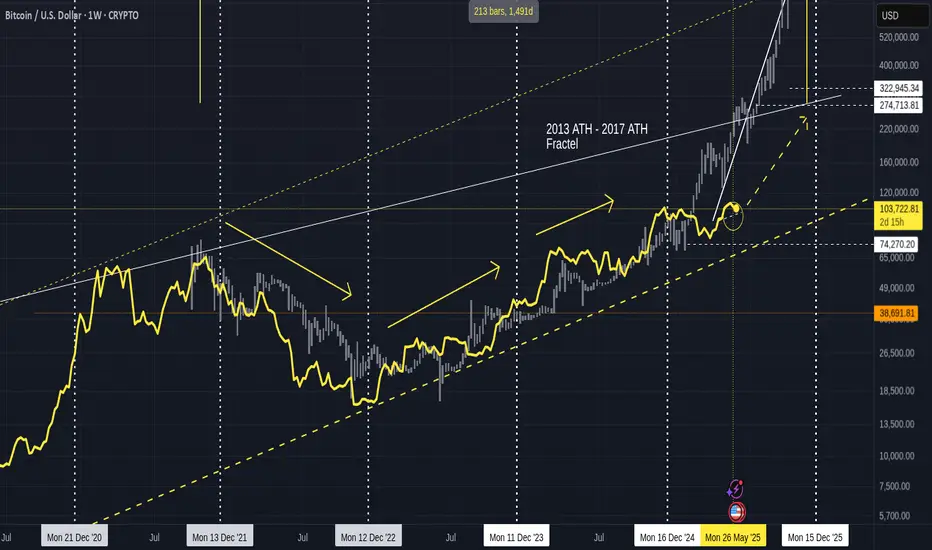
Quick BITCOIN update using old Fractal chart - a small red June
Bitcoin appears to be taking a rest when it is strictly not required.
We are heading towards the 2nd dashed arrow, which as I pointed out months ago is a very possible and more realistic path for Bitcoin to take this cycle.
We have left the 2013 - 2017 Fractal and yet are likely to follow the idea of moving higher to a new ATH from this level off the Fractal.
PA entered that circle I drew back in Feb and is still in it right now, as we can see in the chart below
We can also see how PA has bounced off the 50 SMA on this daily chart.
This does NOT guarantee a continued move higher but it may offer some levels of support.
Should this fail, we do have various levels of support down to around 94K
I will refer back to a previous post and mention that to some extents, I am expecting a RED June. This does not need to be a Big candle, just 1 usd less than the open price wil create that.
104648 was the open price, so, we can easily stay above 100K and create that red candle.
Why do we want a red candle..?
Because, to put it simply, statistically, we have a better chance of continued monthly Green candles after a red june this time
I will attach the chart below so you can read about this in more detail.
This may or may not be good for ALTS>.... but I do not have many now.....just my preference
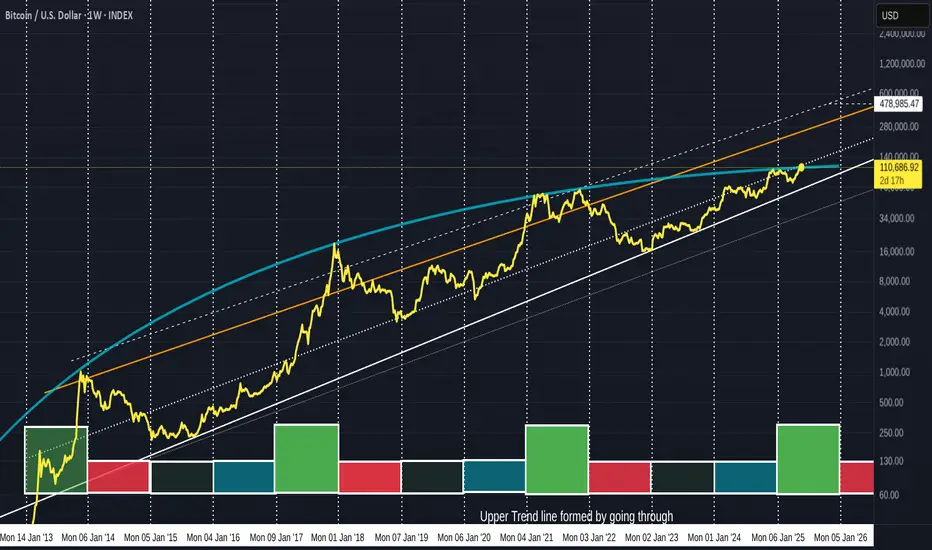
Bitcoin-is that it for now ? Lazy summer, take off in September?
Not posted this chart for a while but we may find it has become Very relevant to what to expect for the next few months
First thing to note is that PA is once again in TOP of range box and ALSO got rejected off the Long Term Blue line that has rejected BTC PA ATH since 2017. This also coincidened with the 1.618 Fib Extension.
Rejection here was highly likely and given how PA had pushed up, it is not surprising to see PA at least taking a breath.
For me, even though we do have the ability to push higher, I am not to sure we will just yet.
The weekly MACD could offer some credence to this idea
The Arrow points to an area that could turn out to be similar to what we are doing now.
The MACD has begun curling over after a prolonged push higher. While There was strength left, PA took a breath and regrouped.
The Chart below shows this period and how BTC PA reacted...and is circled
This was in Dec 2023 to Jan 2024.
PA had just had a sustained push higher and needed a break.and following a 7 week range, PA moved up another 67%
7 weeks from now brings us to near August.
There are charts that point towards a move in August / September
Here is another chart that offers some confluence to this idea.
The Dotted line is a line of support that PA has used as support numerous times this cycle and currently, is almost bang on the 50 SMA. Assuming that PA goes back down to that and bounces again, a 67% rise takes us back up to the Top of Range
Should we drop that far, to the 50 SMA again, we are in the 92K - 95K zone, scaring a LOT of people, wrecking Leverged players and putting Fear everywhere.
PERFECT FOR BUYING
This area also happens to be the 1.382 Fib extension on the main chart, the next Major line of support below us currently.
Should we fall through that, we reach the Bottom of Range and the intersection with the 50 SMA in.......August
So, we have to wait and see. We can push higher now but to do so would require breaking through that long term Blue line of resistance. I am not sure we can do that just yet.
Also, Should we post a RED June candle, Even a small one, the ideas in the Monthly candle post I recently posted also back up the idea of a lazy summer...... and a move higher around Mid to late August
Stay safe

Bitcoin Dominance, BTC ATH and ALT Seasons since 2017-some facts
There is little doubt now, that this Crypto cycle is very different from previous cycles and the main reason for this is the Bitcoin Dominance ( BTC.D) of the Market.
The reasons for this Dominance is complicated but we can certainly point towards the arrival of ETF's as one of the principle factors.
Corporations simply Buy Bitcoin, Hold it and Trade the ETF's - The Key Principle here being that the Coins are HELD Long term.
As we can see from the main chart, we have a key point in the BTC cycle called the Bitcoin Halving. To many extents, the explanation of this is not relevant right now.
But what you can see is how, previously, after the BTC Halving, we saw a drop in BTC.D,
This was due to the money Flow out of BTC and into ALT coins.
As more ALT coins were bought up, the demand drove the price higher and so their dominance increased, driving BTC.D down
This has not happened this cycle due to bulk buying of BTC for ETF's and BTC being Held Long term.
We can also see how , as we approached a certain time span After the Halving, we saw a sharp rise in BTC.D as we headed towards the next BTC ATH as the BTC buying picked up.
Again, this is not happening this cycle as the Bitcoins are being held long term.
What we can also see on the main chart is how we would normally be approaching a period of expected BTC ATH ( green vertical box )
And the HUGE question is, Will we get a Bitcoin ATH in this period ?
This is, to many extents, impossible to answer but as demand for Bitcoin continues and coins become harder to find, the price should continue to rise.
The tricky bit is, now, with a Bitcoin costing over 100K usd, it becomes harder to move the price. Only Corporations can afford to bulk buy.
So, again, things are different.. Retail is struggling to find a foot hold in the Bitcoin market, seeming to think that a Bitcoin is too expensive for them.....forgetting that they can buy a bit and that will also increase in price by the same %.
And so they look to the ALTs, fast volatile price rises and high returns,
This is seen very clearly in this chart that shows us when we had previous ALT seasons after the Halving
See how, after a period of time after Halving, the ALT Seasons appeared when the BTC.D dropped.
And that has simply just NOT happened this time.
It has to be said, it did try to appear. ALT season tried to happen.
See how after 210 days after halving this cycle, BTC.D did drop sharply but, it found a line of support and bounced back, Killing the ALT season dead in its tracks
There have been a lot of attempts since but the Market has been Bloody for ALTS, with sharp rise and Falls destroying confidence..... And Bitcoin continues to Rise.
So, where are we now ?
This Daily BTC.D chart may offer some ideas
BTC.D PA is currently at TOP of long Term range and finding it hard to get over that line of resistance.
BTC.D Weekly MACD , while not overbought, is curling over Bearish
BTC ATH's have previously been attained from Oversold areas as MACD Rose back higher.
The Volatility has gone and MACD is ranging smooth
SO, in conclusion, it is anybodies Guess right now if we will ever see an ALT season again.
Technically, on many fronts, we are poised, ready for it, even if it is a mini one.
But as we have seen on many occasions this cycle, Bitcoin is a very desired asset now and Demand drives price.....and so the Sell off that we need to drive an Alt season just may not occur.
One thing that is Absolutely certain though, we are highly likely to see another Bitcoin ATH
Stay safe everyone and Love one another. It is Free to do and is worth more than anything

Bitcoin - Fib circles Happen. PA knocked down a little.
Been warning you about this Fib circle coming up and now we know it is resistance... but how strong ?
We do not know just yet but we can lok to the left to see what happened last time.
Over pn the left, we can See PA droped for 7 days bwfore breaking away.
This could happen again and support is below.
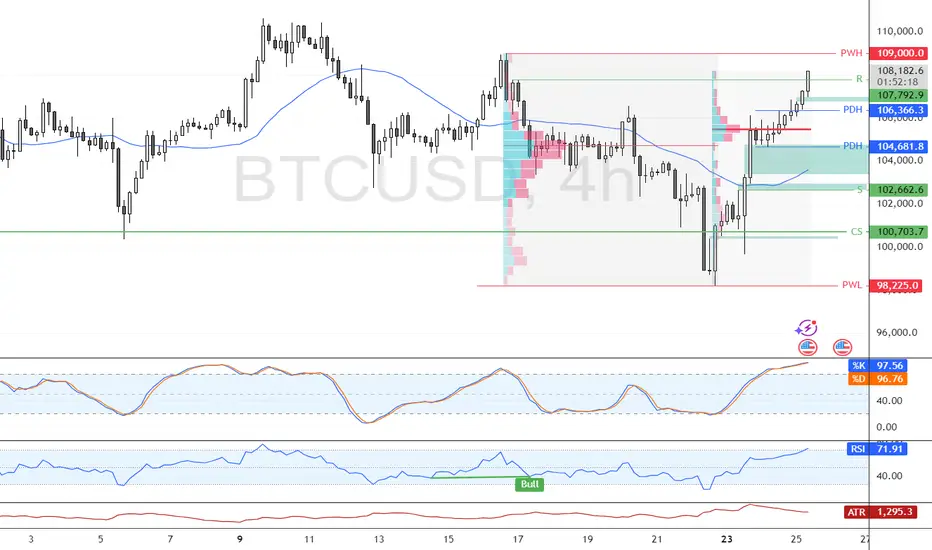
The 4 hour chart gives us a better insight
PA has already found the first line of support and we currently have a small green candle.
Further support below at 104700 and 101700
If they fail, we have the 2.618 Fib extension at 98200 - This should be a strong line of support
If that fails, there is ther support and I will talk abou tthat when the time comes.
It is wise to be cautious with Bitcoin right now as the 4 hour and Daily MACD are Bearish.
This could change anytime and the Bullish "Sentiment" still exists
Bitcoin Dominance is dipping again but has the strength to bounce, so be cautious with the ALTS
More Soon

BITCOIN new week open Green - Will we get 8 weeks Green in a row
These are all WEEKLY chart
7 weeks in a row closed Green.
At Time of writing, Bitcoin is around 109800 usd
So Very Bullish and every possibility that this week will also close Green though we are getting near a point of resistance.
If we zoom into the same chart, we can see more detail
We are above the 2.618 Fib extension and we could return to the 103K zone to test this as support. We may need to do this as it has only ever been resistance previously.
We are also very close to a 618 Fib circle.( Blue )
We do not know if this is an area of strong resistance yet but PA is now in the area that we may react to it.
As a result of this Fib circle, we need to be prepared for the possibility of reentering that rising channel,
We may not do that ,The reasons being that PA still has enough strength.
The MACD - or Moving Average Convergence Divergence, is a technical analysis tool used in trading to identify momentum and trend direction.
The 2 vertical lines on the left are the 2021 ATH points, to give a comparison.
In this cycle we have had 2 previous peaks and then the cooling off period from OverBought.
The Cooling off were the periods were BTC PA ranged..
We are currently rising Bullish, with room to move higher but we should be aware that we are in the area that rejected the 2nd ATH in 2021. The daily is in a very similar position but getting choppy.
The RSI - Relative Strength Index, a technical indicator used to understand the momentum of a price trend . The RSI helps signal when to buy and sell in a trending market by identifying overbought or oversold conditions in a security.
Again, the Vertical lines on the left show you the 2021 ATH points as reference.
See how RSI peaks before BTC PA Peaks.
We have not been fully OverBought since March 2024. RSI is rising Bullish with Room to move higher, though, again, note how it is in an area were rejection has occurred previously.
The Mayer Multiple is a ratio used in trading that compares the current market price of an asset, such as Bitcoin, to its 200-day moving average (SMA) price.
This indicator is particularly useful for swing traders to find zones of extreme overbuys and
It is generally considered a bullish indicator when the price is above the long-term moving average ( Yellow ) and bearish when the price is below it, although significant deviations from the moving average can indicate overvaluation or undervaluation.
Again, take note of the vertical lines and were this Mayer Multiple was.
Again, the tendency is that when this Drops, BTC PA has Ranged to cool off and when it crosses above its Average, it leads to a High on the push higher.
And once again, remembering what has been said above, we need to wait to see if this crosses its average or get rejected by it.
But as you can see, the Average is more often used as support amd mpt resistance.
So, in conclusion, I remain Bullish but with a note of Caution till we get a push higher conformed.
We could see a pull back and , if that happens, this maybe the last sensible buying Zone for Bitcoin this time round. The Risk is increasing as more and more coins enter into good profit margins. People may get tempted to sell.
On a longer term , this month has confirmed a very bullish intent and we have one week to go before month end. I will expand on this on 2nd June
This week. we wait and see how Bitcoin will react.
Be Kind to others. The world Needs LOVE

BITCOIN 5 lines and 3 indicators to watch now we in new ground
I will be presenting a number of charts here and each has a different story to tell right now.
The 5 lines are All valid trend lines.
The Vertical lines are January year markers
The white line at the bottom is th e long term support line from 2013
The Dotted line is a threshold line
The Blue Arc is a line that has rejected EVERY ATH since 2013
The orange line is a marker that, once crossed has Always led to a New cycle ATH
The upper dashed line is the line of rejection of all ATH since 2017
The Weekly Bitcoin PA chart
Here we can clearly see how that Blue Arc has rejected PA previously. We can see how PA has reached a point of intersection and once it crosses that blue Arc, there is a line of rejection just above.
This Blue line needs to be crossed and held as support.
The Daily version of this chart shows ua how we have just crossed that blue Arc.
It also shows us how FRAGILE this is right now. PA is currently testing that Blue line as support
This needs to Hold. If we manage to hold this line and bounce, Stiff resistance is found around 120K
The following charts are showing the following indicators
The 3 indicators used are
RSI - Relative Strength Index. used to measure the speed and change of price movements
TSI - True Strength Index, used to indicate trend direction and overbought/oversold conditions.
ADX - The Average Directional Index (ADX) is used to measure the strength of a trend, not its direction
The 4 hour chart - short term expectations for the weekend
Bitcoin PA the Yellow line at the Top, the indicators are in the order listed above,
First thing to see here is how BTC PA is retesting that Blue Arc - this really needs to hold
RSI (blue) - OVER BOUGHT, It has fallen below its own MA ( average) and could easily drop further today. Looking back along this, we can see how the 4 hour RSI likes to range along the Neutral line, so we may see it drop back to that level today, tomorrow
TSI is also OVER BOUGHT. We can see when TSI is up here, PA ranges while it cools off. But there is room for one little push here if required
ADX ( yellow ) is high showing trend could be getting near exhausted, The orange line is the DI+. This shows positive prince direction, the Red one is DI- and shows that negative price direction is climbing slightly.
In the short term, we need to see PA hold above the Blue line but the likelihood is to possibly back below. There is support below.
The WEEKLY shows us that PA has the ability to continue for a while longer but we are getting near a point where PA needs to recover
Here we can see how the RSI and TSI are both up high, on the edge of OVER BOUGHT but with the ability to rise further.
What is VERY important to take note of here is that ADX.
It is Low, this is indicating that the weekly Trend has lost strength now. It could continue lower.
Remember, ADX DOES NOT SHOW TREND DIRECTION, JUST STRENGTH
So, the thing to see here is that we are in an area where we could see a New Trend begin. This trend could be either Bullish or bearish
On a weekly chart, this change can take a long time to appear in PA
And for the Longer Term, The Monthly Chart gives us hope for a fuhrer push higher for the rest of the year but one little warning bell
WE See Both RSI and TSI up high again, where they have been since 2024. But neither of them are up in OVER BOUGHT as much as they have been in previous cucle Tops.... So we can assume room to move higher.
But what does ring a bell is that ADX again. It is once again, in a place of Change and on this chart, showing that the current trend can start becoming weaker. However, DI+ has plenty of room to move higher
So, in conclusion, we see that BITCOIN has the ability to continue higher but in the short term, we may see a pause and possinle Volatility
Trends are about to change, This could take Weeks and PA can continue higher while a trend weakens.
For me. we are in the last few months of this cycle and at a point of Decision.
PA MUST get over that Blue Arc that has rejected Every ATH since 2013.
If PA fails this, we go back to sub 90K but this is unlikely,
There are numerous projections that see BTC PA in price discovery reaching the 120K before serious resistance.
On this chart, if PA follows pattern and trends, we could see 378K by year end
Getting over that irange line is KEY
Stay safe everyone.
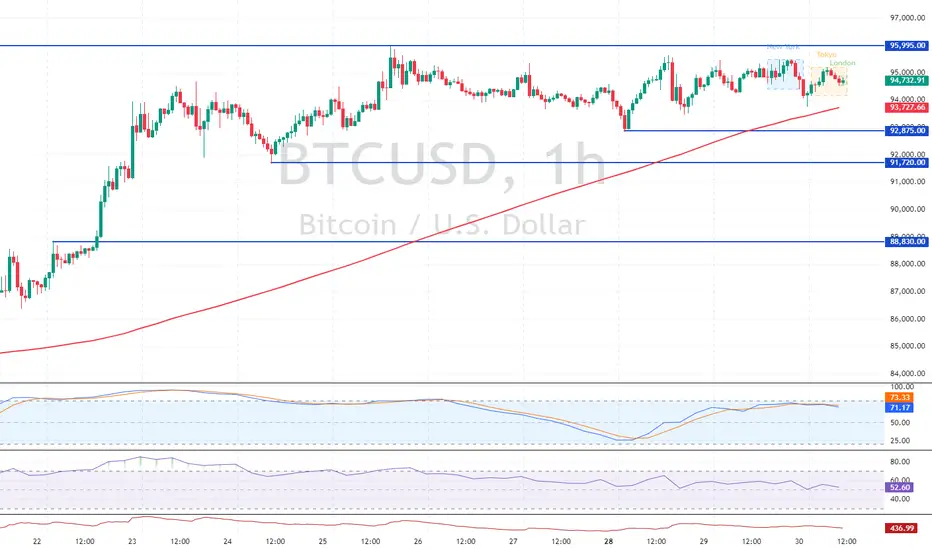
Bullish Bitcoin Find ResistanceFenzoFx—Bitcoin remains bullish above the 50-period simple moving average but lost momentum near the $95,995 resistance. It currently trades around $94,650.
A breakout above $95,995 could trigger a move toward $99,560. Conversely, a close below $92,875 may lead to a drop toward $91,720, with further downside potential to $88,830 if selling pressure intensifies.
>>> Prop Trading
>>> No Deposit Bonus
>>> %100 Deposit Bonus
>>> Forex Analysis Contest
All at FenzoFx Decentralized Forex Broker
Bitcoin Walks Into a Robust Resistance AreaFenzoFx—Bitcoin remains bullish above the 50-period simple moving average at around $93,950. A doji candlestick on the daily chart signals potential consolidation or a bearish move.
Resistance spans from $94,990 to $99,420, suggesting a possible reversal. We recommend waiting for Bitcoin’s reaction before planning a strategy.

Bitcoin Tests Critical Resistance Level: What's Next?FenzoFx—Bitcoin is testing the $88,650 resistance, a level it has rejected more than three times. The Stochastic and RSI 14 indicators remain in overbought territory, indicating short-term overvaluation. Entering the market at this price is not recommended.
If BTC/USD stays below $88,650, a consolidation phase may follow, with potential dips to $88,140 and $82,810.
Bullish Scenario
The bearish outlook is invalidated if BTC closes above $88,650, potentially resuming the uptrend toward $90,000.
