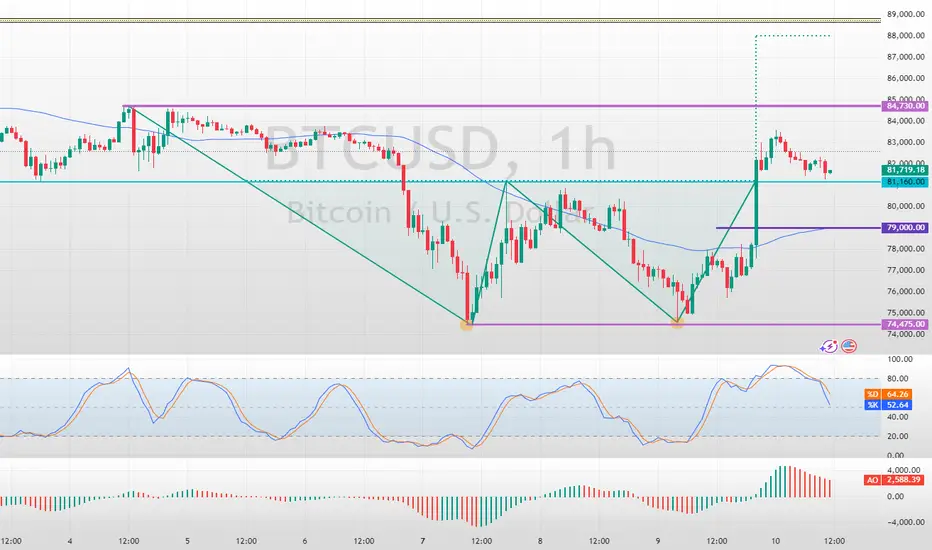
Bitcoin Double Bottom Pattern Came into PlayFenzoFx—Bitcoin jumped upward from $74,475 support as expected due to the formation of a double bottom pattern on the 1-hour chart, which is a bullish signal.
As of this writing, the price is stabilizing and testing the $81,160 mark as support. However, the 50-SMA on the 1-hour chart serves as the pivot point between the bull and bear market.
The next bullish target could be $84,730, followed by $88,000 if BTC holds above the discussed moving average.
Trade BTC/USD Swap Free at FenzoFx Decentralized Broker
Bitcointechnicalanalysis
Bearish Bitcoin Faces Key ResistanceFenzoFx—Bitcoin trades bearishly below the critical resistance level of $81,160. If the price remains below this level, the downtrend will likely resume, targeting $74,000.

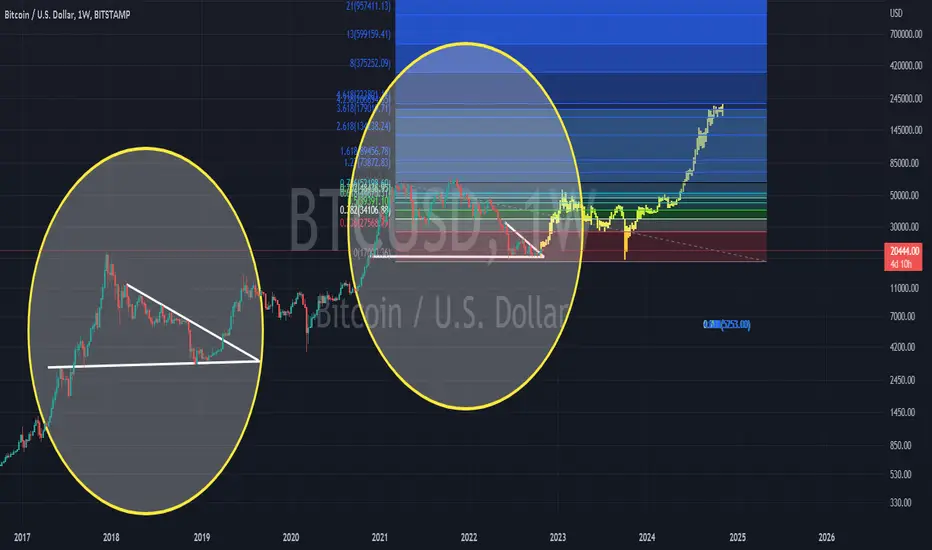
Bitcoin Price Forecast: Potential Bull Run in Q4 2024 & Q1 2025 Bitcoin (BTCUSD) currently holds a strong support level at $55,300. This key level presents a significant opportunity for potential gains. If the support at $55,300 fails, the next critical supports are at $52,000 and $48,500. Given the approaching bull run, we expect a bounce from these levels, particularly in Q4 2024 and Q1 & Q4 2025.
As with previous bull runs, we anticipate substantial volatility during this period. Remembering to exit the market around March or November 2025 is crucial, as the bull run is expected to conclude around this time.
Based on historical data and calculations, the Minimum target for Bitcoin in this bull run is $253,623. If Bitcoin flips the resistance at $253,623 by February 2025, we could see a maximum target of $275,780. Previous bull runs in 2013, 2017, and early 2021 exhibited unexpected price pumps, and we may witness similar volatility this time. While observing resistance zones, it's essential to keep trades active and plan to exit long positions by March or November 2025.
For more detailed analysis and insights, follow us on TradingView to stay updated with our latest ideas and benefit from our expertise.

$BTC Retests $60k w/ Strong Bounce / Post-Halving Pump IncomingThis was so incredibly obvious
Textbook retest / bounce ~$60k, a key psychological level for CRYPTOCAP:BTC
Daily close ~$61,5 should confirm next move up
IF this fractal plays out, we should retest prior highs ~$73,500 and then bounce back to support ~$68k about a week after the Halving
that will be a crucial level to hold for the next leg up, otherwise we'll prob stay in this $60-70k range for a bit

Bitcoin Looks for ONE MORE Possible Chance to BUY THE DIP!! Remember to Like, Comment, & Follow for more in-depth analysis! Share with your friends!
The greatest compliment one can give is a referral
I've seen too many doom and gloom posts for Bitcoin, and there are macro and micro bullish patterns being layered with more bullish patterns as we get closer to the Havening.
Bitcoin is in a descending parallel channel, but it is not a bearish distribution. The distribution is bullish due to the top of the channel being tested already 4 different times, and the bottom side of the channel has only been tested once. The more times a support or resistance level is tested, the weaker it becomes.
Bitcoin has also created a macro inverse head and shoulders pattern, and each shoulder and the head of that inverse head and shoulders pattern is its own inverse head and shoulders pattern. The most bullish bottoming pattern in trading was just created 4 times to create the bullish support in the 60k - 73K range. This range includes the bullish double top that was made in 2021, plus now, this inverse head and shoulders pattern is made up of an inverse head and shoulder pattern in each of the shoulders and the head. We are now
Even though we did not break out off the inverse head and shoulders pattern, we will continue to cool off indicators with another drop down to the 65K level, or potentially the 59.7k level. The only reason that we would drop down that far again after creating the bullish pattern we just made would be the fetish Bitcoin has with needing to hit the .618 Fib retracement level.
The .618 Fib retracement level sits at 59.7k. The head of the inverse head and shoulders wicks down under the .55 fib retracement but never reaches the .618 fib retracement level. Since we are in a descending parallel channel, it would allow it to hit that .618 Fib retracement level now while staying within this parallel channel.
Another bullish pattern bitcoin has made, is the macro bull flag. We had a major run-up, from 38.5k, where volume increase was consistent and noticeable, and we topped out at 73.5k (about +93% upward).
Just by extrapolating the percentage move and estimating where the second pole moves from the bull flag would finish. More importantly, it would be important to know where the starting point for the next runup is. It would be starting from the 59.7k (.618 fib retracement level) and then extrapolating +93% upward would put us at about $115k (which also is the 1.618 Fib Extension Level).
Another pattern I see that can occur is, as I said previously, we technically have not bounced off the .618 Fib Retracement level ($59.7k), which is the bounce point Bitcoin has a fetish for to be able to start another bullish move upward.
Currently, we sit in a position where we are 2 weeks away from the Bitcoin Halvening, which is the catalyst that starts the new Bitcoin Bull Market, where we make a parabolic move. There are at least 10 different bullish confluences of support within the range of $60k- FWB:73K , and the only bearish confluence is that the top side of the descending parallel channel we have has held any breakout above it from happening.
The move that I am possibly watching for would be one that lands us just shy of the $100k milestone.
The move would look possibly something like this, where the only way I could see this bullish confluence zone could become more BULLISH would be to make an eve & eve double bottom and create the second bottom with another inverse head and shoulders pattern. We would then break out to $73.5k peak and then around the same time as the halvening, we would look to break the peak and then use the .55 Fib Ext.Level and .5 FIb Ext Level to create a Bullish W-Breakout Pattern with making both bottoms re-test the previous peak of $73.5k. After re-testing both times, holding support above that previous peak, We would launch to the .618 Fib Ext Level, possibly re-test the top of the W breakout we just made, and then after, we would take a launch at the 1 Fib Ext. Level that sits at $93.8k.
Major key points would be:
-Drop to the .618 Fib Retracement level ($59.7k)
-Breakout bounce up to the .5 Fib Extension ($76.1k) or the .55 Fib Extension ($77.9k) of which breaks out $73.5k peak
-Minor Correction from the .55 Fib Ext and the .5 Fib Ext level down to re-test the $73.5k peak to create a Bullish W breakout pattern
-Breakout to either .618 Fib Ext ($80.3k) or the 1 Fib Ext ($93.5K)
Let me know what you think in the comments below! Which pattern do you see playing out?
1. Run-up to $115k
2. Run-up to $94k

Is This It?We have been bullish on Bitcoin for quite some time, as my previous posts can witness.
Looking for a potential upside resumption in place as we could now expect a series of wave threes and fours.
As always feel free to let me know in the comments what your thoughts on BTC are, if you enjoy the content, please leave a like.
Trade safe!

Bitcoinbitcoin technical analysis basically on elliott waves Principles and RTM priceaction
bitcoin can be grow to 28000$
wait and watch.
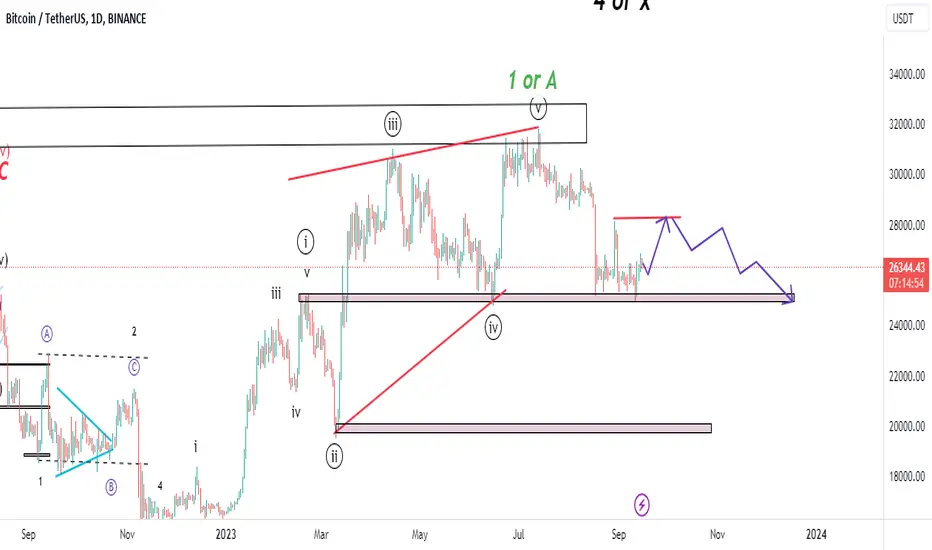
Bitcoin soon to BottomWe have been looking at this bullish count for several weeks now. The down move from around 31k seems to be corrective in nature therefore it could be a complex correction within a wave {ii}.
Looking for support to be found within the 28-30k area or else the count will be compromised.
Feel free to ask any question, trade safe!

Bitcoin Bull Market Fully Matures! Category 5 😮 What now?In this video we examine what happens after a Bitcoin bull market fully matures and stabilizes. We also explore the relationship between the timing of bull market maturity and the future halving price, and how this relationship may affect the price action moving forward. Thanks for watching!

Bitcoin wants it higher but bears dontBitcoin\1H consolidating after breaking the down wards parallel channel and making a new extreme to the upside ~23.6.It could go up to ~24.1 where a big liquidity cluster is and come back down after that.
**Next stop for bitcoin could be around 20500 where the CME Gap is**
Please Boost,Follow,Comment if you find this video informative.
We yet have to see a flood down to around 20K or even 19K. With SPX testing the biggest resistant line as a support ,today after a retest it will lose it and flood down thus btc will follow .

Bitcoin Continues Fake Pump Ends SoonBitcoin/1H afer it did a stop loss hunt at 22.7 it found support and came back to 23K where it did a break of structure and exited our down side parallel channel (two purple lines) resulting in a leg to the upside.
Its Planning to do a liquidity grab untill ~24.2 with a possible wick up to 24.6 depending on the momentun and the volume for the rest of this ride
after that it will not only retrace back but further down maybe even filling 20K gap on CME.
Chance of a great short from 24172 to 24.6

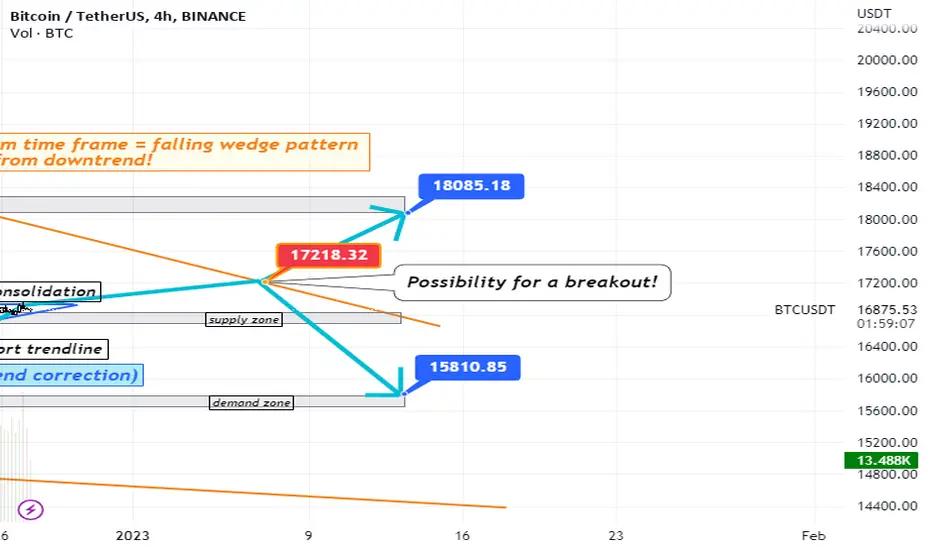
BTC / USDT pair on Binance (4h timeframe) analysis + predictionHello,
Today I'll look at the BTC/USDT chart pair on Binance in the 4h timeframe. The demand zone is around $15850, and the supply zone is sitting around $16770 (previous supply zone was around $18K). From the long-term timeframe, I can spot the Falling Wedge trading pattern coming from a downtrend, and from the short-term time frame, I can see that the Ascending triangle trading pattern is occurring with consolidation and a rising support trendline. As an ascending triangle is normally a bullish sign, I expect the price to go just a little higher before changing direction and moving towards the demand zone at around $15800. The possibility of a breakout can happen at $17,200. If the price breaks the Falling wedge structure, we can expect a bullish movement and the price to move in the direction of 18K. If the opposite happens, I am expecting that we will move with the price in a downtrend to the demand zone at $15800 or lower. Both of the patterns I noticed are primarily bullish, but TREND is your friend. I am expecting the price to slightly move upward and then go in a downtrend to the demand zone at around $15800 or lower. My trading idea is to go short/sell. We are still in a bearish cycle, don't forget that!
Enjoy & have an amazing day!
BF
BTC COUD DROP FURTHER!!!- I personally think that BTC will drop further before it goes back up just like it did in 2019, it dropped to around £3,000 and then soared to around £50,000 by November 2021!
- Be ready for a massive pump, then possibly WORLD WAR III then a massive crash and then a massive bull-run were BTC coudld reach £100-200k!
- NOT FINANCIAL ADVICE!
#Bitcoin Losing Steam, Anchored at Q3 2022 Support at $18.5kPast Performance of Bitcoin
Bitcoin remains in a range, and price action is still dull at spot rates. As it is, BTC has support between $18.5k and $19k and is technically bearish, reading from the candlestick in the daily chart. Days after the October 13 bull bar with relatively high trading volumes, Bitcoin is back inside the bull bar and broadly inside a bear breakout formation.
#Bitcoin Technical Analysis
Presently, BTC bulls have a chance. From the daily chart, prices are in range inside the October 13 bull bar, a net positive for buyers. The sharp reversal of prices from below Q3 lows with increasing trading volumes may point to the early stages of recovery and the end of the 11-month bear run. This preview, nonetheless, is valid if prices are above $18.5k and, preferably, $20.5k in the short term, breaking away from the current consolidation. If not, losses below last week's lows at $18.2k may see Bitcoin disintegrate, falling to register new 2022 lows.
What to Expect from #BTC?
BTC is within a bear formation, and traders are overly apprehensive. Unless clear breakouts signal the end of the bear run or the continuation of Q3 2022 bears, trades can stay on the sidelines. Gains (losses) above $20.5k ($18k) would mean the sideways movement of the better part of Q3 2022 was accumulation (distribution).
Resistance level to watch out for: $20.5k
Support level to watch out for: $18.5k
Disclaimer: Opinions expressed are not investment advice. Do your research.

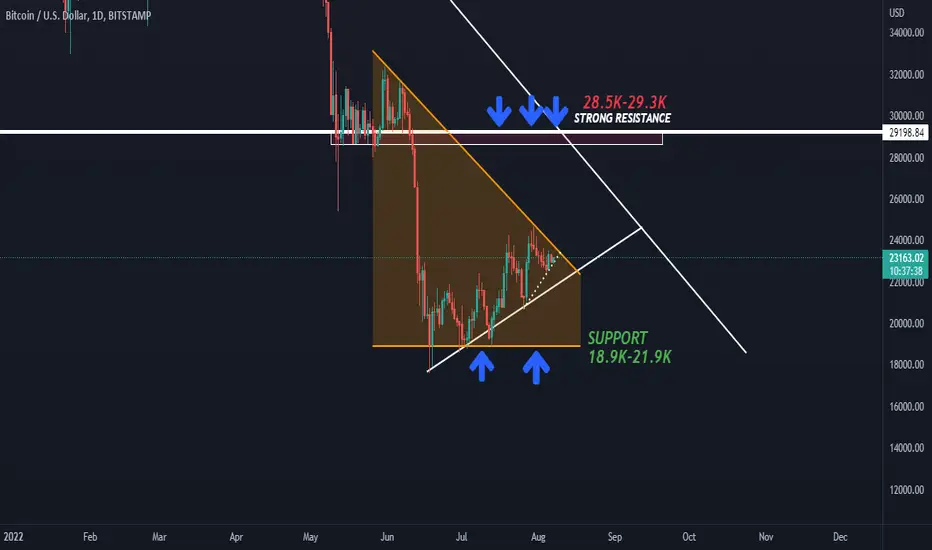
Green till 28k if we break this trendlineI am looking for a break of the trendline if we close above 200 WMA this week, this upside break of the trendline would take us to the 28k - 29k region.
Bitcoin on H12 - when is it going up?If you look at the H12 chart, then you will see that a channel of blue lines is emerging. The price movement may well follow the pattern of Wolfe waves. Thus, the fourth wave will start somewhere at the level of 20,000 - 20,400 USD. (POC for horizontal volumes is around 20,300 USD). Also, the Stoch RSI is currently supporting the price decline.
Take into consideration the fact that point X on the red line (local minimum) occured as a result of a sharp fall from the local maximum of 32,400 USD. The angle of point X relative to the 32.400 USD point is too narrow. This factor offers supports to the formation of point 6 according to Wolfe waves.
In general, Bitcoin is at an accumulation stage, where the flat may last another 2-3 weeks. Therefore, the price rise to 28,000-30,000 USD may well not take place until point 6 is formed. However, it is worth tracking the price movement on 4H, 8H, 1D. Afterall, this is a market! Everything is possible!

BITCOIN 2022Will try to keep it short.
2022
You must be in a cave if still dont know about bitcoin.
Bitcoin is a decentralized digital currency, without a central bank or single administrator, that can be sent from user to user on the peer-to-peer bitcoin network without the need for intermediaries.
Supply is capped at 21 million ( just like any company share float), game is all about supply demand. Some call it the tulip mania, some refer it to as internet of 1990's.
Either ways, caveat emptor, its an asset class of its own, risky but also highly rewarding.
While creation was for transactions, last 11 years lot of advancement has been made and focus is on blockchain/ distributed ledger ( a store of value independent of traditional banks. ) than just a mode of p2p exchange. As of date there are 14000 cryptos solving different problems, but you wont make in 90% of them.
Blockchain applications- Monetary reserves of countries ( CBDC ) , real estate, power, ecommerce, IOT, digital transactions, financing etc
Big companies that accept Bitcoin include - Microsoft, PayPal, Whole Foods, Venmo, Starbucks, home depot, twitch etc
Bitcoin ETF are legal and heavily traded.
WAR- Russia vs Ukraine has taught us the implications of sanctions and forex stress, Ruble ( russian currency) is at all time lows and oil at ath, The importance of self sufficiency couldn't have a better example.Russian forex was frozen, bitcoin remain unfazed.
El Salvador has declared bitcoin to be legal tender, rest to follow suite.
Because i have bought it, you should too ( Isnt that what we do with stocks too? ) . 4 year cycle, just like commodities, buy when low, sell when high.
but in a nutshell wouldnt be a bad idea to put part of your earnings in it, you'll thank me later.
________________________________________________________________
Technicals
For now, trading inside the channel , should continue its upmove. keep it simple :)

BTC BACK TO $10K AROUND AUG/SEPT- I personally BTC and ALTS will have one last pullback, before we recover and start a steady uptrend by JAN 2023!
- NOT FINANCIAL ADVICE!
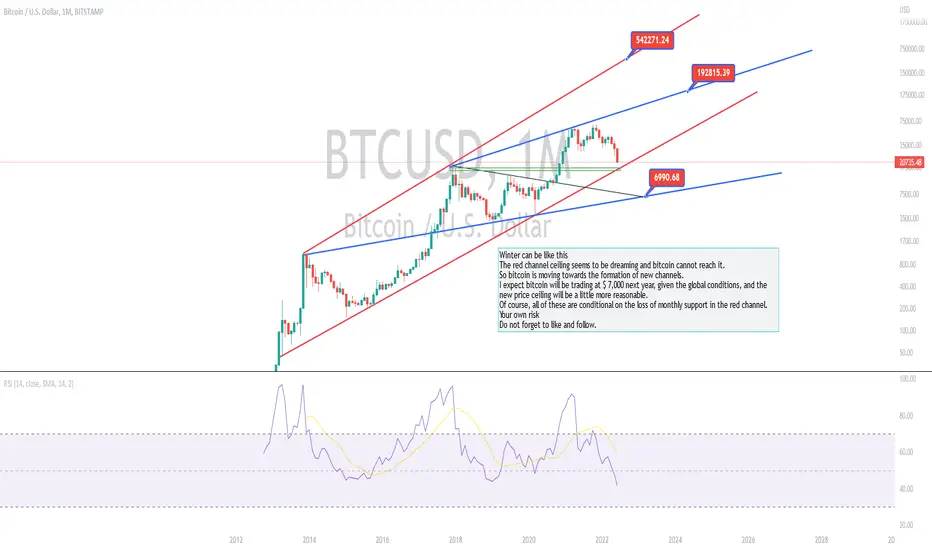
#bitcoin If the winter continuesWinter can be like this
The red channel ceiling seems to be dreaming and bitcoin cannot reach it.
So bitcoin is moving towards the formation of new blue channels.
I expect bitcoin will be trading at $ 7,000 next year, given the global conditions, and the new price ceiling will be a little more reasonable.
Of course, all of these are conditional on the loss of monthly support in the red channel.
Your own risk
Do not forget to like and follow.
BITCOIN: MY PLANHere is my plan for this pair.
my opinion DXY will create short correction and bullish for bitcoin.
when correction done and bitcoin fall.
If you agree with this idea, leave comment and thumbs up.
Thank you
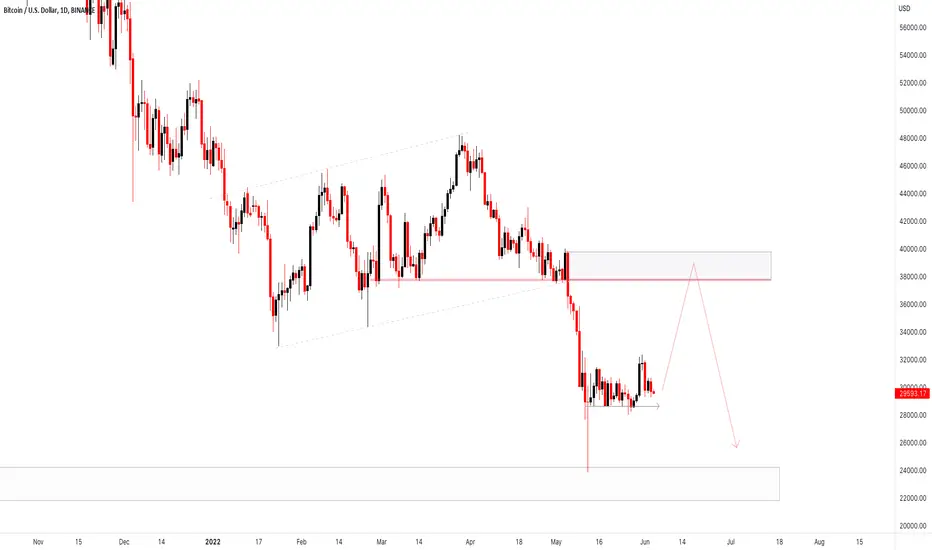
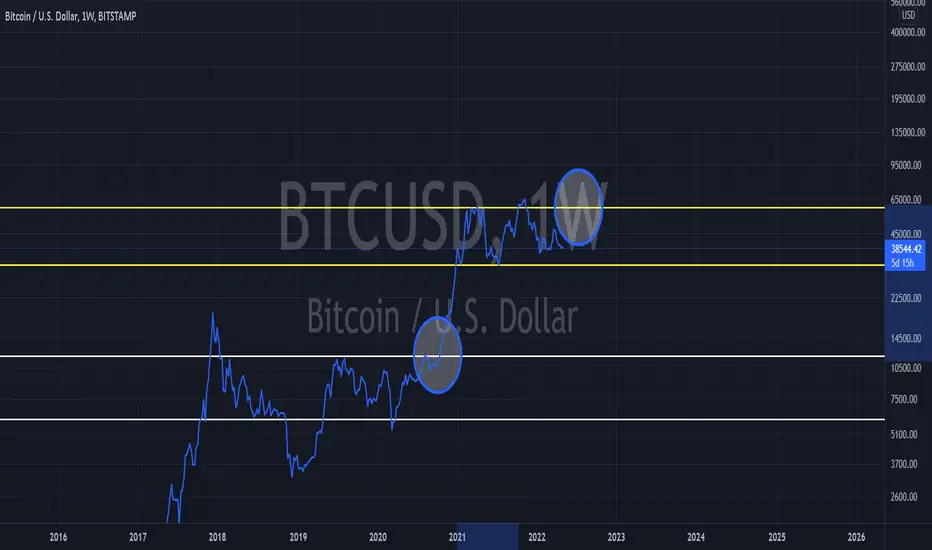
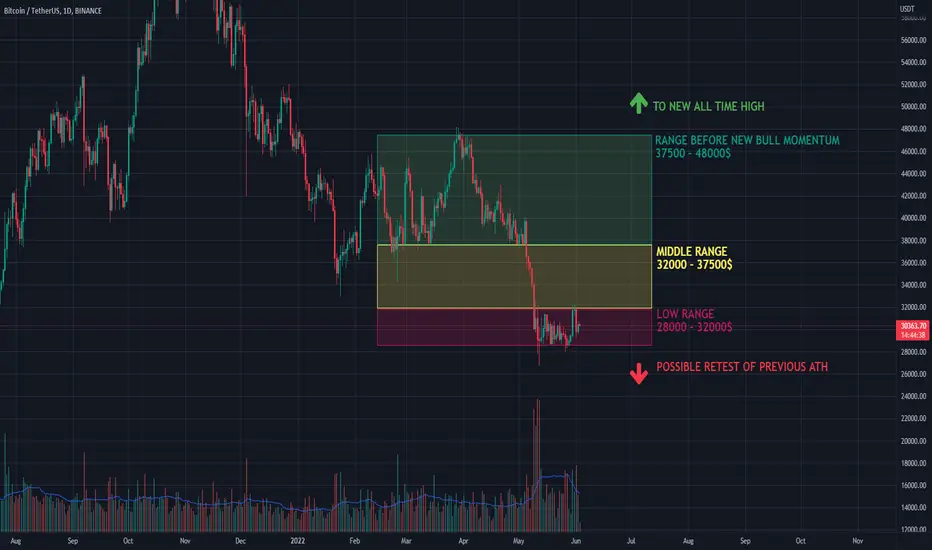
Bitcoin - range trading Bitcoin continues the price action with low volume, low retail interest and small movements. The best you can do in this situation to preserve your wealth is to just trade the ranges. There are 3 clearly visible and very strong channels, which you can trade now:
1. LOW RANGE - currently we are sitting in this range. 28000 - 32000$, long the support and short the resistance - simple as that. Beware of spikes in both directions and use a proper stop-loss. If the support is broken (with a daily close below 28000$) I expect a retest of previous all time high around 20000$.
2. MIDDLE RANGE (32000 - 37500$) - a range that can be very interesting, because we have many major resistances in between. MA100 and MA50 on the daily are located around 34000$ and could change the game in the range.
3. UPPER RANGE (37500 - 48000$) - this is the range before new bullish momentum and a new all time high respectively. This is the place you would like to be, but I don't see it in the near 2-3 months.
TRADE SAFE!
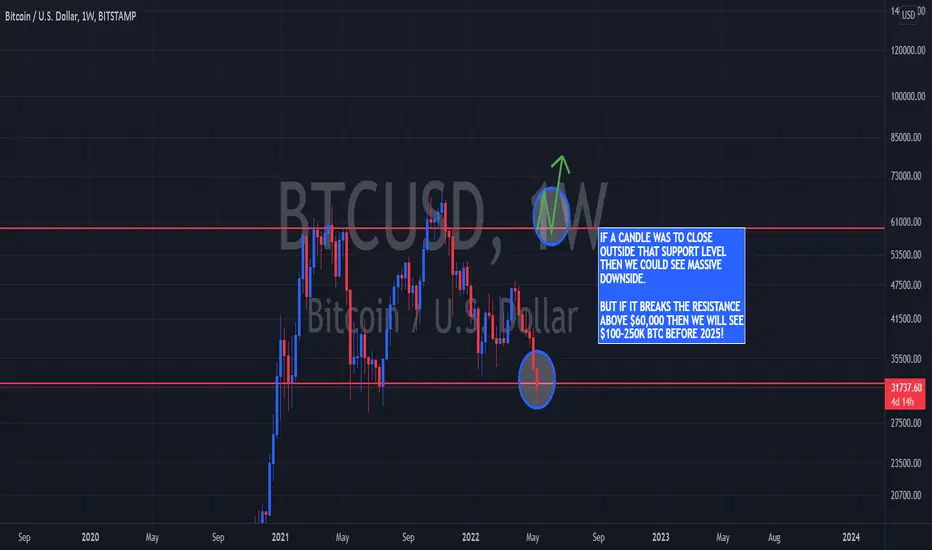
BTC TO $250,000 BEFORE 2025!1) We are not in a bear market just yet, simply because we have not broken out of the support level and closed to the downside....even if we did, we still could shoot back up, as its happened before.
2) Regulations are coming, we could see BTC crash a little further before we see it go back up. However when regulations come 99% of the 19,378 cryptos will die!
- leaving us with around 190-200 legitimate projects that have a massive use case, utility and solve a massive problem.
BTC 400% MOVE INCOMING!- As you can see previously BTC consolidated for a while, before it broke out and went up by 450% if the same move occurs we will could see a $320,000 BITCIOIN!
- Short term we could see BTC touch back to $32,000 and then a massive rally to the upside, then when all the whales start to sell their BTC, A LOT of money will flow back into ALTCOINS!
- NOT FINANCIAL ADVICE!