BTC technical analysis 4/2/2022 *NOT FINANCIAL ADVICE*51.4K within 12 days? (4/14/2022) based off inflection point on trend line
(arrow 1)
I think it will happen by Monday IMO (3 days) this is based on previous symmetrical top
(arrow 2)
potential marker for near symmetrical retracement based on previous high in bearish cycle (assuming our retrace up looks similar)
(arrow 3)
My technical reasoning:
-Ascending triangle was formed and a breakout was confirmed
-Triple bottom formed within the ascending triangle
(2 bullish charts is a good sign for me)
-Momentum & Money Flow Index are in line with Stoch RSI potentially confirming the start of a larger trend.
-MACD is on the cusp of a reset
whales & Institutional buys are the brunt of this next inflow.
I'm personally going long.
Anti-Hedge
Bitcointechnicalanalysis

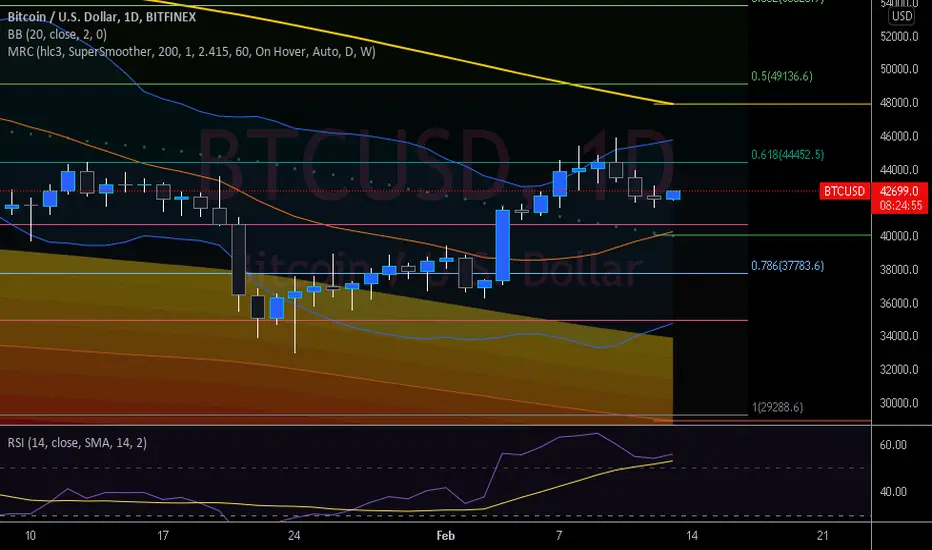
BTC 45K Break Coming Soon!!?Looking at our BTCUSD on the daily chart we notice that from last time we spoke on this we were looking for a potential breakthrough of the 0.6 FIB level and/or the 45K level, we got rejected after 4 strong wicks up and above here but this could have been expected too, we saw a big run up from our most recent bottom and a little cooloff couldve been expected for PA. Now with that being said it looks like we have seen that full cooloff and we are looking to run back up to 45K. I personally think if we do see a strong push coming from today going forward we have a very good chance of smashing through this level once we get there. Now looking at our bollinger bands we came off the top band after having a significant run up and we are coming back down towards the midline which is support, definitely looking to hold the midline if we do come down to it. Now for other support levels we have tons, we have 40.7K aprx and also double support along the midline of the BB's and if we do by chance break those we have strong support at the 0.7 FIB level. For the Mean Reversion Channel we are still 12% off our mean line (yellow) looking previously we bounced strongly off the orange oversold zone. Now keep in mind one rule with this indicator is that at some point price action comes back up or down to the mean level, now the whole goal here is to make our way above this level so we can start making some higher highs! Now the RSI is looking fantastic we are up and above the very important midline, staying above here returns us back into a confirmed uptrend so holding this zone is very important! We also have strong support coming from the yellow SMA (Simple Moving Average) as an added layer of support other than the midline! Not financial advice just my opinion!
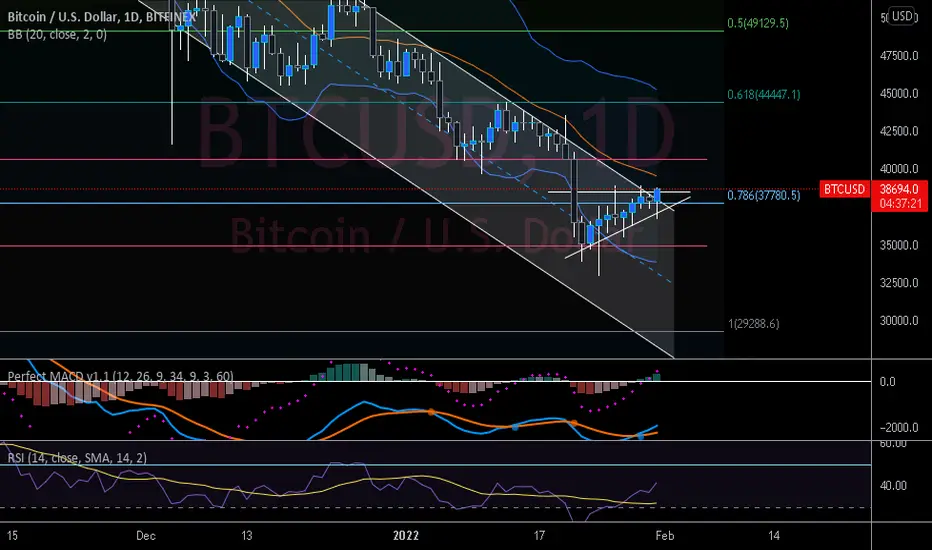
BTC Bullish Triangle Breakout!Doing a little update from yesterdays TA and ill keep this one a little shorter! We have successfully broken out of the bullish triangle we talked about, keep in mind there is always the chance that we reenter this pattern before the real breakout happens, but either way we are looking strong, we have been steady rising for over a week now and we have taken out some important levels on the way like the 0.7 FIB and the top of this triangle, now we are looking at holding above here and our next goal is going to be reclaiming our midline on the bollinger bands, we need to get into the upper half as the midline will then be support and we have the opportunity to make a run for that top band! After the midline on the BB's we are looking at an absolute key level that is.. the pivot point sitting around 39.8K, reclaiming this level will definitely add a ton of bullish momentum, not only is just the current pivot point but is just below 40K and as we all know that is a must reclaim zone at some point sooner than later. The Wavetrend is looking good aswell we are rising still and not showing virtually any signs of slowing up just yet, we had a strong rebound coming out of the buy zone and we are about halfway to that midline, of course a run above this midline would be very ideal but in this wave i don't know if thats going to be the case, none the less if we do see a little drawdown it wouldn't be unhealthy to do so, we will likely catch some support on the way down before hopefully making our way back up and going for that midline and beyond! Not financial advice just my opinion!

BTC Breakout!!When we last talked about BTC we were looking at a couple key areas we needed to breakthrough in order for us to continue moving to the upside, those levels were the 0.7 FIB, the top of the descending channel and the top of the bullish triangle, we are looking solid here we have taken out the 0.7 FIB and the top of the falling channel, all thats left in our current spot is the top of the bullish triangle! Keep in mind guys we need all of these to confirm after our daily close tonight at 7PM EST. A breakthrough of all of these levels or even the current 2 is going to be significant and the chances of us seeing some big bullish momentum significantly rises. The level we would be looking at after these 3 is the midline on the bollinger bands, which currently acts as resistance as of right now, flipping this level not only gives us a cushion of support but opens the door for a run at that top band. Historically closing ontop of the top band leads to explosive price action to the upside, not always but a majority of the time we see this happen, same thing applies to the downside. Looking at our MACD we look good here, we are beginning to see nice separation between the MA's which is always a good thing, this makes it more difficult for the bears to trigger a bear cross. Not only that but on our histogram we notice that our green bars are rising day by day showing an increase in bullish momentum, we want to see this continue moving forward and keep in mind if we start to flatten out or decrease the bullish MACD cycle is likely coming to an end in the short term. Now the RSI looks good aswell, we are still stuck in the bottom half below the midline which means a confirmed downtrend, but the good news is we have flipped the SMA to support and we are on our way up, the main goal here is simply getting above the midline and holding above, this puts us back into a confirmed uptrend and relieves a lot of bearish pressure! Not financial advice just my opinion!
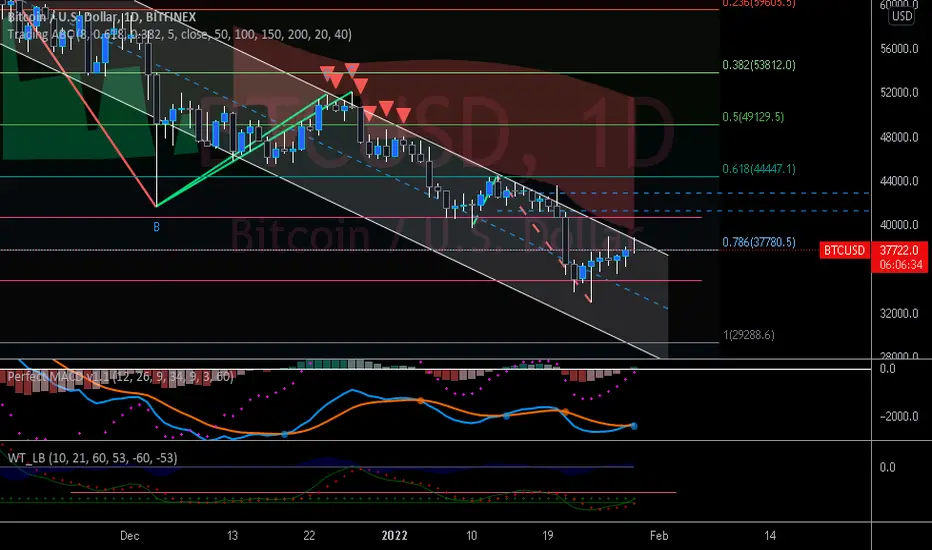
BTC Looking For an Upside Break!!?Bitcoin id looking to break up and above the 0.7 FIB level which also has over hanging resistance coming from the descending channel, we wicked all the way up and above both these levels but have since come back down, what im looking for tonight on our daily close is a push up and close atleast above the 0.7 FIB! This opens the door and allows us a better chance at making a push to breakout of this descending channel, as for another level of resistance we will face is the 40k-40.7K zone, breaking above 40K and holding it is going to be a very bullish sign. Looking at our automated ABC pattern detector we are currently forming the C structure with a target of about 41.2K - 42.8K, if we can successfully complete this pattern we will be ending up in a very good spot above some major resistance levels. One thing that is crucial for PA going forward is that we need to break the current downtrend we are stuck in, that starts with all the breaks of resistances i was talking about but also making that C run complete and from there continuing to move up. A good way you can keep up with the current trend is looking at the RSI, being below the midline like we currently are confirms a downtrend, we need to break above the midline and hold above to see a confirmed uptrend come into play. Looking at our MACD we notice that we actually just got a bullish cross, now don't jump to conclusions too fast, we need this to confirm first, our MA's are tight together and as you guys know this allows for a quick reversal and bearish cross. What we want to see going forward is these MA's start to move apart creating space between eachother making it more difficult to trigger a bear cross, another important thing we want to watch is the histogram, we are currently on our first green bar which is a great sign but moving forward we need to see these green bars continue and we gotta see an increase day by day showing an increase in bullish momentum. Now the Wavetrend, we are looking very good here overall, we bottomed out in the buy zone and we seem to be reversing very nicely, our wave has crossed over the red crosses and is beginning to move to the upside, we have been trending down for quite awhile now and haven't seen a significant bullish wave so thats exactly what im looking for here. Keep in mind the wavetrend is a slow mover and rarely ever has jagged turns and moves, we see smooth transitions between waves, the one key level we need to break above to really confirm a strong bullish wave is the resistance level coming from the last peak from the 15th of January! Not financial advice just my opinion!
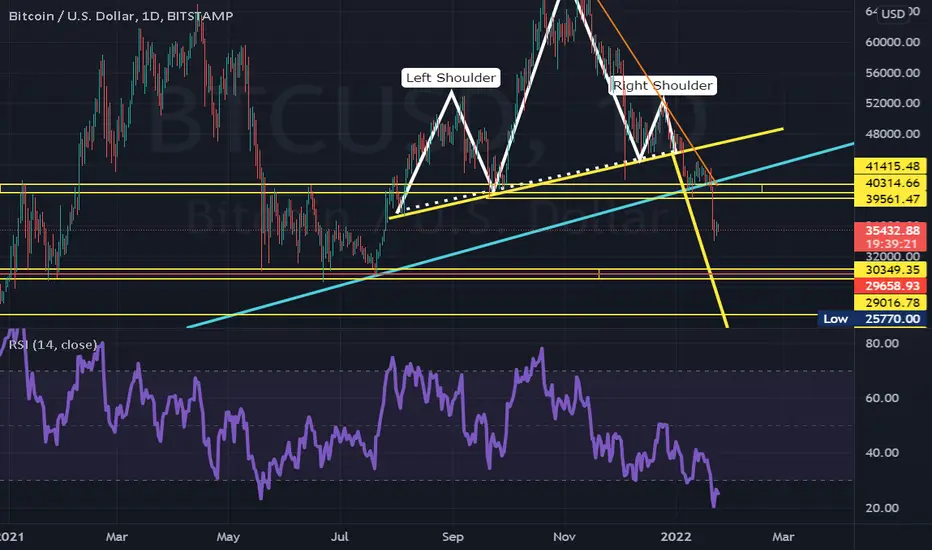
Bitcoin Buying ZonesImportant Buying Zones for Bitcoin. BUYING ZONE 1 - $40300 - $41400 SUPPORT 1 - $39600 BUYING ZONE 2 - $29000 - $30350 SUPPORT 1 - $24350 BUYING ZONE 3 - $19200 - $20600
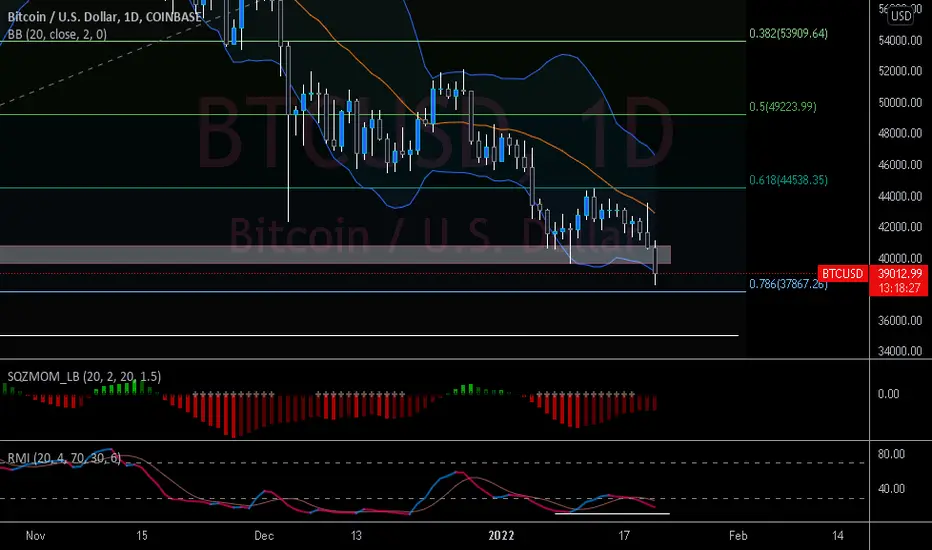
BTC Final Flush Before Reversing!?Bitcoin was very quick to invalidate our double bottom that we talked about yesterday and had a sharp flush to the downside likely liquiating tons of players along the way, we are currently sitting a fair ways above the 0.7 FIB level, we are catching some support at 39K. What we don't want to see coming from the bollinger bands is a stronger push to the downside resulting in price action being fully ontop of the bottom band, as you guys know this can trigger a fast sharp move to the downside even further. The squeeze momentum indicator was coming back to the midline but due to price action we have started another bearish squeeze it seems like, our red bars have started increasing once again which isn't a great sign, what we are looking for here over a bigger timeframe is that push back to the midline where we then have the opportunity to get into a bullish squeeze. Now the reverse momentum indicator was moving very bullish coming flying out of the bottom buy zone, we have since crossed bearish and are coming back down fast. What i want to see here is a potential bounce off of support we have just below us, being in the buy zone on its own calls for a reversal and now that we have support here we can expect that bounce even more. Not financial advice just my opinion!
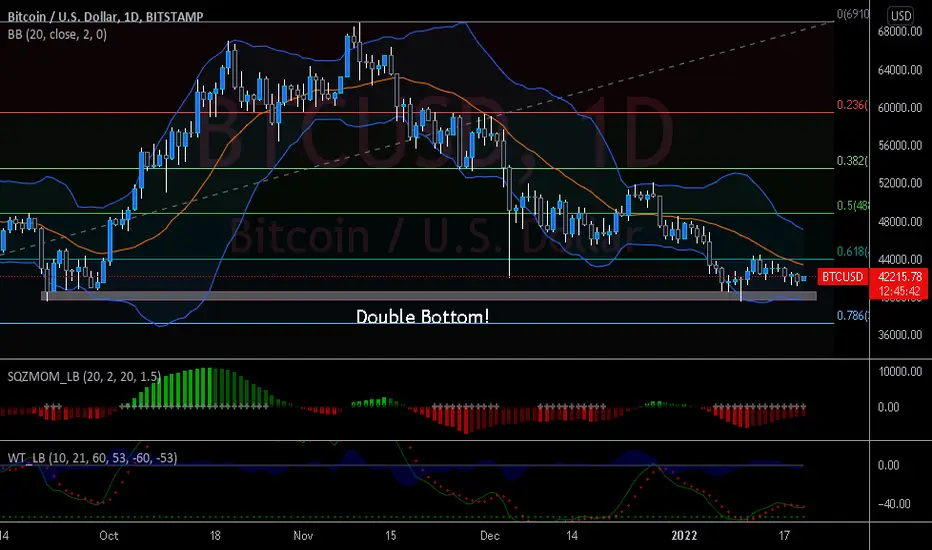
BTC DOUBLE BOTTOM!!Taking a look at Bitcoin on a daily timeframe i noticed something very bullish that ive somehow missed. a clear to the point double bottom has formed recently with price action showing some strength coming off of it, this overall if actually plays out is a big positive for the overall market in general! We are currently sitting inbetween the double bottom and the 0.6 FIB level, with heavy supports and resistances clearly above and below us! Keep in mind a push down below the 39616$ level invalidates the whole idea. Potentially some great buying and entry spots here for dollar cost averaging into different strong projects, Mid 39K seems like a very fair and reasonable bottom i personally would say. Looking at the bollinger bands we are currently trading in the bottom half but our first goal here to put us in a nice spot is getting back and above the midline which is currently acting as resistance, being in the top zone allows us the chance at climbing up to that top band, where as you all know by know can trigger quite the run to the upside, not only that but getting above the midline opens the door for us to reclaim the 0.6 FIB level which is a crucial spot at 44K. The Squeeze momentum indicator looks pretty good, we are coming out of a big short squeeze where soon enough we will be coming back to the midline (fingers crossed) This enables us to push into a bullish squeeze above the midline, due to us not getting a true bullish squeeze in quite some time throughout October to be exact, i think it is highly realistic that we could be seeing a massive bull squeeze soon enough, we need to see a strong push past the midline and into green territory, we need our green bars to increase day by day getting stronger and showing the rise in bullish momentum. Now the Wavetrend gives me good hope that we are going to be starting a decent leg up here soon, we recently bottom out in the buy zone and have since recovered, we currently are seeing what looks like to be a reversal happening, the wave came down slightly but is currently beginning to tick to the upside. Keep in mind that this moves slow and has relatively smooth transitions between waves, this means very minimal jagged movements and sharp turns, so what im saying in a nutshell is when we start to see a reversal play out we are not 100% but almost guaranteed to see price action respond to wherever the wave is headed, i should also point out here just like the SQZMOM we haven't seen a very strong bullish wave in quite some time, we had a decent wave but we only pushed upto the midline, what im looking for and expecting sooner than later is a strong bull wave pushing past the midline and topping out somewhere inbetween that and the sell zone! Not financial advice just my opinion!
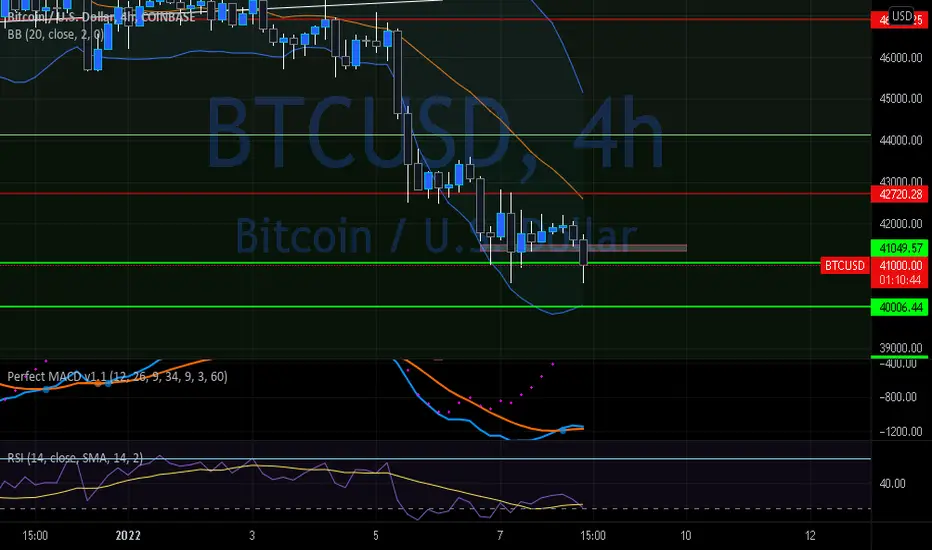
BTC Update!!Bitcoins really been struggling as of late and we are in some dangerous territory for price action, we are hanging out right above the 41K support level and the chances of us falling underneath here are rising everyday, realistically on this 4HR chart we don't want to see a close of course below 41K but also we dont want to see a close below our previous closes, i have marked out a box where we ideally would prefer to close in or above and we are a bit off this level but still have aprx 1 hour 20minutes until our next close. Closing below our previous closes gives some momentum to the bears and could ultimately bring us down even more, if we can't hold onto our 41K zone we are looking at 40K as our next stop. We did get our bullish cross on the MACD but its not looking so great, our MA's are pressed together and our blue MA is actually trailing into our orange now giving the bears an easy shot for a bear cross. Our histograms not looking ideal either, we are seeing a decreased green bar for this current 4HRs and thats not a great sign, its showing us that the bullish momentum is not really here and is fading out already, ideally we want to see the blue MA bounce off the orange one giving us that separation we need. The RSI however could be looking up soon enough, we are about to enter the oversold zone which is a good sign and this could give us that boost up that we need, we want to see a break up and above the yellow SMA as our first target but the main goal is getting back up and above that midline, being stuck below keeps us in a confirmed downtrend which of course isn't great. Getting back up and above this midline gives us the chance to reclaim a confirmed uptrend which is exactly what we want but keep in mind we have a ton of work before we make that happen. Not financial advice just my opinion!
Bitcoin - next move on 1D!Given our ground zero on 22 June 2021 at 28700 USD, Elliott waves on 1D suggest that 42000 USD was our correction point A.
Based on that it is fair to assume that point B would be between 38.2-62.8% Fib that derives from ATH impulse to point A.
However, I would consider to go Short at 50% Fib, around 55500 USD area. This where the price can be expected to bounce off the blue trend line and thereafter, drop down to 33300 USD which would be point C.
Indicators support feasibility of point B
Both RSI and MACD are at the bottom of a falling wedge.
Stochatic RSI is in the position of growth.
RVI is following an uptrend.

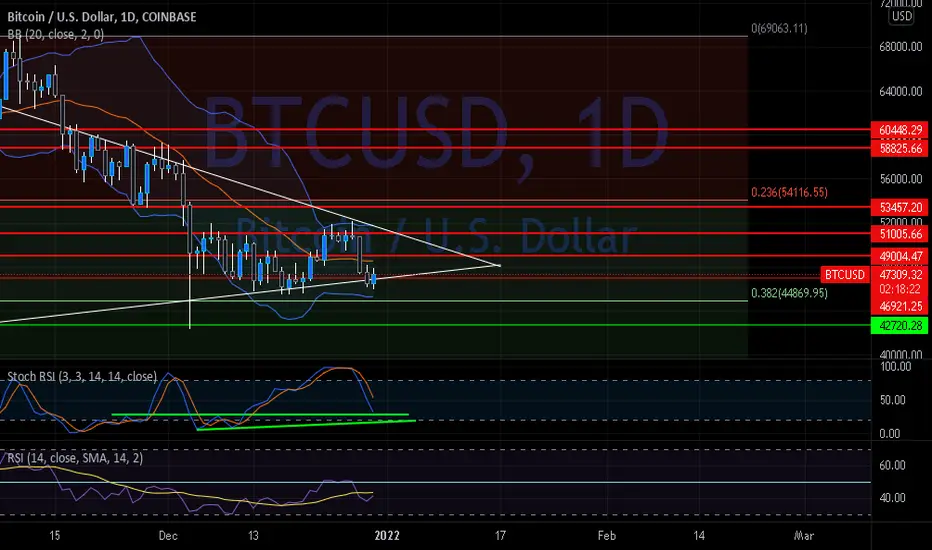
BTC Update!Checking out our Bitcoin daily chart i mentioned we were trading inside of a bullish pennant and yesterday we had a false breakout and a close outside of this pennant, since then we have recovered quite nicely and are moving our way back into this bullish pattern! we do have a ton of work to do though, we are facing resistance at the midline of the bollinger bands, 49K, 50K, 51K and 52K, personally i think a great first step is making our way back and above the 51K mark, this gives us a great base of support and the ideal spot for us to start making some upside rallies, think breaking 50K is very bullish aswell but personally would like to see a break of 51 and 52K before we really jump the gun! A must break for us short term is the midline on the bollinger bands, we gotta get up and above here to gain that bull momentum, doing so effectively opens the door for a climb up the top band and an explosive upside move that is much needed right now. The RSI is coming up steadily and we aren't very far off of the midline, however we are facing resistance coming from the SMA (yellow), this is definitely a must break aswell before we can make that midline push. The reason our midline is very important here is due to the fact that being below it keeps us in a confirmed downtrend or sideways price action, getting up and above while holding this midline puts us back into a confirmed uptrend and relieves some of that downside pressure. now the Stoch RSI which goes hand and hand with the RSI and is also a faster mover, we notice we are on quite the fall to the downside but what interests me are the very possible reversal spots where we could see that upside bounce in turn bringing the RSI and price action along for the ride, we have a couple obvious spots where we could expect to see a bounce, uptrend support leading to the bottom of our zone and aswell as regular support slightly above that! Think the uptrend support is more likely due to it being in the oversold zone and its a bit aways away from the stoch rather than our horizontal support being just below the Stoch RSI! NFA Just my opinion!
Bitcoin local 4H scenarioBINANCE:BTCPERP
According to news what we have got today from FED possible to see positive scenario in global trend and continuation this bull run till summer 2022. In local picture we formed 3rd bottom on 4H MACD usually its a sign for recover.
If we are break out 49530 downtrend line and middle line downtrend channel since November we should retest once again 52400. Only after retest break out 52400 we can talk about global continuation for crypto at all.
My scenario since post 10December IDEA still in play.
Hope you enjoyed the content I created, You can support with your likes and comments this idea so more people can watch!
✅Disclaimer: Please be aware of the risks involved in trading. This idea was made for educational purposes only not for financial Investment Purposes.
Don't forget sub and join my channels under this idea!

Bitcoin - value of S2F model and TA on 1MMany bitcoin investors believe in the S2F (Stock to Flow) model and expect bitcoin to rise to 100,000+ USD any time soon. The model advocates that an asset has a production/supply limit, for example, like gold and silver and therefore, in the long run, such an asset will only grow in value. This is all true!
Hard asset
Bitcoin has a limited supply of 21 million. This makes it a hard currency, so by 2040 one can expect it to be worth 1 million USD per unit. By that time, Bitcoin will mainly be used as a banking transactions' instrument, while for investment purposes a new fork will be created most likely.
What's the buzz?
If you are a long term investor and time is on your hands, then simply wait another 15-20 years and you'll collect your jackpot. However, if you are a trader on 1D, then you should take into account that bitcoin is a high-risk asset due to its volatility, it runs in cycles that are determined by macroeconomic factors and its drop to 10,000-7,000 USD is more than real. If in doubt, then take a look at US Binance on October 21, where the price of bitcoin fell by 87% from 65,000 USD to 8,200 USD within a minute.
It's important to remember that the cost of bitcoin is primarily the cost of electricity used for mining + the cost of its farm's infrastracture. For large industrial farms, such as Poolin, Bitmain, Crypto Scientific etc. that make up the main share market - the cost per bitcoin is around 3000-5000 USD. Everything else is mere speculation and the belief in hard asset. So ask yourself - under what circumstances can the price of bitcoin fall in the S2F model?
A simple example of a cycle
Take any famous artist. During his life, he can create only a certain number of paintings. The price of a painting grows progressively as the artist becomes more famous and demand for his work increases. This is a S2F model. A painting's cost bottom remains unchanged - it includes the canvas, paints for drawing and the time it takes to create the masterpiece. All of a sudden a global war arrives. There is misery and hunger! This is a cycle. During this period, an artist's painting loses its value and is sold for a loaf of bread.
Recession
In this insance, bitcoin's war is a global recession that has already begun. This is confirmed by US bonds' price inversion. As in the last 9 recession cycles over the last 60 years such course was always followed by a market crash. Based on previous cycles, the recovery of the US economy took an average of 9-16 months. Hence, we are looking into 2023 at least before any further growth!
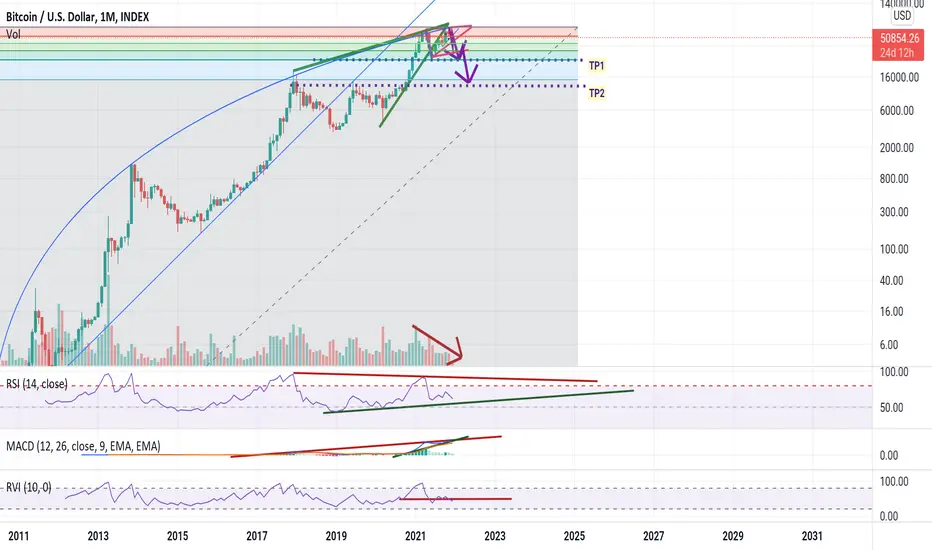
TA on 1M
The blue curve is now flat at the top. The upward blue trendline was broken back in November 2018. In June 2021, the price exited the green wedge and bounced off it in October 2021. Two days ago the price broke through the second pink wedge, so far only as a shadow, but it is only the beginning of the month. RSI has a clear price divergence. MACD is at the peak of a rising wedge. RVI has broken through 50. Vertical volumes keep falling while price rises.
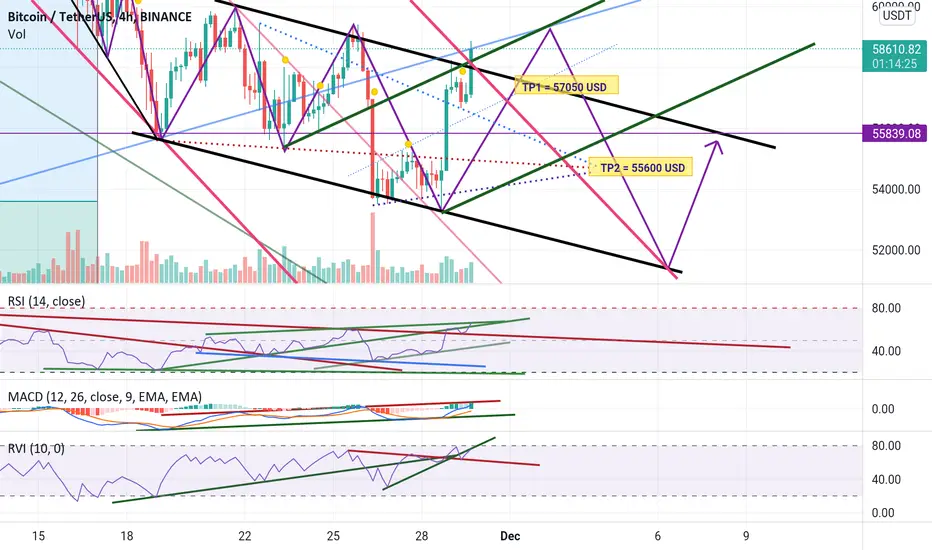
Bitcoin - analysis on 4HRSI , MACD & RVI reached their resistance lines on 4H, therefore, it is safe to expect the price to go down to its TP1 at 57050 USD level. The price may still go up to 59300 USD before or after this correction. The chart shows main channels: the main one is in pink colour, the flat is in black colour that the price recently broke out off and the new potential channel is in green colour.
Thereafter, it's best to watch the price action closely. In principle, the price could go all the way up to 65000 USD. However, it needs to stay in this area and bounce off the blue trend line first as a confirmation.
Therefore, it would be wise to see how the candle on 4H and 1D closes at the end of today. I am more in favour of the price going down to TP2 at 55600 USD, followed back by a small correction and then proceeding with a dump to 50500 USD.
Let's see how it plays out.
Bitcoin and Ethereum - what to expect in 2022?Logarithmic TA on 1W shows that the price has already exited the rising green wedge. The price is currently wandering within a second ascending wedge in pink colour. Once the price breaks out of the wedge, it should be expected to go down in proportion to the height of the wedge (thick line shown in purple colour). In support, RSI & MACD show divergence in relation to the rising price. RVI has already broken through 50 - which is the first sell signal. Vertical volumes also continue to fall while the price rises.
I want to emphasize once again that this chart purely demonstrates a position perspective! Locally, on lower time frames, such as 4H, the price will continue to go up and down.
Also, I want to point out that ETH has a strong correlation with Bitcoin. Its local movements may differ, but the global trends remain the same. Bitcoin is the defining cryptocurrency! Therefore, the analysis is based on bitcoin! ETH will follow Bitcoin's lead.
What about the flight to the moon of 100,000 USD?
The main argument for the price to rise is based solely on past cycles. However, this is not much of an analysis as it does not take into account macroeconomics. It's like saying my car has been driving 200 km without a stop and therefore, it should drive another 200 km. No, buddy! You need petrol before you can drive any further.
In 2021 bitcoin's price went up as a result of hedging against speeding inflation in US, which from May remained above 5.4% on average. The only way bitcoin's price is going up is if inflation continues to grow towards 10-15% + a few more trillion dollars are invested into bitcoin capitalisation. If inflation starts to slow down or the interest rate is raised, there will be no need to hedge against further inflation and as a result bitcoin price will fall. Yes, it will reach 100,000 USD, but not in the nearest term.
How does macroeconomics support the downtrend?
1. The FED has already made adjustments to its monitoring policy. Although the interest rate has not yet been lowered, the volume of purchases of financial assets (bonds) has been reduced, which will serve to slow down inflation.
2. There is a real estate bubble in China. Several large construction companies have already defaulted, and the largest Evergrande is already standing on its last breath. The company's shares collapsed.
3. The energy crisis in Europe is in full swing.
4. A recession is coming. Look at the SP500 index on 1W - the price is already at the peak of the rising wedge. No economic growth in 2022-2023 is to be expected!
5. Tether is not going to save the day by creating and pouring more USDT into the market. With their ongoing law suits for market manipulation, lack of auditing and USDT backed by only 2% cash and about 68% by securities and the remainder backed by thin air - is more likely to take a big hit.
6. Lastly, the bankrupted Mt Got (the largest exchange in the past), having lost a lawsuit, is expected to pay compensation to its depositors in the amount of 180,000 bitcoins. The exact date is not known, but it was stipulated to happen in February-March 2022. Would you allow some guy to get 100,000 USD per bitcoin in compensation only to crash the market?
Conclusion
I hope I got my message across. The herd is driven by greed while market makers are looking for liquidity. I will provide a more detailed vision of the price movement in my next article. If you are on the same wavelength - put a like, subscribe, comment!

Bitcoin - technical analysis on 4HThis is TA based on 4H. I see two path options for the price action.
1. The price will follow the path in purple colour. Provided that it breaks the upper descending resistance line in pink colour and then bounces off it (use 15M for this confirmation), then we have a formation of the local H&S in purple colour and the price is likely to go towards the green rectangle area around 64500-65000 USD. This area represents a resistance based on horizontal volumes. Also, this will be the top point for the right shoulder formation of the global H&S in black colour. This is a good place to go short on 1D - where price may drop to its correction level of 50500-47000 USD. This option seems more logical, a perfect trap for hodlers and bulls, however, it is still a speculation.
2. If the price does not break the pink resistance line and drops below 55300 USD, then the path in light blue colour is most plausible.

Bitcoin - ascending triangle is formed on 15MBased on the formation of the triangle it is plausible to expect the price to go to its resistance level in light red colour. The height of triangle's formation also supports the distance of the price action. Also, the last 3 candles including the one today on 12H show a local trend reversal, which also support current Long.
Once the price reaches the green rectangle area around 59200 USD, it will be at the top of its ascending wedge beteeen two green lines. Therefore, a drop to a local support line in pink colour would be expected.

Bitcoin - next move on 15M for scalpersI see two possible scenarios for the price action on 15M:
1. Direct push to resistance levels - in the area with a green rectangle where all three trend lines cross.
2. Retreat to triangle's support line in red colour, bounce off and proceed to green rectangle area.
Upon reaching green rectange go Short for the next few candles on 15M.

Bitcoin - speculation to go Long on 1D!Yesterday's candle on 1D closed as a pin bar and RVI broke its resistance line and reached 50. Provided that RSI and MACD bounce off their support lines, then it it plausible to expect the price to follow its path as presented on my chart. This is a potential price action for a local correction that may take up to couple of days to complete. The green rectangle represents a good entry point to go SHORT.
If price action begins to follow the path then two TP may be available for grabs:
1) TP1 at 62500 USD - first level of correction.
2) TP2 at 65000 USD - this is where we have a 61.8% correction on Fib, ascending resistance line in blue colour, a resistence level based on horizontal volume, as well as a potential formation of H&S (displayed in black colour).

Bitcoin - to be or not to be?The last 2 weeks of flat had both bulls and bears sliced and diced. MM having a blast while deposits get liquidated.
Where is the market heading to?
The price did make its new ATM yesterday. MM got their SLs from shortists. This may seem like a continuation of a bullish trend no doubt. However, the price is at the top of an ascending wedge on 1D. RSI resistance line has not been broken yet. RVI is still below 50. Vertical volumes are still declining. The bullish trend may well continue, but it's best to wait for confirmation from the indicators.
I have tried to get some constructive arguments from chats and articles on why the price is expected to go up and reach 100,000 USD other than on the fool's theory where the price goes up until the last fool buys. Some prefer to call it a parabolic price increase. However, nobody seems to offer any logical explanation. I'll make an attempt on their behalf.
1. Bitcoin is a hard asset, the price will go up and reach one million eventually.
2. Tether volume has increased, therefore, bitcoin cap is well justified.
3. Bond price is rising, yields are falling, cash is moved from bonds into bitcoin.
4. Bitcoin is a commodity, a digital gold, gold price is expected to rise.
I can make a constructive argument.
1. While bitcoin may well reach the moon, it may crash a few times on its way. Regardless of being a hard asset, it is still a highly risky asset due to its volatility when it comes to futures. It can crash at any time up to 80-100%. US Binance 1 minute crash on 21 October 2021 is a perfect example.
2. Tether Ltd has not been audited still. Tether's assets that support USDT, do not exist, at least partially. In May 2021, Tether published a report showing that only 2.9% of Tether was backed by cash, with over 65% backed by commercial paper. New volume that has been put into circulation in October has been spent already. I am not going to go into the details of the law suits that claim almost 1.4 trillion USD in fraud damages as well as a relationship with the exchange Bitfinex, which turned to Tether for financial help after the exchange was robbed of 850 million USD in 2018. The bottom line is that Tether is just an ordinary money laundering scam, which is already on the verge of a bubble.
3. FEB is decreasing asset purchasing by 15% at least on monthly basis, which will slow down inflation rate. Lower inflation will decrease Long hedging contract volumes and hence, reduce bitcoin price. At the end of a day, bitcoin is used as a hedging instrument from negative bond yields, which are now at their rock bottom.
4. Although botcoin is a commodity, it has a greater correlation of around 73% with SP500 on 1-10D in 2021. Therefore, it is not clear why would bitcoin should rise if equity market falls. Also, check out gold chart on 1M. There is an obvious divergence on MACD and RVI from around June 2011.
What's the plan if you are trading futures?
1. To minimise risk, it would be smart to go Short around the navy blue resistance line from 73500 USD to 77500 USD depending on where the price hits it. The second entry point for Short order where you may double your lot can be at the crossing of a dotted black line. Make sure you also have your Long orders at 52500 and 47500 USD. These entry points do not suggest a trend reversal at this time, but merely a profit making opportunity from short/medium term impulse reversal.
2. If you already have an open postion and your nerves are catching up with you, consider hedging, make a lock, and wait for the price to hit either resistance or support level. Then either close the lock or continue with a lock and enter the market with a double lot in relation to the original size position to either break even or take profit.
Remember that bitcoin had no correction still and that it can happen at any time. MM will need that liquidity shortly.

BITCOIN AT A CRUCIAL POINTrestianst lines and support lines. maybe new ath.
just watasd asdeadadsdgdtgddddddddddddddddddddddd

BTC Dominance Fake Breakout!!?Checking on how are bitcoin dominance is doing and we find something most wouldn't have expected, a breakout to the upside of this historically bearish pennant, but it may not be what it seems and i think this could be a fakeout scenario, we are currently breaking up above the 42.37% heavy resistance line and will be fast approaching the 42.62% heavy resistance line if we continue. But what im noticing from many indicators is that technically we are looking very bearish as you all are aware, ive been talking about this hidden bearish divergence continuation pattern and bearish pennant pattern a lot over the past week. First lets look at our RSI, we are once again up and around the previous highs resistance line and we could definitely still see a bounce off and fall down like we recently just saw, we aren't in a confirmed uptrend yet it is just way too close to call plus we haven't spent much time above the midline yet. Now check out the MACD we are sort of looming on a bearish cross and have been for some time now, we are seeing a very flat and even sometimes decreasing green histogram showing bull momentum trickling away and our MA's are very very close together slowly moving upwards, but one move could trigger a huge bearish cross which i personally think is likely after this long drawn out green period. Now lets take a look at the bulls and bears power, we clearly see much greater bear power on BTC's dominance, we however are seeing a slight pop up in bulls power likely due to the couple solid green days we just had, we notice our black trend line is approaching the midline and we definitely want to watch this as we could see a shift in power coming up soon, or we could get a strong bounce and continue of where we currently are! Overall i think we are still going to see a big crash in BTC dominance due to many factors but the biggest being the clear hidden bearish divergence which is a continuation of trend pattern, and when this pattern popped up we were in a clear strong downtrend signaling a continuation of that, and keep in mind sideways movement can play out for a little bit and usually always leads too a strong move and once this sideways action is over i personally see us falling to the downside, could be tomorrow could be in a week, the divergence patterns almost never play out right away and can take some time so keep that in the back of your mind knowing that we could be in for a fall sooner than later, and as i said before and i will say again if we do see a big drop in dominance bitcoin will feel that fall and therefore altcoins will for sure take a hit initially, but afterwards we can expect some big gains! Not financial advice just my opinion!

Bitcoin's reversal in play!!As you all know i recently came out with a TA regarding the bullish divergence for BTC and we have since seen bitcoin make some nice moves to the upside starting our path to this trend reversal to an uptrend after a strong short term downtrend. We are currently facing some heavy resistance at 48K aprx as we expected, this level over the past year has been either very strong support or really strong resistance pending which side we are on, now my thoughts are that we are due for a little couple day cooloff after making 5 strong green candles and posting a % gain of 19.5% from the bottom of our first green candle to the top of our current candle, plus due to the fact that we are really struggling to take back this level, we have had 4 touches and attempts at 48K and we have been unsuccessful, now we will have to see about todays daily candle at close but even then i think we could see a little cooldown for even a day than get back to business. A retest of 47.3K and 47K could be a likely scenario and a healthy one for sure if we can hold without breaking down and would strengthen these supports, we have many many under laying support levels so i wouldn't count on going to far if we do see a red day soon. On the other hand we do have many overhead resistances but honestly i don't think these levels will be much of a problem once we really start gaining momentum. Now looking at the pivot bands, many traders or TA guys may look at the bollinger bands and think we are easily going to keep pushing up to grab onto that top band but i don't think this is the case yet, thats why i put on the pivot bands, we notice we are constantly poking into that red zone and what usually happens shortly after having a few touches we see a little bit of a pushback from the bears, vise versa on in the green zone as you can look and backtest, we are on our forth touch in this zone and that is part of the reason i believe we are going to see a red day or two but like i said before there is absolutely no need to panic, this would be natural price movement after getting these 5 green candles in a row. Also to add to our support we have the PB midline which is currently acting as support just like the bollinger bands, so we have quite the solid floor below us. Now lets check out the RSI, as we can see we are currently facing some longer term downtrend resistance coming from back in early august, we look too be getting a bounce off here but the main thing is that we are once again above the midline back in uptrend territory, i've highlighted the midline because as most of you are aware we have to continue to hold this level we don't want to break below here and get stuck because like i said we are in uptrend territory and don't want to loose that already. Now the MACD is looking fantastic we are seeing steady increases in the green bars on the histogram showing a rise in bullish momentum and we are getting some great separation from the blue MA, we are quite a ways away from a bearish cross and that brings me to my final point. If we do happen to see this more than likely day or two of red candles that realistically shouldn't affect this MACD cycle due to the fact that we have big spread in the MA's and the Blue can afford to fall a little bit without even coming close to a bearish cross! Not financial advice just my opinion!
