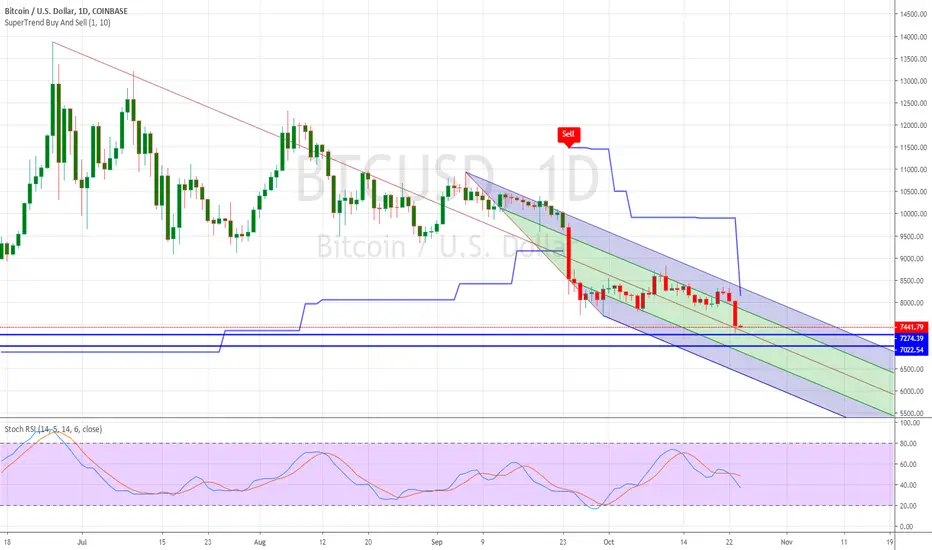
BTCFinal destiny to the buying level for this year 2019. Level watching is 7274 ( personally i have a buy order at 7300). While this is not the perfect support level, the major one is at 7022. It would be really disastrous if it breached this level and closed below it. Still riding the sell signal which is close to turning into a buy signal. Not a good price to short now. This could happen before Oct 30th with probability of it happening on the 27th/28th of Oct.
Bitcointechnicalanalysis
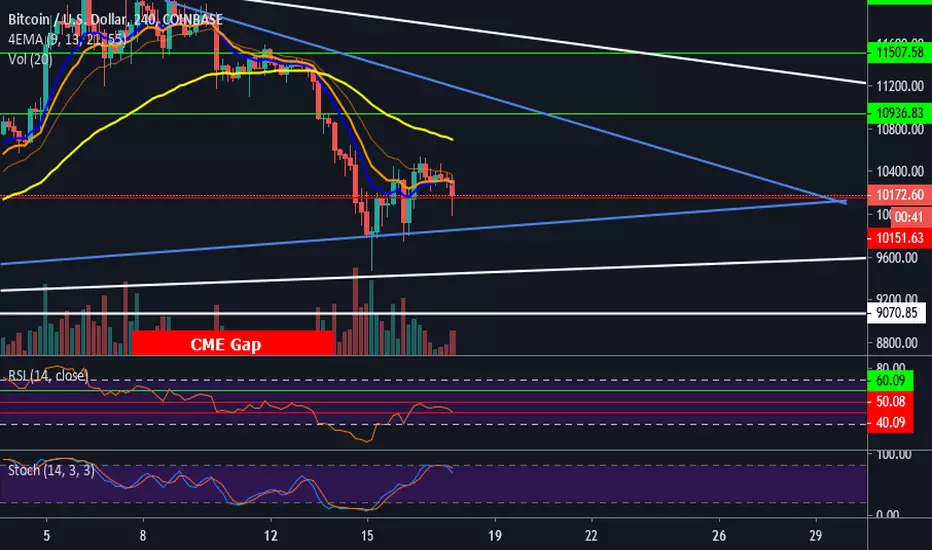
BTCUSD Failing to Rally Past 21EMACurrent trading path showing signs to break to the downside, unless a surge to the upside is realized. We failing to rally past the 21EMA, even if that is breached we would need to blast past the 55EMA to register any bullish movement.
Bull Targets:
10500, 10800, 11500 so much confluence on the way up we will likely not rally past that unless some magical volume pushes us past that
Bear Targets:
10000, 9700, 9000, 8500 (Unfilled CME gap) very strong resistance on the 10000-9000 range a clear pass of these range is needed for further lows.
As always Trade Safely, Happy Trading!
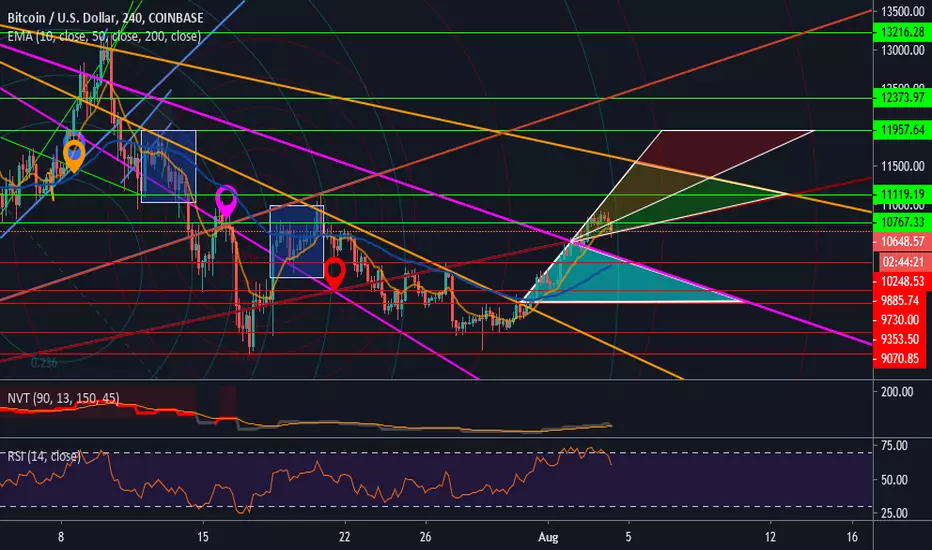
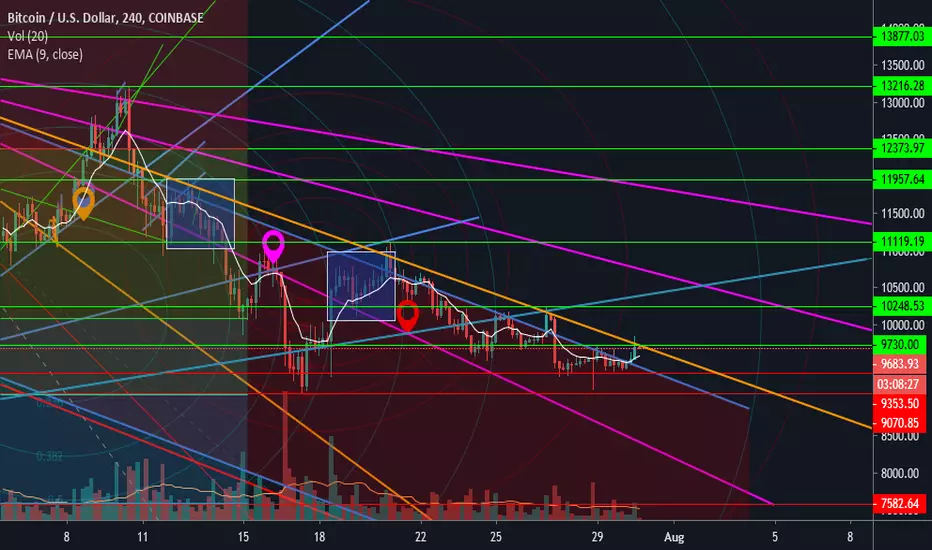
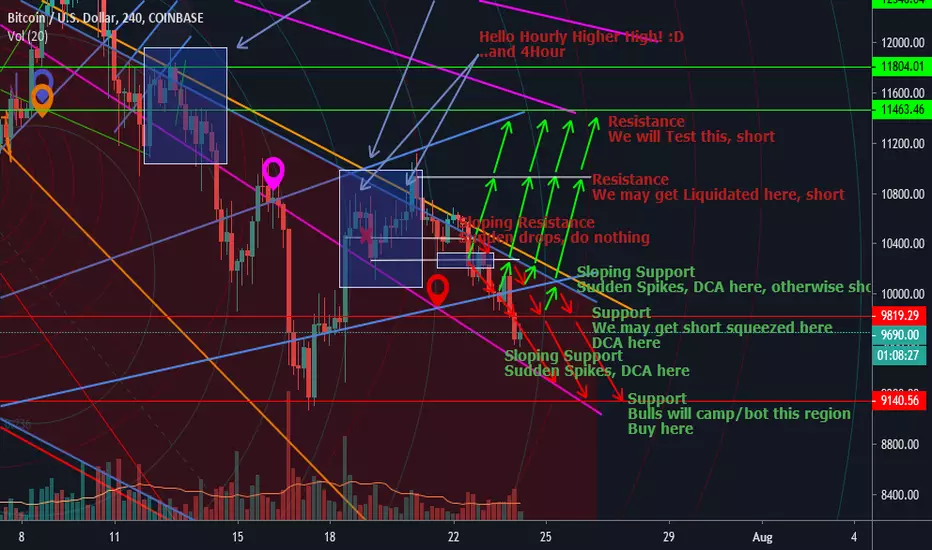
BTCUSD Housekeeping, Zoom out for clarity!Been a while since we looked at bitcoin, that's cause a lot of sideways move makes for boring reviews. So here we go after the recent dump we have removed some clutter out of the chart and zoomed out for a bigger picture type of trade opportunities.
What's new?
-Bitcoin is approaching what we believe is the strongest resistance line going back to its first ever parabolic move
-Failure to hold this line will see us crashing hard into yet lower lows and most likely revisit 7000 ranges
-As time passes with more and more drops we being squeezed into an ever tight channel and 10000 becomes support the bulls don't wanna drop
What's the Good News?
-Well, one could short until 10000...will take some balls, or paws!
-A trend reversal is always looming, the RSI is extremely oversold, flirting below 30
-Targets for the Bulls should that rally come 10900, 11400, 11800
-Breaking the sloping resistance could see us retesting 12300 failure to breach it would see us rinsing and repeating the same old trend
As always Trade Safely, Happy Trading!
Words from the skeptical: Bitcoin is nothing but a Ponzi Scheme for the moonboys, this is not financial advise, I am nothing but a moonboy!

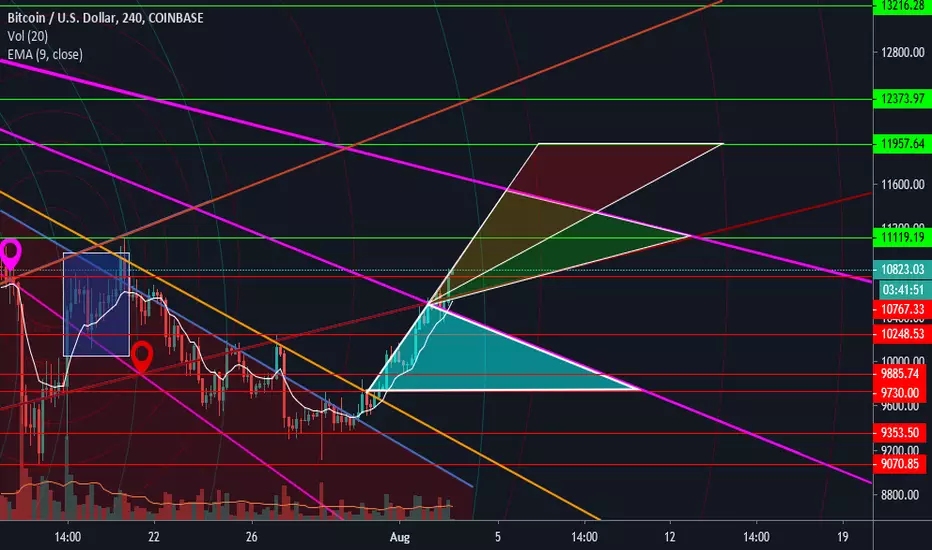
BTCUSD...Guess that was the top...for now!Like text book we failed to breach 11000-11200 range and we now as of writing back to 10600 and falling, play your cards close to your chest though as this may very well be a fake-out to squeeze longs out as well. My last post has the whole story, it may be found on the chart itself or related posts, be kind to have a look, not much to say right now.
BEAR TARGETS aka support ranges:
10400,10200,9700, worst case 9000
BULL TARGETS aka Resistance ranges:
10700, 11000, 11500, best case scenario 12000. Please note that 11300 to 11500 has so much confluence is not even funny.
A word from the Greats: Rome was not built in a day, take your time with this Trades.
As always Trade Safely, Happy Trading!
BTCUSD Either way we going up...What's the Top Though?!No matter how we look at it we look at it the bulls are in control after breaking the 10700 mark on the first attempt. We now well poised to climb towards 11000, breaching this could see us on our way towards 11500 and possibly the holy grail of the current rally at most likely 12000, anything above this should be considered a bonus. Please note this would needs to be catalyzed by a breach of 11000-11200 marks.
Now onto the bear side, failure to hold 10700 might see us tussling with 10400 again probably ascend from there, failure to hold 10400 will see us drop further towards 10200 and hopefully hold fort there otherwise 9800 isn't too far away. Rinse Repeat i guess.
Words for the wise: This might happen all in one swift long fast candle as well, so have your running boots while you sleep! This is by no means Financial Advice!
All things considered, Trade Safely, Happy Trading.
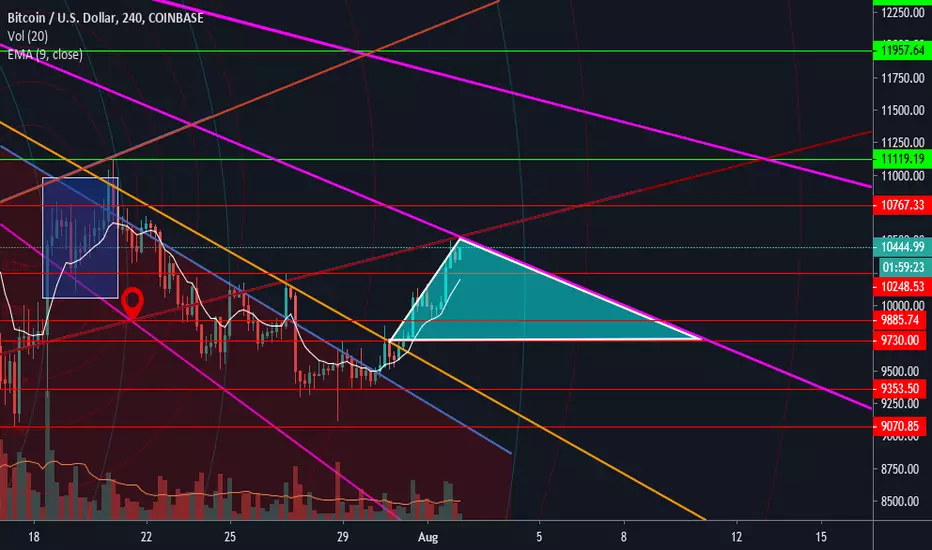
BTCUSD its a Candle Trend Line Love...until Whale! LOLDont you love it when candles make love to trend lines, they just meander as expected and every piece fall into place? Thats the beauty of technical analysis. Poetry aside, a re-cap of what happened:
1- A steady EMA
2- Slow climb towards 10200
3- A breach of Resistance at 10200
4- A rejection almost to the T on the sloping resistance and the extrapolation of the first parabolic break
Whats next?
1- We will trade on the apex of the triangle most likely in a steady fall
2- Current Resistance at 10500 and falling, a clear break would take us towards 11000
3- Current Support at 10200
My take:
1- As long we keep above 10200 we are bound to break to the upside
2- Should we breach 10500, next major Resistance would be 10700
3- The current Resistance and Support difference is so tight its best to trade massively bearish only if you bearish or massively bullish only if you bullish, eliminate half of the problem and focus on one.
Word of Advice: This is not Financial Advice!
As always Trade Safely, Happy Trading
BTCUSD Unnatural Dump is Matched by Natural Pump!?After the epic 6% dump and pump, yup dump and pump that brought coinbase to its knees for a moment, we are now followed by the actual natural breakout to the upside. We now looking healthy to either slowly descend again or break the sloping resistance towards the next horizontal resistance.
Targets:
-On the upside, 10200, 11100 and 12000
-On the downside, 9300, 9000 and 8500
My take:
We are still looking bearish unless you comfortable trading a squeezed pattern then we could break the sloping resistance and re-test no higher than 9800.
As always, trade Safely, Happy Trading.
A word of ADVICE: This is not Financial ADVICE :)
BTCUSD Heading towards 9000 and possibly below it!?We currently painting the mother of all dumps of a candle that will easy match the 10% crash seen not long ago, next target 9100 and below. A reverse will see us back again on the meandering uptrend and downtrend that plagued us the past two weeks.
As always, Trade Safely, Happy Trading!
A word from our sponsors: This is no financial advice!
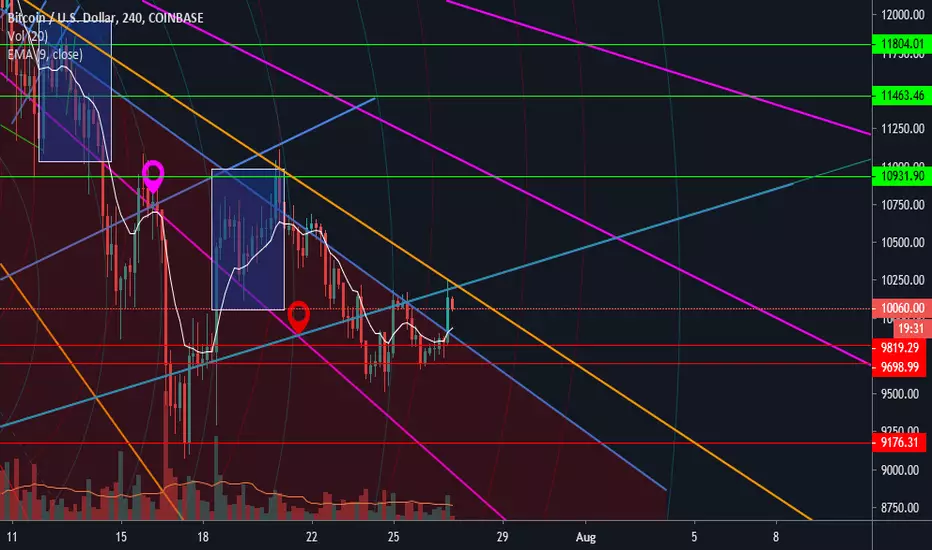
BTCUSD Trapped in another slow downtrend!After breaking to 10200 as expected, we again trapped at yet another potential slow downtrend towards 9800, 9700,9600, 9400...bottom line we have created so much confluence with indecision there is no clear signs of a major break. Bitcoin is now trading more like a stable coin than the volatile monster that we came to know. I will be adjusting the orange slopping resistance as the trend paints a better picture of direction, the rest have been playing in line with the trend so far.
Play your cards close to your chest, buy what you can afford and dump only at a profit, do not feed the whales.
That said Trade Safely, Happy Trading.
A word from the greats: This is by no means financial advice, I am just but a foolish bull!
BTCUSD trend is your friend until it isn't!So far we following predicted moves, gradually moving down and respecting all supports, it may charge up at once or gradually keep crashing, so if you believe that we will bottom at 8000 wait for 8000 otherwise DCA at key points.
As always, Trade Safely, Happy Trading.
A word from the Greats: This isn't financial advice!
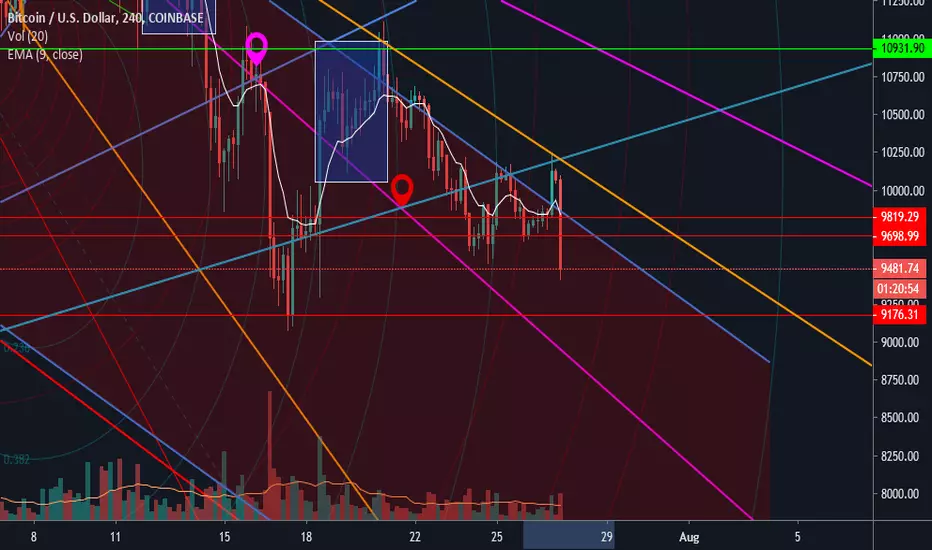
BTCUSD Head and Shoulders pattern, back to 10000?!We currently squared off the way up with a similar way down from the latest high. Whats next then? We will rise back up and re-test the sloping resistance, if rejected we will bounce back down and re-test the sloping support and a possible drop towards 10000 given the current Haed and Shoulder pattern. Bulls will be awaiting that range as well and if they fail to defend it we may crash as far as 9700-8000 ranges.
So far so good though, Trade Safely, Happy Trading!
A word from our sponsor: Let good old TA lead the way, this is not financial advice.

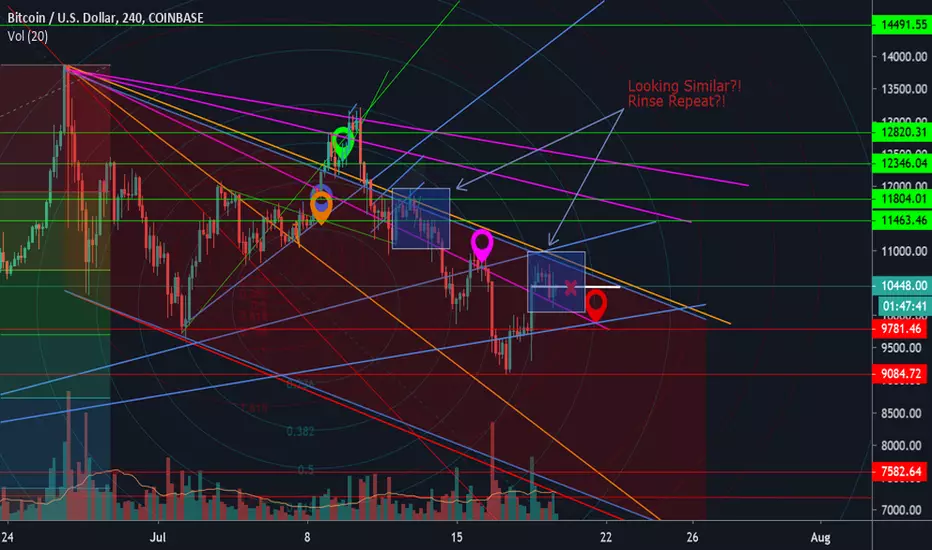
BTCUSD Past performance does not indicate future results?!Well, not much to be said here, looks a whole lot like the same scenario unfolding before us again, a long bull candle followed by a lot of indecision then came down crashing, but then as they always say:
Past performance does not indicate future results
As always Trade Safely, Happy Trading.
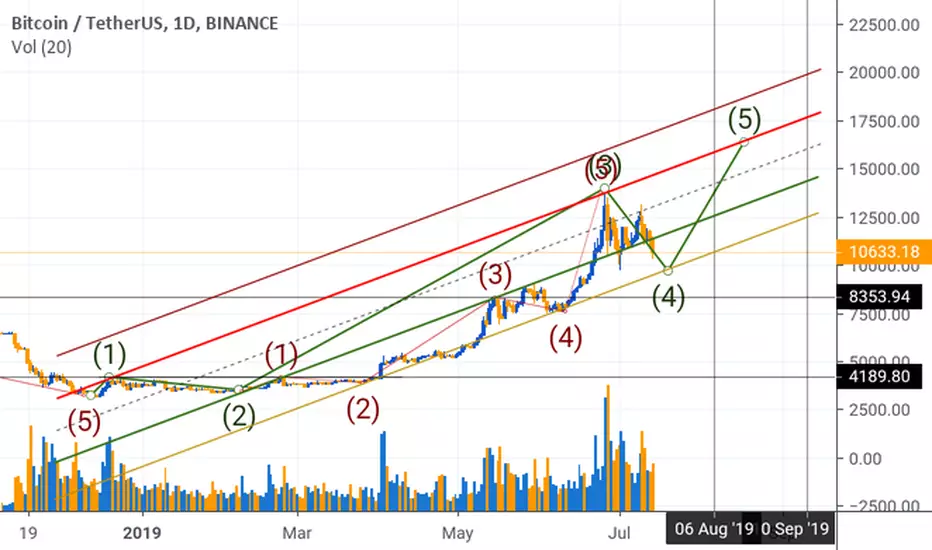
Near the buy zoneI drew a line in red, it is important because it connects the ending point of wave 1 and wave 3 and respectively there is green line parallel to red line but from ending point of wave 2
These lines are drawn professionally and are not simple channeling lines. So draw it for your self it is going to be a significant line in the future.
Back to elliott, i think we are in a complex corrective wave and i should ask, where is the best place for this kind of corrections ? The answer is wave 4
I did a lot of time in chart and i realized that this is most correct way to count. And i think we are not yet completed the 5 wave pattern and we are in wave 4.
So i think there is two options now.
1-we are forming a triangle
2-we are forming a complex WXY or WXYXZ
But also there is a chance to form more complex forms of correction or starting a new motive wave toward the downside but right now i dont see anything like that so i leave it there for more price action to have, to give a thought
Have fun
Stay tuned
BTCUSD Speculative move to the upside in 1h, 11700 Resistance!Should we maintain the current steady uptrend on the hourly and 5 minute charts we may re-visit 12000 by the end of the hour provided we break the 11700 sloping resistance line. Happy Trading.
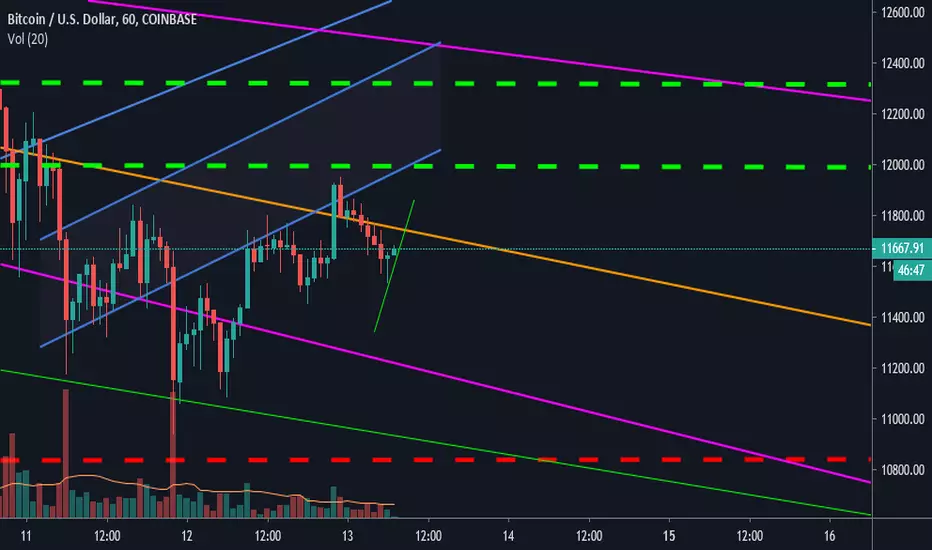
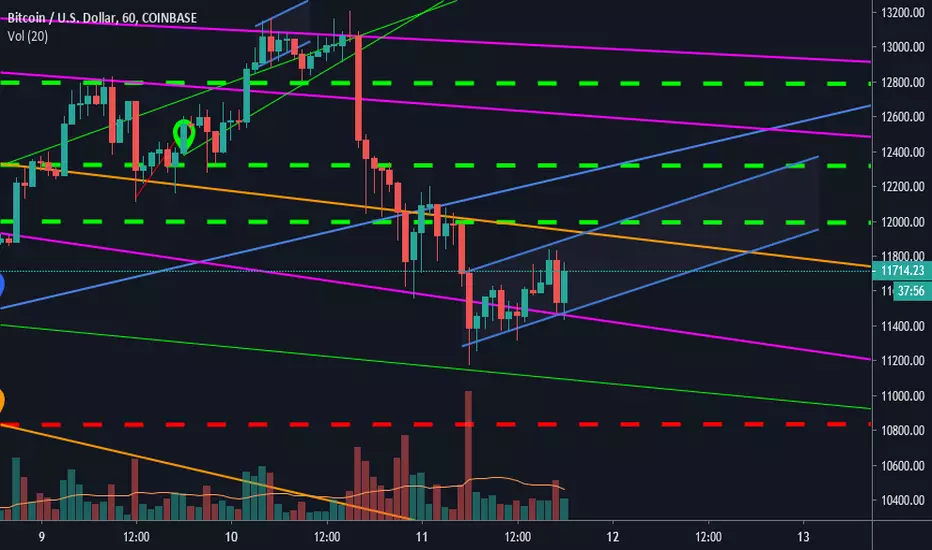
BTCUSD Sloping channel serving as tentative upward resistance!Yesterday we broke down past 11500 in a tight hourly channel we, then move gradually on the 5 minute trend and have steadily embraced the 11500 sloping parallel channel, a break up could see us re-enter this channel towards 12000. Expect a lot of up and down movement in the next few hours and a lot of bot action. Best consider DCA for entry and exiting strategically for small scaling profits.
As always, trade safely, Happy Trading. I will be attaching only my last 3 posts as related links as time goes, you welcome to dig deeper on my files for the step by step analysis that got us this far.
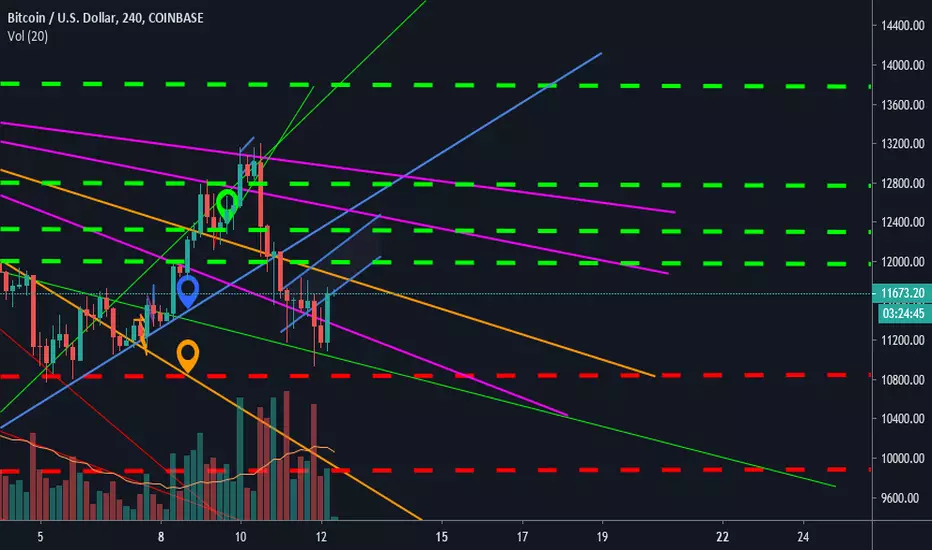
Tight channel trend towards 12000 or further down 11000We currently trading sideways with swings as high as 2% both up and down yet on a tight channel that might see us back re-testing 12000 resistance or crashing further into the 11000 support. This would be a great spot to pump up your bags if you sold the last rally, also a great spot to counter trade if you have been placed at a loss by the latest crash.
As always trade safely, Happy Trading.
BTCUSD 4-12 hours away from major break! 14k re-test looming!WE have since broke the 12400 barrier and now dancing well below 12800 once that shatters we have a frictionless path towards 14k, expect massive sell off and triggers at that region. This region also presents a major question. Do you sell for profits or HODL to the moon, if you have the guts to strap in we might be well posed to moon past 14k.
As always bring your best trading tools into the battlefield its about to get messy. Happy trading.

Bitcoin testing $3500 , Bullish or Bearin long term trend line it is getting support around $3500 - $3600 , It tested it 3 times in last one month, Tried to break but bounced back if it holds here then we can see quick bounce back if not then we can se downfall to $100 to $200 more from here & we can see it to $3400 - $3200
Again $3750, it is facing resistance in long term trend line , tried to break but couldn't able to sustain thr for long term and felt, Now its like a Ping Pong game or a kind of spring, getting more and more squeezed to the end.
$4000 is a resistance in short trend line and whenever it go thr then get rejected. So need to watch this also and trade, If it breakout after $4k then $4400 - $4850 will be the next resistance
It just broke short trend line and felt from there which is not good sign but if compare to the long trend line BTC getting support which is quite bullish.

BITCOINUSD Something big is going to happen after a long timeHello Guys !
This is BTCUSD 1 Day Chart , from Feb 2018 to today from where Bitcoin made a falling wedge by continuously making lower high and 2 times lower low.
Every time when Bitcoin made a correction it did a FIB level 61.80% reversal, three times but Bitcoin didn't make any lower low this time like it did previously, Now the end of the wedge and the descending triangle is approaching and we have 2 resistance level 1st one is $6600 and 2nd one is strongest one $6800 and the main upper trendline and we have 2 main support level 1st one is $6000 and the 2nd one is $5800.
Now, possible movement of bitcoin is Bitcoin can test the 61.80% Fib level $6800 and make a lower high and a correction like it previously did. (If $6600 break most likely will go to $6800)
Points to keep in mind :
1. If bitcoin break the upper trendline we can see a massive rally up to $9400-$10200 but not a bull run, its not necessary than every year a bull run will come, if someone is predicting and telling bitcoin will go to $20000, $50XXX & XXXXXX by the end of the year without any reason or whatever at this time its just nonsense.
2. If Bitcoin break the $6100 & $6000 it will test the 2nd support 5800$, if it also break the $5800 then we can see capitulation and unseen market volatility and all the retail investor and trader who came in late 2016 and beginning of 2017 will be out of the market. This time is for only Whales and institutional investor they will fully control the market.
3. 5800$ is the Moving Average(MA) support in the monthly candle of bitcoin.
4. if $5800 break we can see Bitcoin between $3600-$4200.
5. We will get an idea before 2nd week of Octuber 2018 which level the market will go .. So, be very careful at this time.
Hope you guys understood the analysis. Please support by hitting the like button and follow us.
-Thank You
