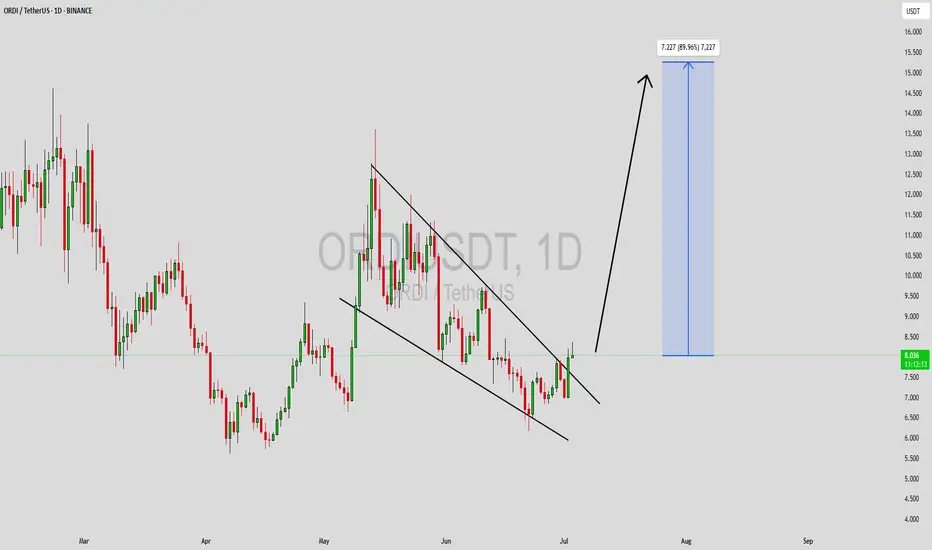
ORDIUSDT Forming Falling WedgeORDIUSDT is shaping up to be one of the more compelling opportunities on the crypto charts right now. The pair is forming a classic falling wedge pattern, which is widely regarded as a strong bullish reversal setup when spotted after a prolonged downtrend. This pattern often signals that selling pressure is fading and buyers are preparing to take control. With good volume building up, it’s clear that investors and traders are taking renewed interest in this project as it nears a potential breakout zone.
What makes ORDIUSDT even more interesting is the promising upside it could deliver if this falling wedge pattern confirms as expected. A projected gain of 70% to 80%+ makes this setup especially attractive for swing traders looking for medium-term positions with solid reward-to-risk ratios. The broader market sentiment is shifting, and coins with technically strong reversal setups like ORDIUSDT often outperform during such phases.
The community buzz and on-chain activity surrounding ORDI is also gaining traction, which adds further confidence to this bullish scenario. Many traders see the confluence of technical signals and increasing investor interest as a sign that this pair could soon break above its descending resistance line and rally aggressively. Keeping an eye on key resistance levels and volume spikes will be crucial to spot the right entry point.
✅ Show your support by hitting the like button and
✅ Leaving a comment below! (What is You opinion about this Coin)
Your feedback and engagement keep me inspired to share more insightful market analysis with you!
Bitcointrading
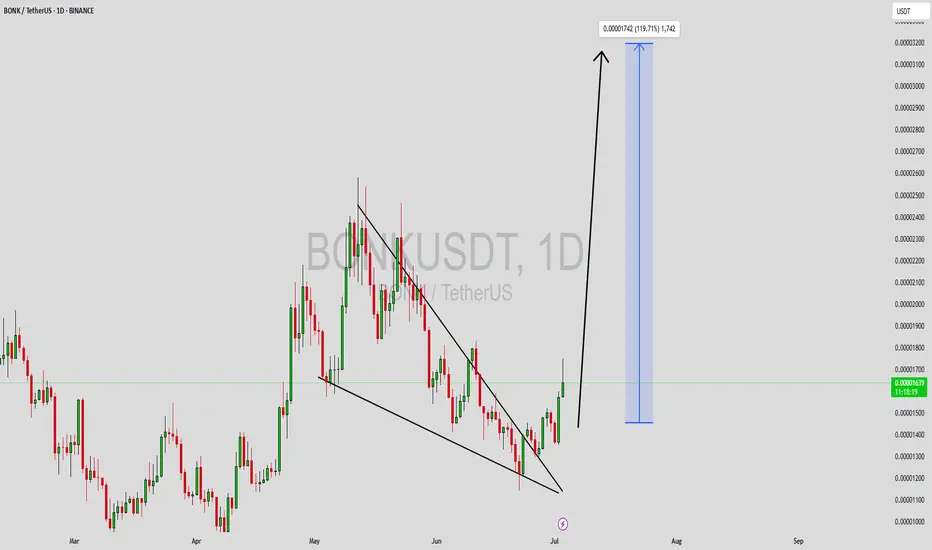
BONKUSDT Forming Bullish BreakoutBONKUSDT is showing some exciting bullish signs as it pushes out of a prolonged downtrend with a clear breakout setup. The chart you see highlights how this pair has been consolidating within a tight range and now seems ready to surge higher. With good volume supporting the current move, BONK is catching the eyes of traders looking for undervalued coins that have the potential for rapid upside. The price action shows a textbook breakout above resistance levels, which is often the first step for a sustained rally in the crypto market.
This pair has already attracted attention due to its unique community-driven nature and meme coin appeal, which tends to create sudden spikes when momentum builds up. As BONKUSDT attempts to deliver an expected gain of 90% to 100%+, it becomes an appealing choice for short-term swing traders and high-risk, high-reward portfolios. Many investors are betting on its potential to break through key price levels, which could trigger a wave of fresh buying volume.
As the crypto market continues to reward coins that demonstrate both technical strength and community hype, BONKUSDT stands out as one of those trending assets that could surprise to the upside. With a clear breakout from its falling wedge structure and the market sentiment turning positive, traders should keep a close eye on how it behaves around its current levels. Any strong candle closures above resistance could pave the way for an accelerated move.
✅ Show your support by hitting the like button and
✅ Leaving a comment below! (What is You opinion about this Coin)
Your feedback and engagement keep me inspired to share more insightful market analysis with you!
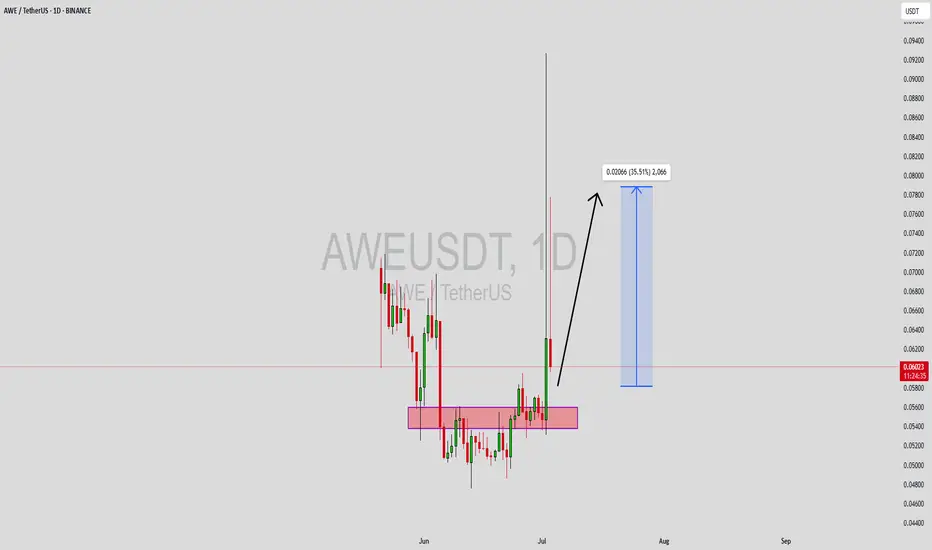
AWEUSDT Forming Bullish TrendAWEUSDT is gaining momentum among traders as it shows signs of a promising breakout from its recent consolidation zone. The chart highlights how the price has tested a key support zone multiple times and has now begun to push upward with increasing volume, suggesting that accumulation is taking place. This healthy volume is often the first sign that smart money is entering the market, laying the groundwork for a sustained rally.
Currently, technical indicators point towards a short-term bullish trend with a potential gain of 30% to 35%+. Such a move could be fueled by the break above the highlighted accumulation area, which has acted as a solid base for this possible upside. Traders looking for opportunities in altcoins with clear risk-to-reward setups will find AWEUSDT’s structure attractive as it shows a balance of stability and momentum.
Adding to the optimism is the fact that more investors are showing interest in this project, hinting at improving sentiment and stronger fundamentals. As the market sentiment improves, coins like AWEUSDT with good liquidity and technical patterns often lead the way for short but impactful moves. It’s a setup worth monitoring closely for swing traders who thrive on these breakout opportunities.
✅ Show your support by hitting the like button and
✅ Leaving a comment below! (What is You opinion about this Coin)
Your feedback and engagement keep me inspired to share more insightful market analysis with you!
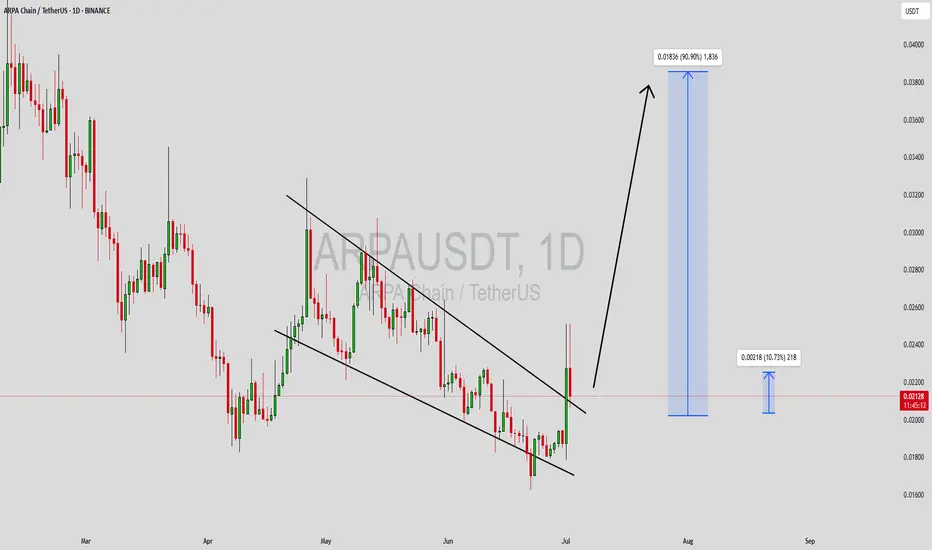
ARPAUSDT Forming Falling WedgeARPAUSDT is drawing fresh attention from crypto traders as it forms a classic falling wedge pattern on the daily timeframe. This technical pattern is widely recognized as a strong bullish reversal signal when backed by healthy volume and growing investor interest. The falling wedge indicates that the downtrend is losing momentum, and a breakout to the upside could trigger a significant move. With current market dynamics, ARPAUSDT is showing promising signs that it could deliver an expected gain of 80% to 90% or more once this pattern resolves.
Good volume levels in recent sessions confirm that accumulation is happening quietly, which is often the case before a breakout from a wedge pattern. Traders looking for high-probability setups should keep an eye on the breakout zone around the wedge’s upper trendline. A confirmed close above this resistance with increased volume could be the catalyst for a strong rally. ARPA’s fundamentals, coupled with positive sentiment from investors taking interest in the project, add extra fuel to the potential upside.
As more altcoins regain momentum, ARPAUSDT stands out as one of the most interesting pairs to watch for short- to mid-term gains. Technical traders and pattern-based investors often target these setups to capture explosive price action. Staying patient for a clean breakout and using proper risk management will be crucial to maximize the reward potential in this setup.
✅ Show your support by hitting the like button and
✅ Leaving a comment below! (What is You opinion about this Coin)
Your feedback and engagement keep me inspired to share more insightful market analysis with you!
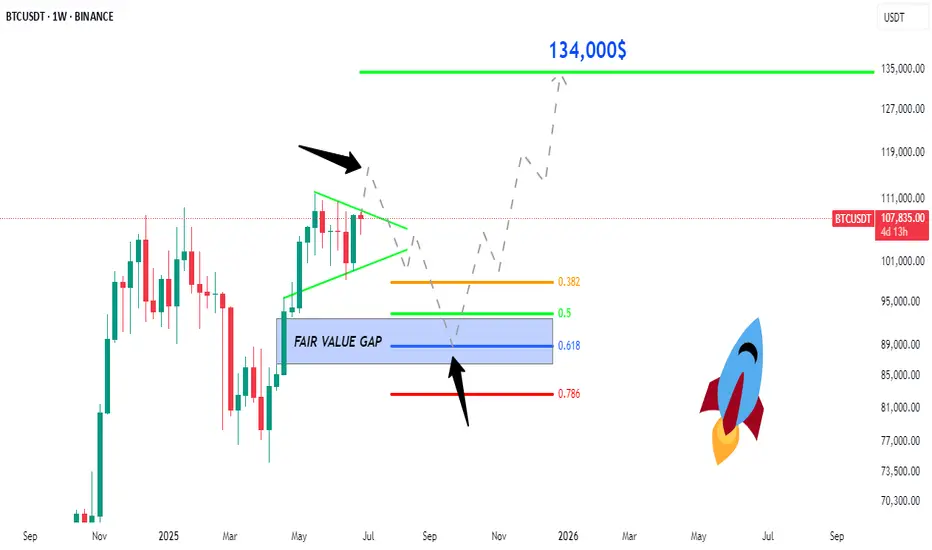
BTC: Price to 134,500$ , FVG, Fib 0.5 and 0.618 ratio ?Price to 134,500$:
Bitcoin is now moving in a triangle pattern, which is getting smaller. The price is around $107,758. Here is possible move is a breakout to the downside first, where the price may drop to fill the "Fair Value Gap" area, which is marked in purple. This area is between the Fibonacci levels of 0.5 and 0.618. After that, Bitcoin could go up again and reach the price of $134,000.
Trade Ideas:
I marked 2 areas with arrow let the price reach here and wait for confirmation in both areas. Specially in Fair Value Gap area.
Trade Signal:
I will provide both trade signal here so follow my account and you can check my previous analysis regarding BITCOIN. So don't miss trade opportunity so follow must.
BINANCE:BTCUSDT BITSTAMP:BTCUSD COINBASE:BTCUSD COINBASE:BTCUSD BINANCE:BTCUSDT.P CRYPTO:BTCUSD BYBIT:BTCUSDT.P BINANCE:BTCUSD
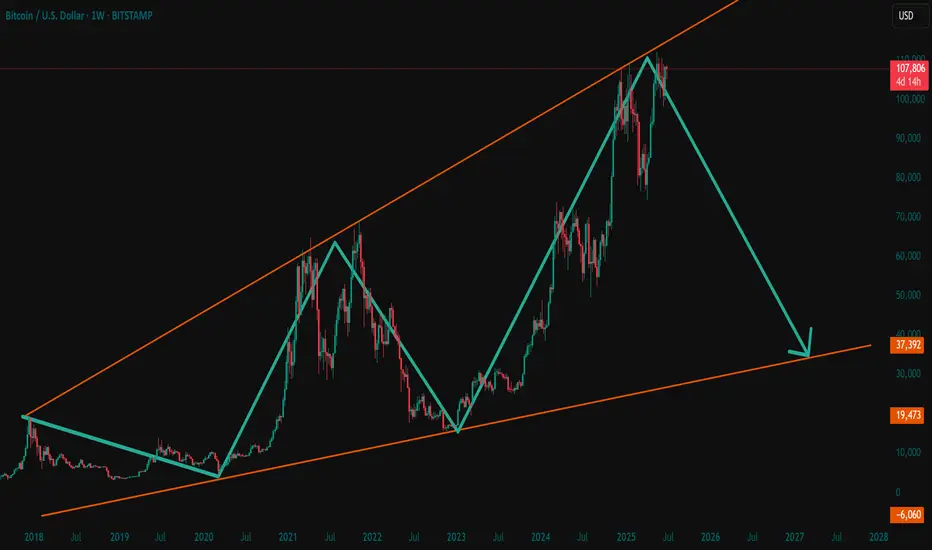
Bitcoin Faces Impending Drop to Mid-30,000sAs of July 02, 2025, Bitcoin’s price chart, crafted by "RoadToAMillionClub" on TradingView, paints a concerning picture. Currently hovering at $107,831, the cryptocurrency appears to be teetering at the edge of its upper channel, signaling potential trouble ahead. The recent 0.51% dip may be just the beginning of a more significant decline.
The long-term upward trend, marked by a supportive orange line since 2018, has been a beacon for bulls. However, the green trend line projecting a drop toward the mid-30,000s range, around $37,932, suggests a looming correction. This level, a historical support zone, could become the next battleground as selling pressure mounts.
Market indicators point to overextension, with the price hitting a 4-day and 14-day high of $107,831 before the recent pullback. The speculative fervor that drove Bitcoin to these heights seems to be waning, increasing the likelihood of a bearish turn. Investors should brace for volatility, as the cryptocurrency may struggle to maintain its current altitude, potentially sliding toward the mid-30,000s in the coming months.
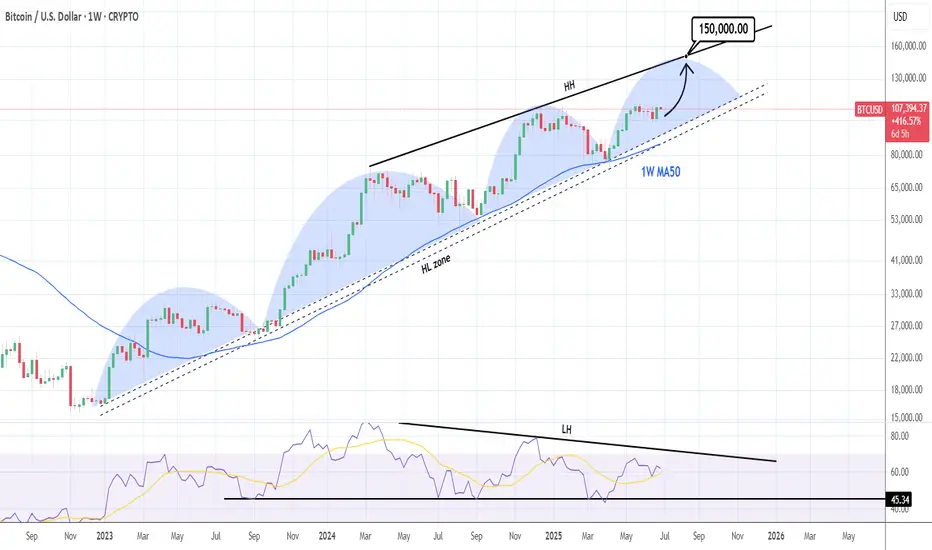
BTCUSD: $150,000 on a repetitive pattern.Bitcoin is neutral on its 1D technical outlook (RSI = 54.823, MACD = 486.400, ADX = 23.402) possibly going through the last consolidation before the next breakout to a new ATH. The whole 2023-2025 Bull Cycle has been on a repetitive pattern, bottoming on the HL Zone and peaking on the HH trendline, while forming clear wave structures. According to this, the next HH should be around 150,000 (TP).
## If you like our free content follow our profile to get more daily ideas. ##
## Comments and likes are greatly appreciated. ##
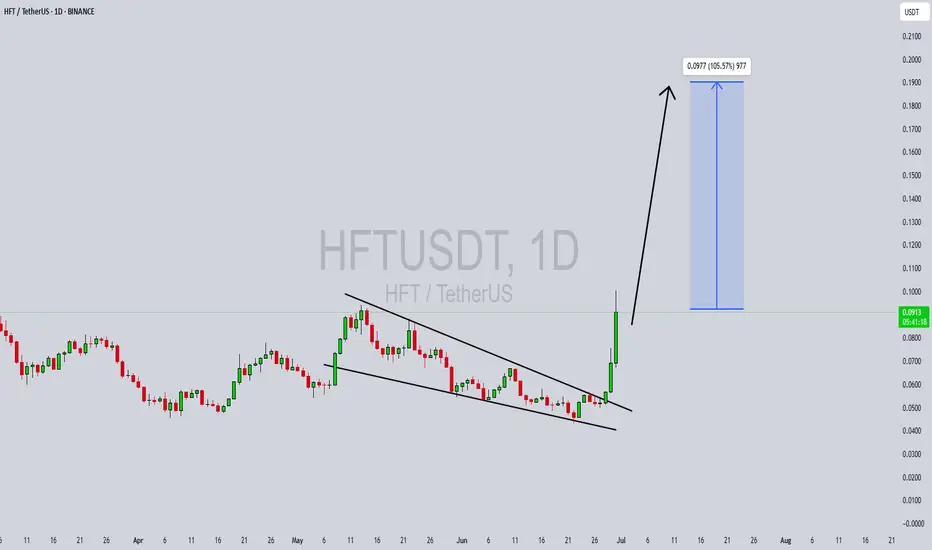
HFTUSDT Forming Falling WedgeHFTUSDT is currently displaying a textbook Falling Wedge Pattern, a classic signal that often points to an upcoming bullish reversal. This pattern is one of the most reliable in technical analysis, as it indicates that sellers are gradually losing momentum and buyers could soon step in to push prices higher. With good volume backing up this setup, traders are growing more confident that a breakout is on the horizon, which could fuel a strong upward rally.
The potential gain for HFTUSDT based on this pattern is estimated between 90% to 100%+, making it an attractive opportunity for swing traders and investors looking for high-risk, high-reward plays. The steady uptick in volume suggests that smart money is already accumulating positions before the anticipated breakout. When combined with the bullish pattern, this sets the stage for a price surge once the resistance line of the wedge is convincingly broken.
This setup comes at a time when the crypto market sentiment is gradually improving, with traders seeking altcoins that can outperform in the next bullish wave. HFTUSDT’s clear technical structure and growing investor interest place it among the top coins to watch closely. A confirmed breakout with strong daily closes above the wedge resistance could open the door to quick gains, rewarding early entrants who position themselves strategically.
It’s always wise to monitor volume and price action carefully when trading a Falling Wedge Pattern like this. Waiting for a confirmed breakout with increased volume can help reduce the risk of false signals and maximize profit potential. Keep HFTUSDT on your radar if you’re aiming to catch a move with solid technical backing and high potential upside.
✅ Show your support by hitting the like button and
✅ Leaving a comment below! (What is You opinion about this Coin)
Your feedback and engagement keep me inspired to share more insightful market analysis with you!
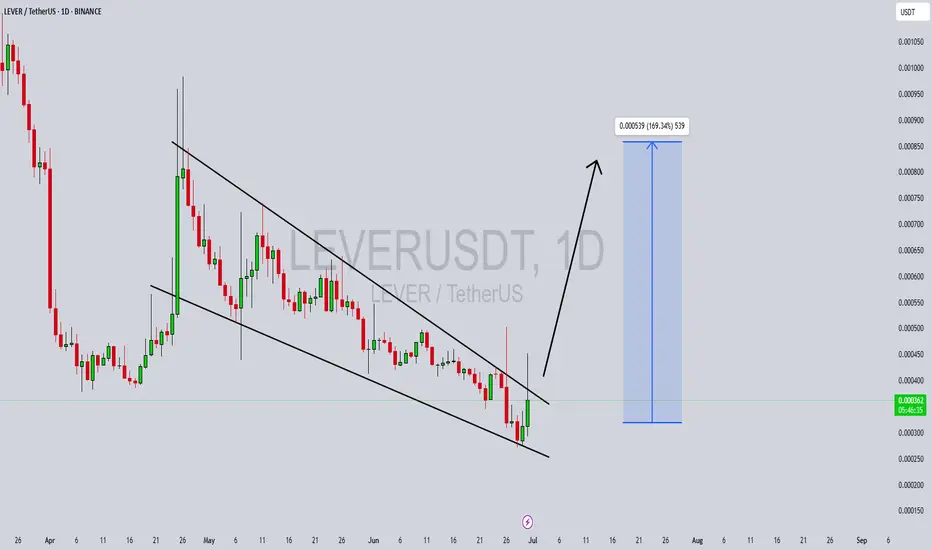
LEVERUSDT Forming Falling WedgeLEVERUSDT is showing a highly promising setup that’s generating buzz among traders and investors alike. The crypto pair is forming a classic Falling Wedge Pattern, which is widely recognized as a bullish reversal signal in technical analysis. This pattern often indicates that selling pressure is weakening and a breakout to the upside could be imminent. With volume picking up steadily, there is growing optimism that LEVERUSDT could deliver a significant price surge once it confirms a clean breakout above the wedge’s resistance line.
Many traders are particularly excited about LEVERUSDT because the expected gain for this setup is an impressive 160% to 170%+. This projection, combined with the clear technical pattern and rising investor interest, suggests that LEVERUSDT may soon become one of the standout performers in the altcoin market. The recent accumulation phase, reflected in steady volume inflows, hints that savvy traders are positioning themselves early ahead of a larger move.
Another important factor supporting this bullish outlook is the broader sentiment in the crypto market. As traders look for undervalued opportunities with high breakout potential, coins like LEVERUSDT that show strong bullish patterns and healthy trading activity become attractive bets. If the breakout confirms on the daily or 4H timeframe with sustained volume, it could trigger momentum-driven buying and push prices towards the projected targets.
For traders looking to diversify their crypto portfolio with high-potential setups, keeping a close watch on LEVERUSDT is definitely worthwhile. Remember to wait for a clear breakout confirmation before entering and manage your risk accordingly to make the most of this potential reversal.
✅ Show your support by hitting the like button and
✅ Leaving a comment below! (What is You opinion about this Coin)
Your feedback and engagement keep me inspired to share more insightful market analysis with you!
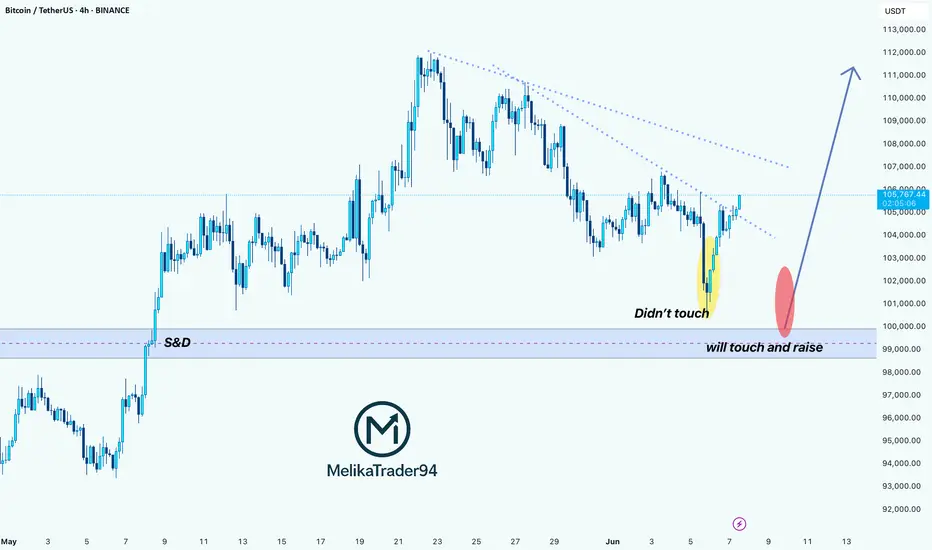
BTC Is Replaying a Bullish Fractal >>> Are You Watching?Hello guys!
I see a deja vu here! Let’s look at the historical daily chart (Jan–May 2025):
What happened?
Initial Drop (Yellow Oval): Bitcoin approached a key S&D zone but didn't touch it, triggering a short-lived bounce before dropping again.
Second Drop (Red Ovals): This time, price precisely touched the demand zone, triggering a clean bullish reversal.
What followed was a strong trend breakout, sustained higher lows, and an eventual surge past prior resistance levels.
Current 4H Chart Setup: A Mirror Image?
Yellow Highlight: Once again, we saw a bounce that didn't quite touch the key demand zone ($98K–$100K).
Red Zone Prediction: If this mirrors the historical move, the price is likely to return and touch this S&D area before launching a bullish leg.
Blue Path Projection: A sharp reversal is expected post-touch, aiming toward $111K–$113K as the next key resistance zone.
The descending trendline adds confluence
___________________
History Doesn’t Repeat, But It Often Rhymes
Based on this fractal analysis, Bitcoin is likely forming the same bullish base seen earlier in 2025. The setup hinges on one key event: a return to the $99K–$100K zone, where demand is likely to step in aggressively.
If the pattern repeats, the current market may offer one last high-reward long opportunity before a parabolic rally.
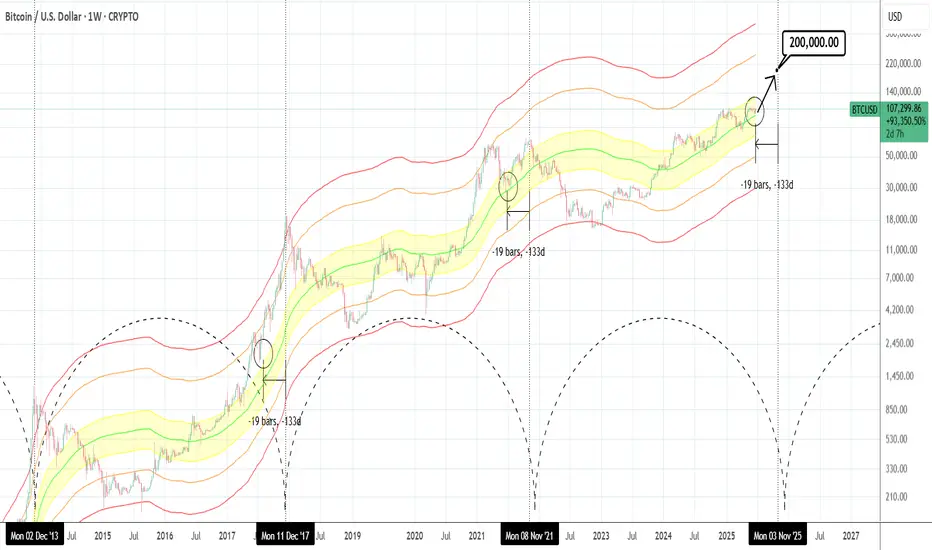
BTCUSD: Hasn't gone parabolic yet.Bitcoin is just now re-entering the bullish state on its 1D technical outlook (RSI = 55.820, MACD = 291.960, ADX = 15.180), being correcting/consolidating in the past 30 days. According to the Mayer Multiple Bands, it's stil inside the range (upper band) of the 1 Stdev Below-Mean-1 Stdev Above (yellow range). This suggest significant upside potential as being roughly 19 weeks before the Cycle tops, it matches the late June 2021 bottom inside that zone as well as the July 2017 bottom just over the top of that zone. The orange trendline has been the minimum target on every Cycle but looks unlikely to hit it by the end of the year. If however it goes parabolic as all Cycles had at this stage, $200,000 isn't at all far fetched before the Cycle tops.
## If you like our free content follow our profile to get more daily ideas. ##
## Comments and likes are greatly appreciated. ##
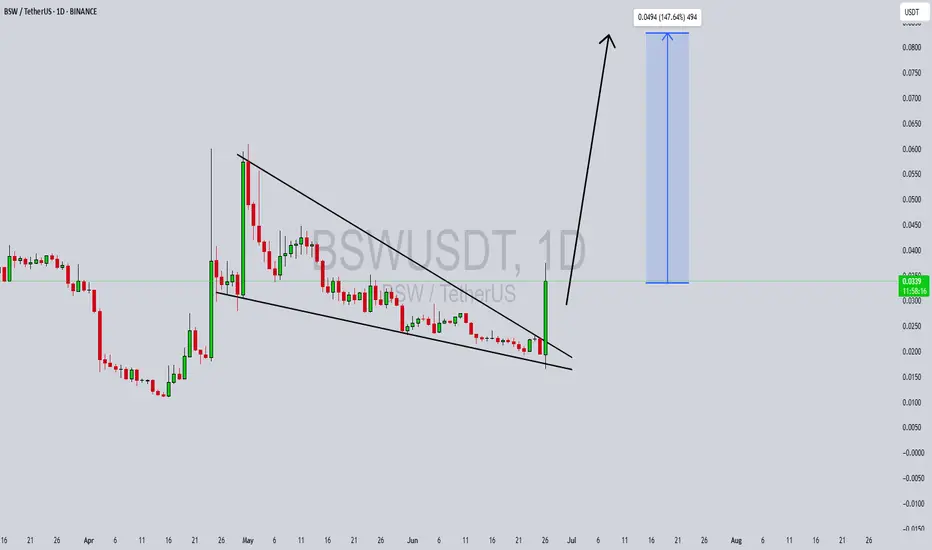
BSWUSDT Forming Falling WedgeBSWUSDT is currently showcasing a classic falling wedge pattern, a bullish reversal signal often associated with a sharp move to the upside once the pattern resolves. This technical structure forms when price action consolidates with lower highs and lower lows, while volume typically decreases — setting the stage for a breakout. In BSWUSDT’s case, the falling wedge has matured, and bullish interest is beginning to surface with improving volume levels, suggesting that accumulation is underway.
The technical breakout from this pattern could unlock strong upside potential, and current projections indicate a possible 90% to 100% gain in the coming sessions. This aligns well with historical performance of similar wedge formations in the crypto market, where the price often surges after breaking the upper resistance trendline. Traders are closely monitoring key resistance zones for confirmation and volume spikes that can validate the trend shift.
Investor sentiment toward the (BSW) ecosystem is growing steadily due to its utility in DeFi services and low trading fees. The increase in volume also indicates that smart money could be positioning ahead of a major move. Coupled with market-wide bullishness, BSWUSDT may soon experience a strong rally, driven by both technical and fundamental catalysts.
This setup offers a high-reward opportunity for swing traders and technical analysts who are focused on breakout trades and pattern-based strategies. The falling wedge combined with rising investor engagement makes BSWUSDT a potential breakout star to watch closely.
✅ Show your support by hitting the like button and
✅ Leaving a comment below! (What is You opinion about this Coin)
Your feedback and engagement keep me inspired to share more insightful market analysis with you!
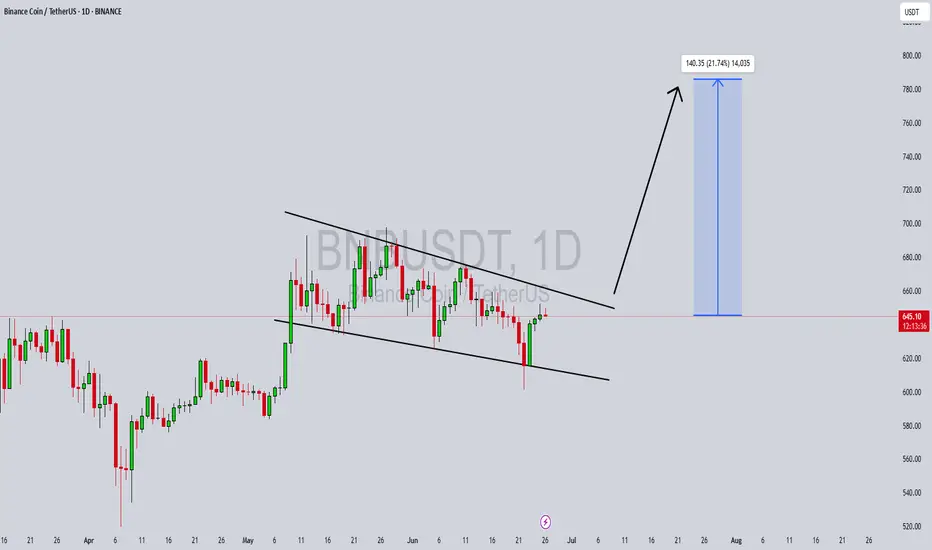
BNBUSDT Forming Bullish Wave BNBUSDT is forming a promising bullish wave pattern that suggests a potential continuation of the upward trend in the short to mid-term. The structure is supported by consistent volume, indicating strong participation and interest from traders and investors. The price action reflects healthy higher lows and higher highs, which typically signal growing bullish momentum. Given the current setup, we can expect a conservative gain of around 10% to 20%+ as the price targets upper resistance zones.
Binance Coin (BNB), being one of the top-tier cryptocurrencies with strong utility across the Binance ecosystem, often benefits from broader market recoveries and exchange-driven demand. With overall crypto sentiment showing resilience, BNB is well-positioned to attract further inflows. The bullish wave pattern being observed could serve as a foundation for the next impulsive move upward, especially if volume continues to support the breakout structure.
The project continues to demonstrate its dominance in both fundamental and technical metrics. As market confidence in leading assets returns, BNB’s role as a utility token and its deflationary mechanisms make it particularly attractive. Technical traders will be watching for a breakout above recent highs to confirm trend continuation, ideally backed by a surge in volume and RSI strength.
BNBUSDT remains a strong candidate for traders looking for stability with upside potential. The confluence of bullish wave formation, increasing interest, and fundamental strength positions it well for a steady rise in price in the coming days or weeks.
✅ Show your support by hitting the like button and
✅ Leaving a comment below! (What is You opinion about this Coin)
Your feedback and engagement keep me inspired to share more insightful market analysis with you!
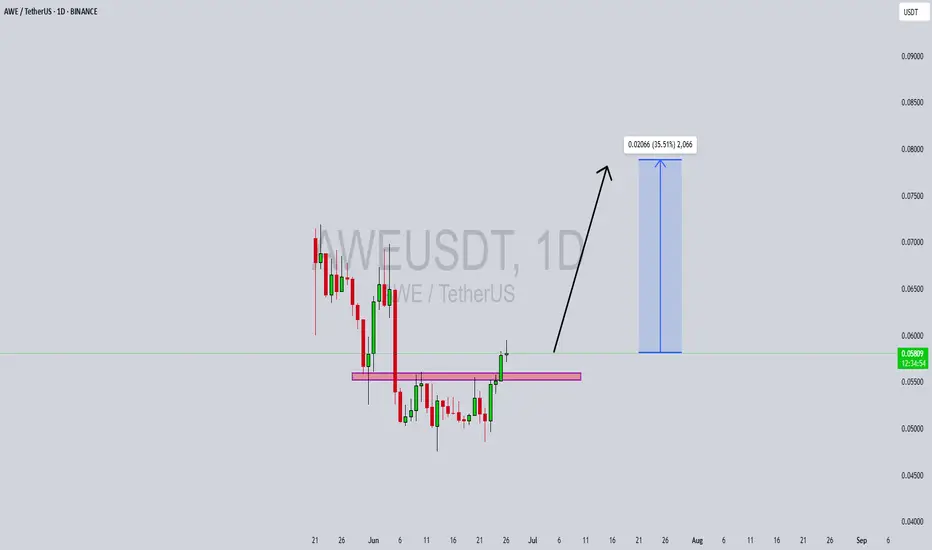
AWEUSDT Forming Bullish WaveAWEUSDT is showing early signs of a bullish wave pattern formation, with price action beginning to reflect strength after a period of consolidation. The emergence of this pattern is a classic indication of market participants preparing for a continuation move to the upside. With healthy volume accompanying this recent uptick, the current structure supports the probability of a short- to mid-term bullish breakout.
The expected price appreciation ranges between 20% to 30%, making AWEUSDT an appealing watchlist candidate for swing traders and short-term investors. The increasing interest around this project, both technically and fundamentally, indicates accumulating pressure beneath resistance levels. The pattern's wave formation suggests that we could be in the early stages of a broader upward movement if market sentiment remains positive.
AWE is gaining traction in the community as more investors look for innovative utility-driven tokens in a saturated altcoin landscape. With renewed focus on promising low-cap tokens, AWE is positioning itself to potentially benefit from upcoming bullish momentum. Traders are watching this setup closely, with the technicals aligning with growing social buzz and investor curiosity.
Given the strengthening price structure, volume confirmation, and bullish wave potential, AWEUSDT could offer an attractive risk-reward setup. Maintaining support above recent lows and continuing to push higher with solid volume will be key signals of further upside confirmation in this pattern.
✅ Show your support by hitting the like button and
✅ Leaving a comment below! (What is You opinion about this Coin)
Your feedback and engagement keep me inspired to share more insightful market analysis with you!
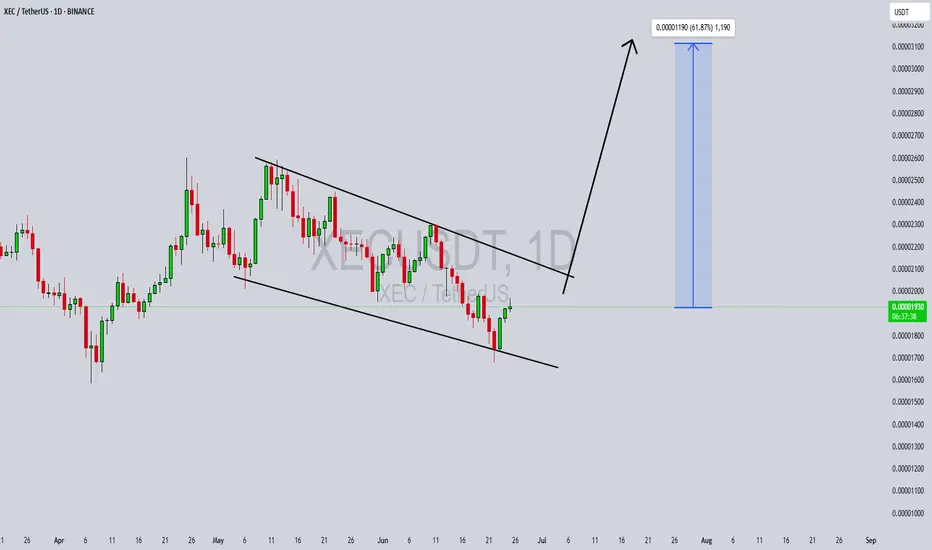
XECUSDT Forming Bullish WaveXECUSDT is displaying a strong bullish wave pattern, suggesting a potential continuation of its current uptrend. The structure reflects a healthy impulse wave formation, often indicative of early stages in a major bullish cycle. Price action has consistently respected key support zones while printing higher highs and higher lows—a classic sign of market strength. With volume backing this movement, investor sentiment appears increasingly positive as XEC begins gaining traction among altcoin watchers.
Technically, the asset has broken out from its consolidation phase and now targets the next resistance zones that could unlock a 50% to 60% price increase. This wave pattern is particularly compelling for swing traders and position traders, as the setup offers clear entry points and a strong risk-to-reward ratio. Volume surges during bullish candles confirm the accumulation phase is over, and momentum is building for a sustained leg up.
Fundamentally, XEC (eCash) continues to strengthen its ecosystem, focusing on fast, low-fee payments that appeal to real-world adoption. Its consistent development updates and community support are bringing more visibility to the project. As blockchain adoption grows globally, eCash's utility as a digital currency is becoming more relevant—attracting both retail and institutional interest.
This is a critical moment for XECUSDT, and traders watching this bullish wave structure could be early in capturing significant upside potential. If momentum continues and broader crypto sentiment remains favorable, the 50% to 60% target range appears well within reach in the near term.
✅ Show your support by hitting the like button and
✅ Leaving a comment below! (What is You opinion about this Coin)
Your feedback and engagement keep me inspired to share more insightful market analysis with you!
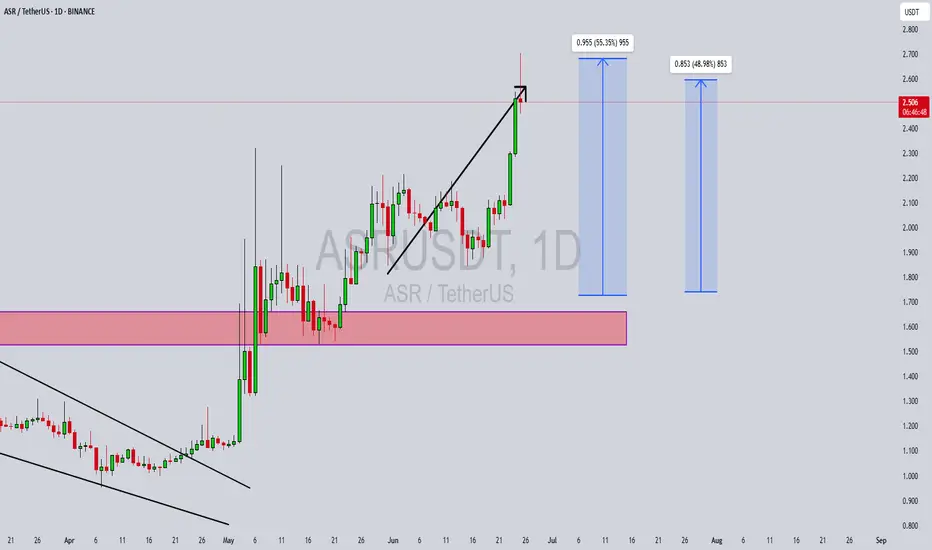
ASRUSDT Forming Strong Bullish BreakoutASRUSDT has recently delivered a strong bullish breakout, continuing its upward momentum with an impressive surge above the critical resistance level. The price has maintained a steady climb, forming a sharp ascending structure supported by solid volume—an indication of growing investor confidence. Based on the technical projection, ASRUSDT is poised for a 50% to 55% potential gain, making it one of the more attractive setups in the altcoin market currently.
The breakout was preceded by a clear consolidation phase, and the price respected the support zone highlighted on the chart. Following the accumulation, the price action shifted aggressively to the upside, confirming bullish market structure. This technical behavior often precedes a continuation move, and the current price action suggests that bulls are in control, with room to run toward the $3.40–$3.50 region in the coming weeks.
ASR is benefiting from renewed attention in fan token ecosystems, where it has carved out a strong niche. The token is tied to fan engagement in sports through blockchain, and that fundamental use case continues to drive demand. As fan-based digital assets grow in adoption, ASR’s utility and visibility are expected to expand, further fueling its long-term upside potential.
With a robust structure, investor attention, and favorable market sentiment, ASRUSDT is setting up for a continuation to higher levels. Traders should look for minor retracements or consolidation for potential entries, as the overall trend remains bullish with volume confirmation.
✅ Show your support by hitting the like button and
✅ Leaving a comment below! (What is You opinion about this Coin)
Your feedback and engagement keep me inspired to share more insightful market analysis with you!
BITCOIN BULL TRAP!!!? IS THIS YOUR SHORT ENTRY TO $44k?I am explaining a potential Bitcoin’s leading diagonal formation, that is forming an UHTF wave 1, that if successfully formed can be a start of the crash towards 44k!

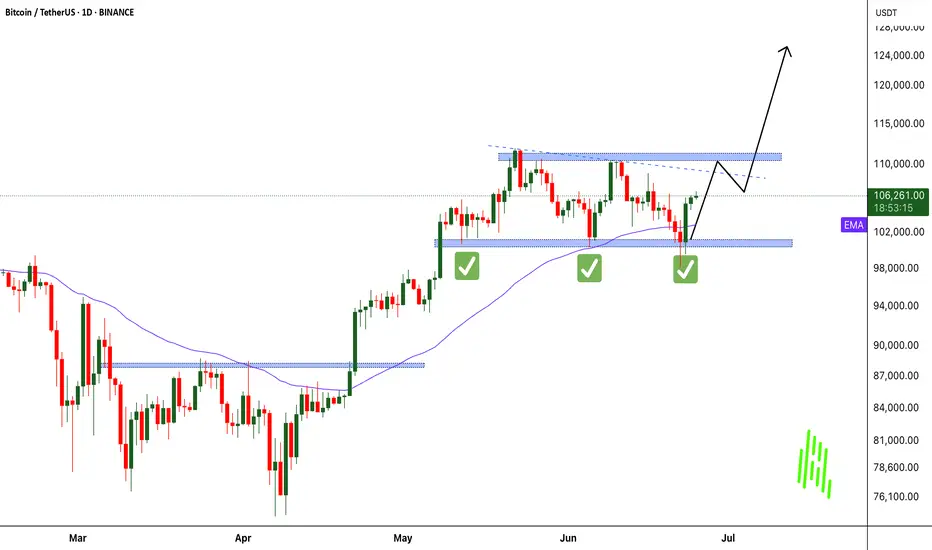
Bitcoin Reclaims Momentum: War Fears Fading, Bulls Eye $125K! MARKETSCOM:BITCOIN just delivered a powerful bounce right off the critical $100K level. A key psychological and technical support zone tested multiple times in recent sessions. This time, the bounce came with strong volume confirmation, signaling renewed buyer interest. As geopolitical tensions in the Middle East begin to ease, market confidence is returning, fueling bullish sentiment across the board.
CRYPTOCAP:BTC now looks poised to retest the $110K resistance zone, where some short-term rejection could occur. However, a decisive breakout above $110K opens the gates for a potential rally toward the next major target at $125K. Stay sharp, always manage your risk, and don’t forget to set a proper stop loss. The trend is strong, and momentum is building!
Follow Our Tradingview Account for More Technical Analysis Updates, | Like, Share and Comment Your thoughts
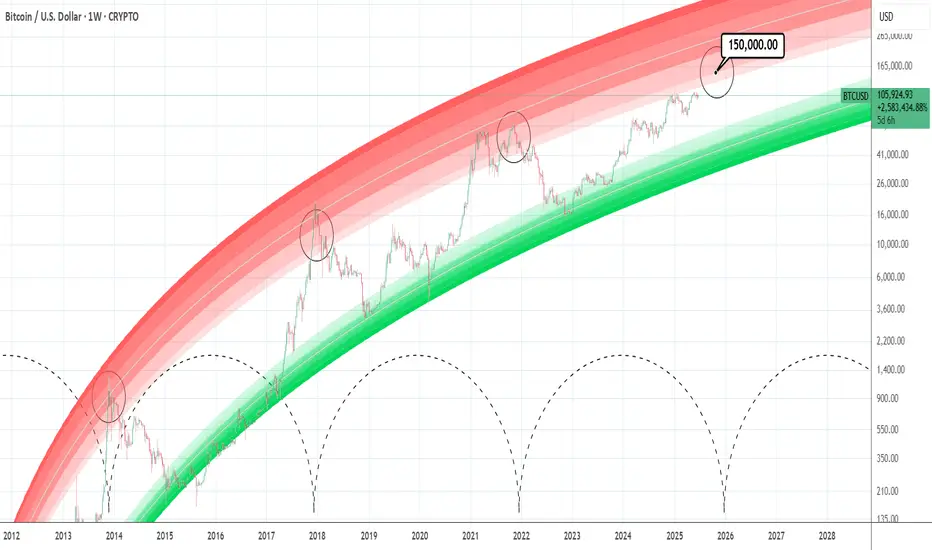
BTCUSD: Minimum target for this Cycle is 150,000Bitcoin turned neutral again on its 1D technical outlook (RSI = 52.882, MACD = -410.600, ADX = 22.509) as it recovered the losses of the last 2 days thanks to the Truce announcement between Israel and Iran. The long term picture couldn't be more bullish however as it hasn't even hit the bottom red zone of the Logarithmic Growth Curves model. According to the Time Cycles that mark each Cycle High, the Top for this Cycle is estimated to be between October and December. By October 2025, the top of the first profit taking zone (lightest pink) would be $150,000. That is technically the bare minimum of Top that should be expected based on the current LGC model. Technically it can even hit $200,000 but fundamentals have to help a lot in this scenario (adoption, ETFs, rate cuts).
## If you like our free content follow our profile to get more daily ideas. ##
## Comments and likes are greatly appreciated. ##
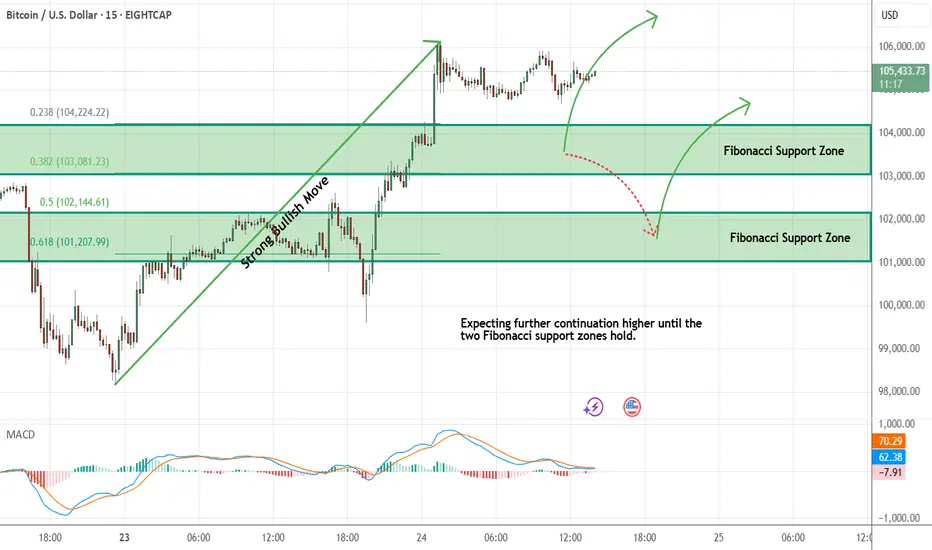
Bitcoin - Looking To Buy Pullbacks In The Short TermM15 - Strong bullish move.
No opposite signs.
Currently it looks like a pullback is happening.
Expecting further continuation higher until the two Fibonacci support zones hold.
If you enjoy this idea, don’t forget to LIKE 👍, FOLLOW ✅, SHARE 🙌, and COMMENT ✍! Drop your thoughts and charts below to keep the discussion going. Your support helps keep this content free and reach more people! 🚀
--------------------------------------------------------------------------------------------------------------------
Bitcoin Crash Will Continue to Levels that will REKT majority!??MARKETSCOM:BITCOIN crashed towards $98k so far! Almost 10% drop so far! Crypto noobs and mass media manipulators will blame this CRYPTOCAP:BTC crash on the Iran and Israel conflict! Professional traders will, however, tell you that this was orchestrated and the crash was already planned beforehand, and the best traders caught the crash from the top at $109k and made a profit on this Bitcoin correction! Professional insider trading against news manipulation, artificial conflicts, and emotional trading !

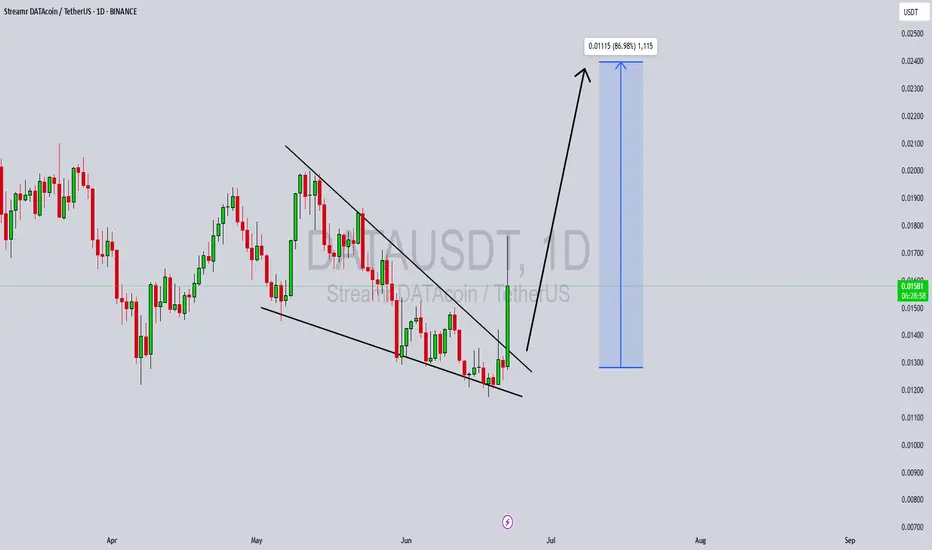
DATAUSDT Forming Bullish WedgeDATAUSDT is currently forming a bullish falling wedge pattern, a classic technical setup that often precedes a significant price breakout. After a sustained downtrend, the price appears to be consolidating within the wedge boundaries, tightening as it moves closer to a potential breakout point. This kind of structure typically indicates a loss of bearish momentum and growing accumulation, especially when supported by rising volume as seen here. Traders familiar with technical analysis recognize this as a signal of a possible reversal to the upside.
The volume profile for DATAUSDT is showing healthy growth, which adds conviction to the bullish case. Increased investor participation during the late stage of the wedge pattern reflects growing interest and potential for a strong upward push. Once price breaks above the upper resistance line of the wedge, we could see an explosive rally with a projected gain of 70% to 80%+ from the current levels. The measured move target aligns well with previous resistance zones, making this setup technically and psychologically significant for swing traders and investors alike.
Momentum indicators across various timeframes are also aligning in favor of a bullish move. RSI and MACD are showing early signs of positive divergence, hinting at a buildup of buying pressure. As the crypto market starts to regain broader strength, coins like DATAUSDT—still in early stages of breakout—tend to offer better risk-to-reward ratios. This makes it an ideal candidate for traders watching for breakout retests and continuation patterns.
Given the current technical setup and the renewed attention this project is attracting, DATAUSDT has strong potential to lead the next leg of altcoin momentum. Keep an eye on the breakout confirmation and volume spikes, as these will likely be key signals for the start of a bullish trend continuation.
✅ Show your support by hitting the like button and
✅ Leaving a comment below! (What is You opinion about this Coin)
Your feedback and engagement keep me inspired to share more insightful market analysis with you!
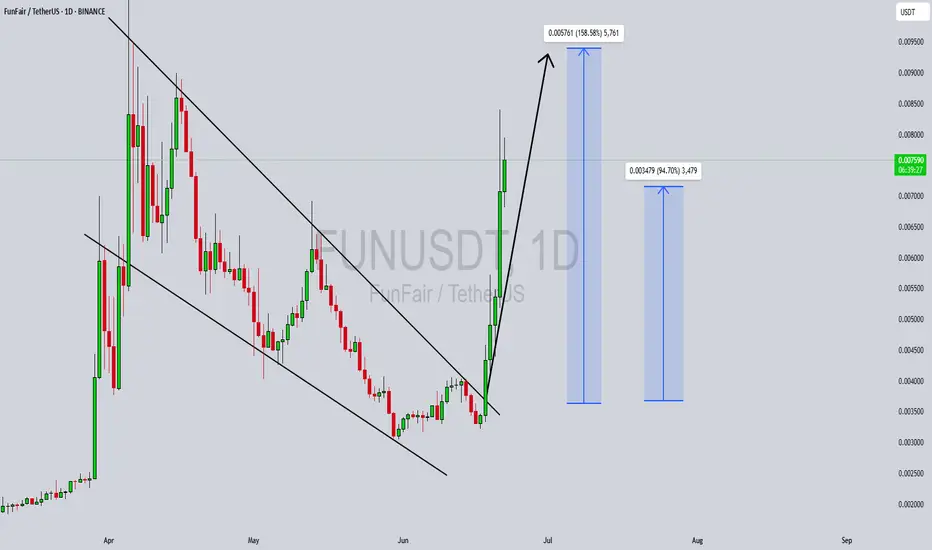
FUNUSDT Forming Classic Descending ChannelFUNUSDT has recently completed a significant breakout from a classic descending channel formation, which is a strong bullish reversal pattern. This breakout, fueled by a surge in volume and bullish sentiment, signals a shift in trend after an extended downtrend phase. The price action shows a clear escape from the consolidation zone, followed by strong green candles indicating aggressive buying pressure. Traders are now closely watching this pair for further continuation as momentum builds across the altcoin market.
With a projected gain of 70% to 80%, FUNUSDT stands out as a high-potential opportunity in the current crypto cycle. The breakout aligns with broader market recovery patterns and investor appetite for undervalued tokens. As technicals support this upward trajectory, many analysts believe this rally could extend beyond initial resistance levels, especially if volume remains consistent or grows further. The measured move targets align well with the height of the channel, giving confidence to those entering post-breakout.
Investors are clearly taking an interest in FUNUSDT, as reflected in the sharp upward movement and increased market activity. This shift suggests both short-term traders and longer-term holders are accumulating positions in anticipation of a larger market move. With momentum and structure now favoring bulls, FUNUSDT may continue to outperform similar-cap tokens in the weeks ahead.
For those following chart patterns and volume-based trading strategies, FUNUSDT is demonstrating a strong technical setup. The descending channel breakout, paired with fundamental optimism and liquidity inflow, could be the trigger for sustained upward movement.
✅ Show your support by hitting the like button and
✅ Leaving a comment below! (What is You opinion about this Coin)
Your feedback and engagement keep me inspired to share more insightful market analysis with you!