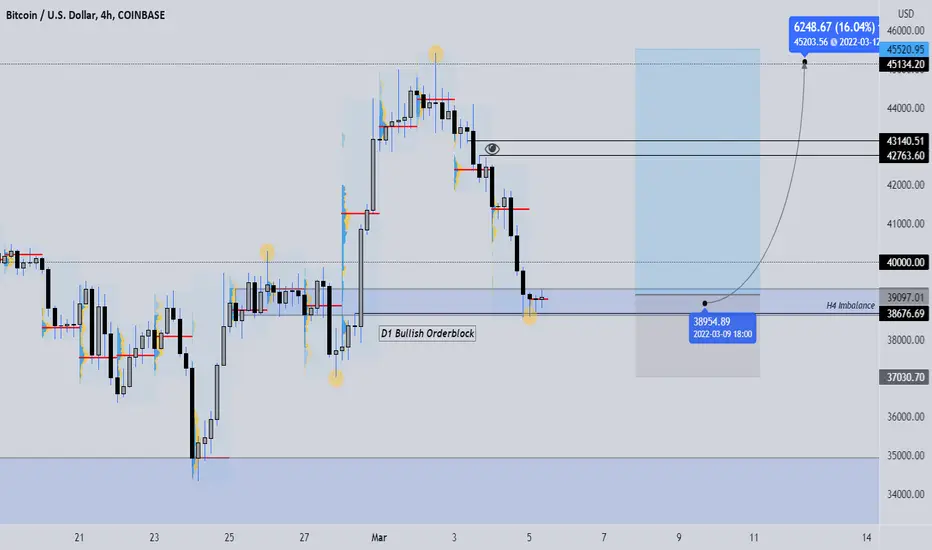
BITCOIN LONGS INTO 45000 📉📉📉📉 Expecting bullish price action on BTC as price is filling a huge h4 bullish imbalance, right now price is rejecting a D1 bullish orderblock area + 3 POC's on the Volume Profile meaning the price has a high probability that it will HOLD there.
Targets into bearish imbalance somewhere around 43.000 and institutional figure above 45.000
What do you think ?
Bitcointrading
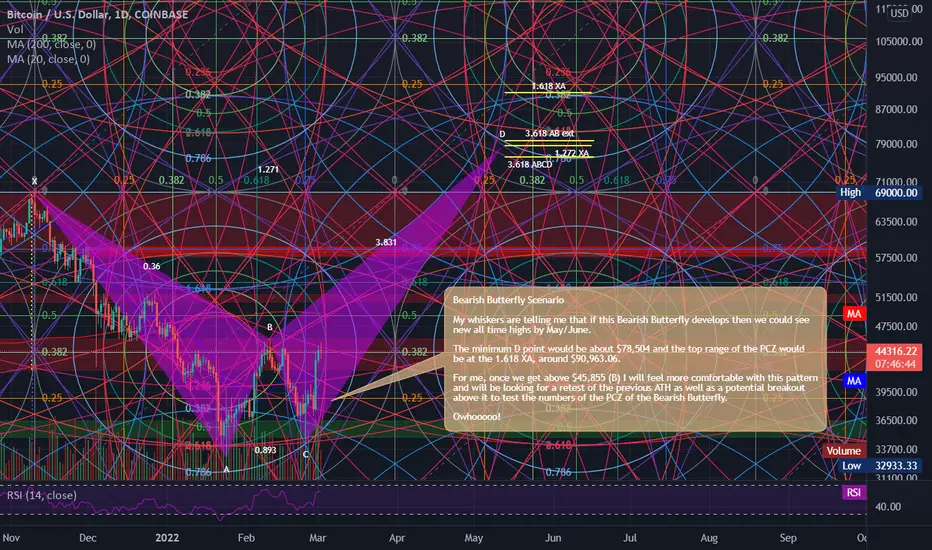
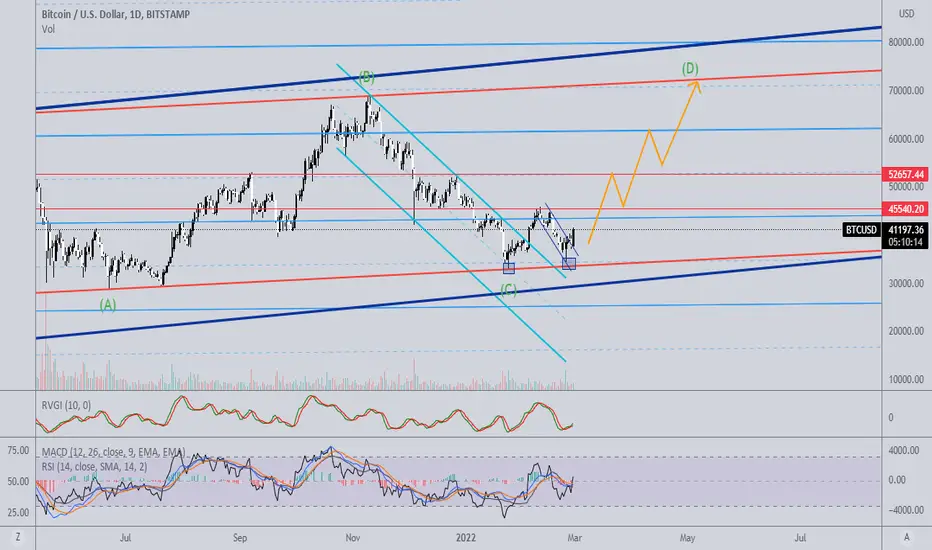
Bitcoin Bearish Butterfly ScenarioLooking at this daily chart it seems that Bitcoin could be forming a Bearish Butterfly harmonic.
My whiskers are telling me that if this Bearish Butterfly develops then we could see new all time highs by May/June.
The minimum D point would be about $78,504 and the top range of the PCZ would be at the 1.618 XA, around
$90,963.06.
For me, once we get above $45,855 (B) I will feel more comfortable with this pattern and be looking for a retest of the previous ATH and a potential breakout above it to test the numbers of the PCZ of the Bearish Butterfly.
What do you think?
Owhooooo!
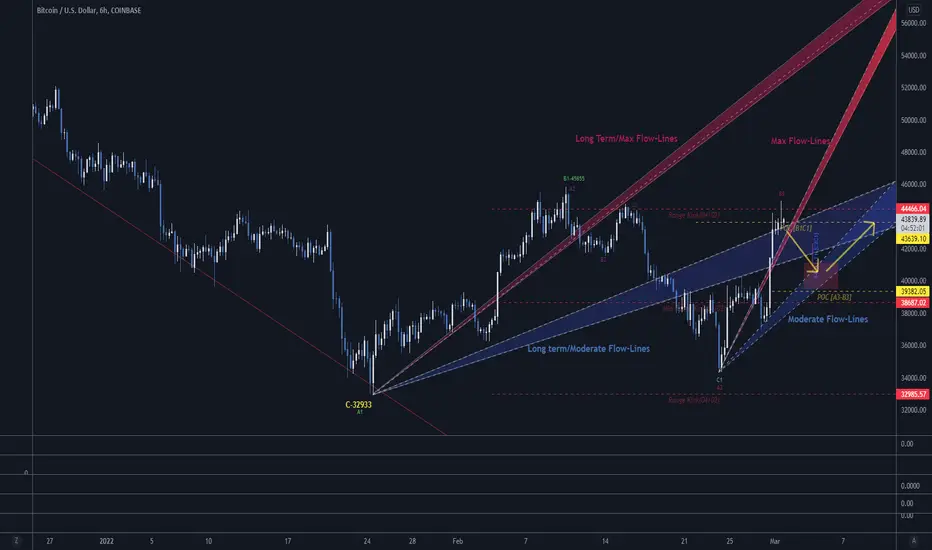
$43500 on March 10 Is Still Possible. We Are At The Crossroads !Hi,
We are at the crossroads.
The $41000 levels have not held. It becomes impossible to quickly regain the growing pace of the Red Max Flow-lines.
The bullish scenario is not dead.
=> As expected at the beginning of the week (see links below), We can still pursue a moderate rise by following the blue channels of the Moderate Flow-lines.
=> For this to happen, it is essential that the time-price matrix (red rectangle) holds. We are in the lower limit. The behavior of the weekend will be crucial to maintain the bullish scenario.
If the $39400 level does not hold, we will find the bottom of the range : $33000.
** It's an exciting time, what do you think ? **

Bitcoin - Important Levels :$41100-$41500 for The Next Rise...Hello,
We respected the forecast made at the beginning of the week.
The next important levels are those between $41170 and $41600.
This area needs to hold in order to resume a sustained rise with prices hovering around the red Max flow-lines during this early March.
(the slopes of these Flow-lines are calculated according to the mathematical principles of econophysics).
If we break these levels and explore the time-price matrix of the red rectangle, the pace of the rise could be reduced to the long-term and short-term channels of the blue Moderate Flow lines.
For the moment the time-price relationship is excellent.
To be continued...
Xavier
Bitcoin overbought pullback, possible bounce back ?Bitcoin got overbought after the last big pump to the upside, but as always it has to cool off and wait for the strenght of the support. I belive that we might find some support to the 41.5k $ zone which it was act as a previews supports and resistance price. In order to have a good bull run we need to brake the 46k $ range where we face the strongest resistance to the upside for now. We wait and we expect for the next price.
have a safe trading and always remember that Long term investments pay better!
@CryptoDrou
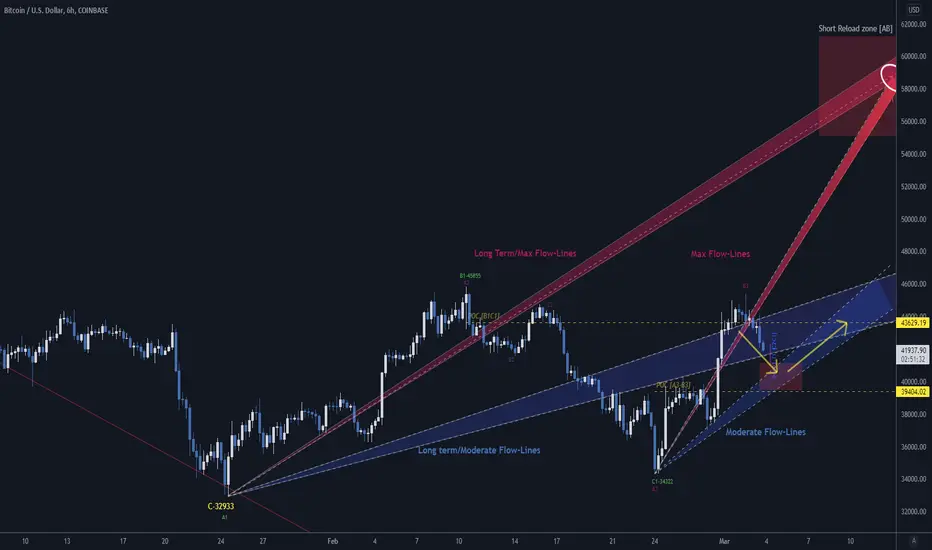
Short Term Bitcoin Prices => Time for a Healthy Break or Not ...
We are following the fastest flow-line (called Max flow-lines on the chart). If we cross the B1-$45855 point before the evening of March 4, we will maintain the maximum upward momentum that could bring prices to around $58,000 before March 15. There are still steps to take to validate this scenario!
For the moment let's see how prices will oscillate or deviate from this Max Flow-lines (the Price-Time slopes of these lines are calculated by Physicaleconomics concepts independent of the market geometry).
For the moment we are oscillating around the Long-term Moderate Flow-lines .
In the short term, we are at the top of the range (red dotted line), prices will have to work this level and after the rapid rise of the last few days, it is time for the markets to breathe in order to resume a sustainable rise in parallel with the hunt of the shorters.
In the short term this week, it is likely that we will see a correction between $39,400-$41,100 ( See red-box on the chart) at the end of the week before resume a bullish momentum to regain the Long-Term Moderate Flow-lines (in blue on the chart).
Xavier
bitcoinIt's like double bottom. there is a line(red line), it's a channel line and the price had 4 times reaction on that.
Decision timeAfter examining the bitcorn chart for quite a while today...
I came up with two great setups...
If you follow me, then you already know which one is more likely to happen imo ;)
Anyway guys, just be careful and dont forget to set some stops
BITCOIN UPDATE WATCH OUT FOR NEXT CANDLESBTC caught the longs & dumped, caught the shorts & pumped!
- Bounced off $37,157 support ✅
Acceptance above $39,750 resistance will take us to $40.7k - $41.5k resistance.

Short BTCUSDI believe this movement is on retracement phase that will lead to 37330.00 then bouncing up to 42000.00

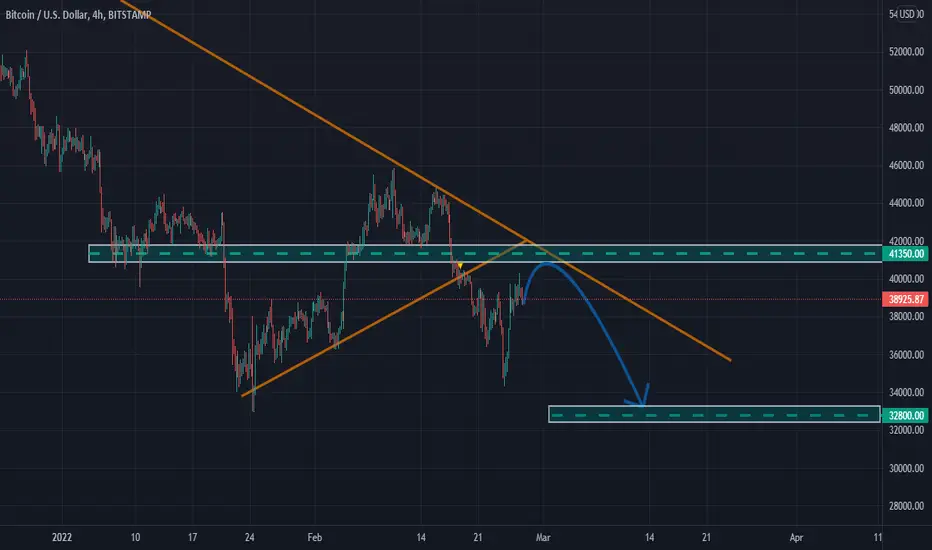
BITCOIN is near the resistance!Bitcoin Is Rising Now But It's Trading In An Overall Downtrend
We will soon see it retest the descending resistance line at 41350
From where I expect it will move down towards the 32800 areas
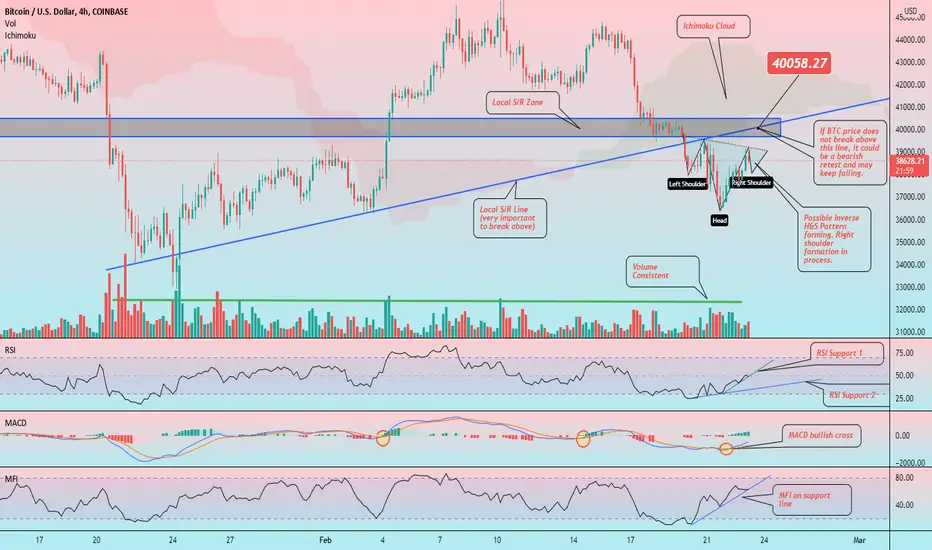
BTC Bitcoin: Short-Term Price ReviewHello friends, today you can review the technical analysis idea on a 4H linear scale chart for Bitcoin (BTCUSD).
The chart is self-explanatory. Price has the potential to get back in the $40K region before meeting with significant resistance with the Support and Resistance Trend Line zone, and Ichimoku Cloud. There may be an Inverse Head and Shoulders Pattern forming. Volume is consistent. RSI, and MFI are at support lines and MACD had a bullish cross.
Check out a few macro timeframe perspectives in the ideas below.
If you enjoy my ideas, feel free to like it and drop in a comment. I love reading your comments below.
Disclosure: This is just my opinion and not any type of financial advice. I enjoy charting and discussing technical analysis . Don't trade based on my advice. Do your own research! #cryptopickk
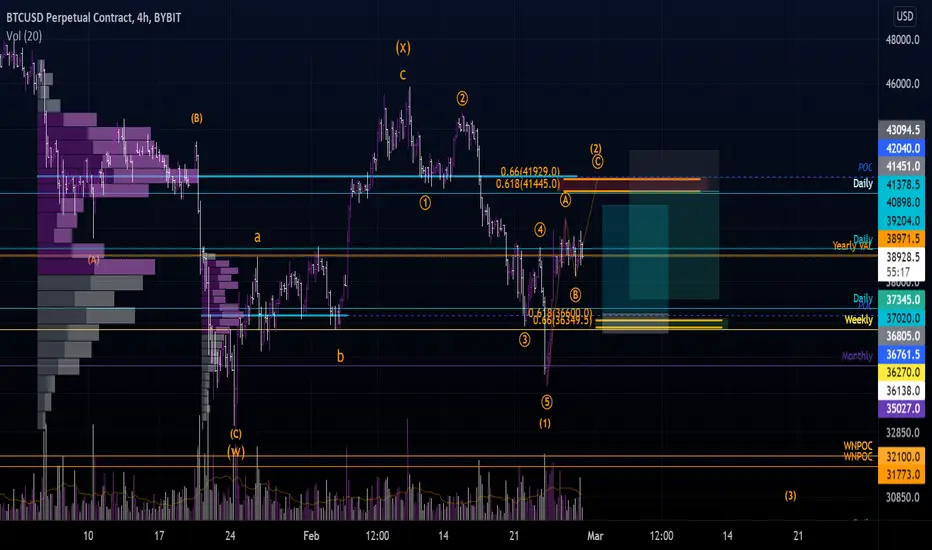
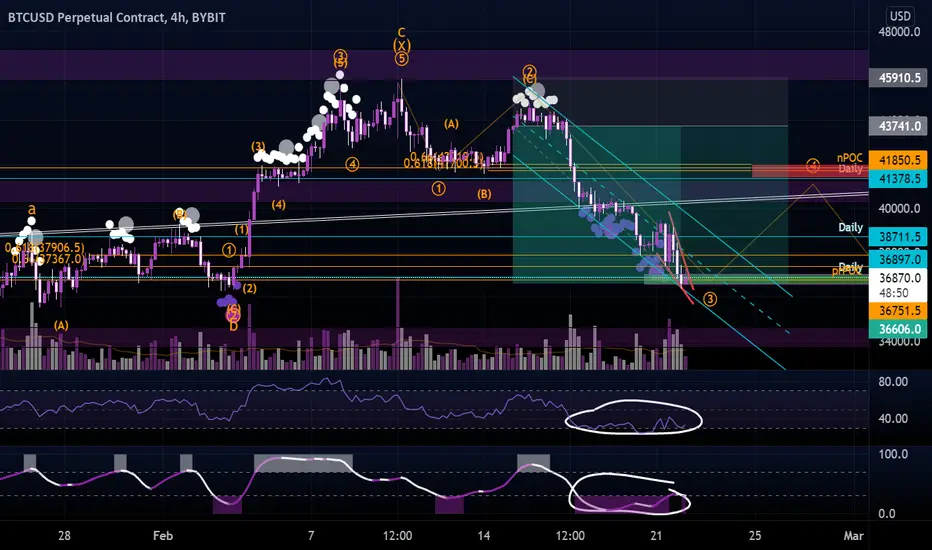
It was fun while it lasted - follow-upBut sadly, everything eventually comes to an end.
Incuding this trade :)
--The previous post got taken down, so this is a re-upload :)--
This was indeed the best trade I have ever taken. Thank you guys for following along with me <3.
We are brutally oversold on the 4h timeframe. Bears think they have won. Not quite yet though.
I expect BTC to find a local bottom from anywhere between 36,5 - 37k.
We will then do an ABC correction to around 41,5-42k.
Many people will switch bullish on this move. It might even look impulsive. Don't let yourself be fooled.
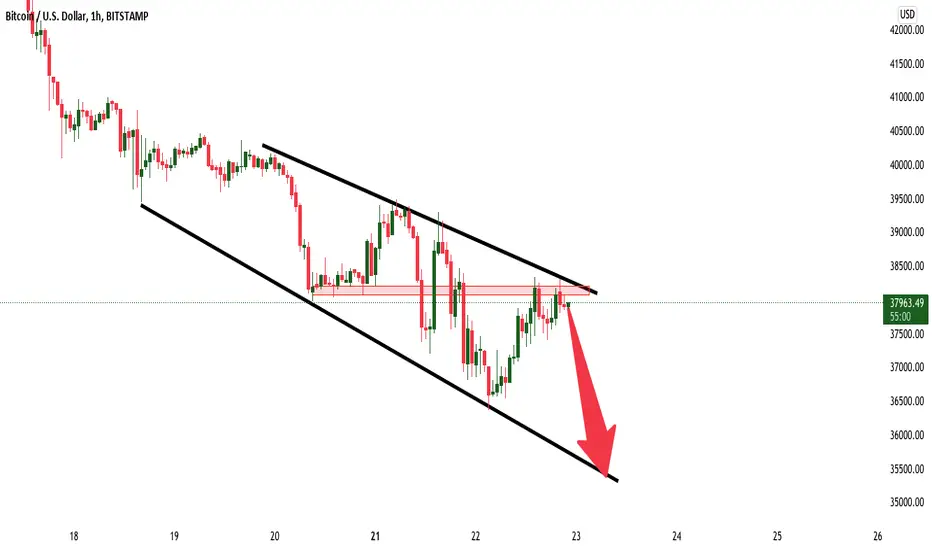
BTC Possible more downsidesHey traders, in today's trading session we are monitoring BTCUSDT for a selling opportunity around 38k zone, once we will receive any bearish confirmation the trade will be executed.
trade safe , Joe.
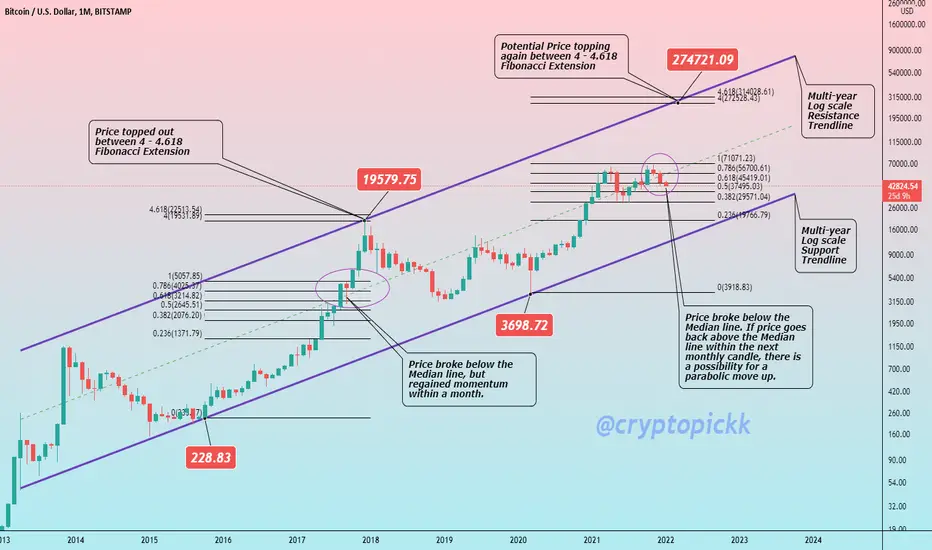
BTC Bitcoin: Monthly Log Chart UpdateHello friends, today you can review the technical analysis on the 1M (monthly) log scale chart for Bitcoin (BTCUSD), a cryptocurrency. When reviewing this chart, keep in mind it is on a macro perspective and not looking at the day to day chart.
The Bitcoin price has been in a Parallel Channel since early 2013 with the price being supported on the bottom and top trendlines. The Median Line of the Parallel Channel is extremely important as it has helped determine when a Bear Market has come for Bitcoin up until now. The current price range is at a critical level as it was in September 2017 when the price broke below the Median Line but regained momentum and within a few months it reached an all time high with a blow off top around $19K-$20K. Similarly if the current price can get back above the Median Line, there may be a potential for a Parabolic Run to the top of the channel at around $275K. The targets were determined using a Fibonacci Extension tool showing the price in 2017 reached the all time high between the 4-4.618 Fibonacci level. Assuming this may happen again, the 4-4.618 Fibonacci level is around $275K range. It may be higher or lower a bit but around that price. The chart and analysis is based on historical data trends and the price of Bitcoin does not need to follow that. It is extremely important to keep a close eye on the Median Line over the next few months.
What are your opinions on this?
If you enjoy my ideas, feel free to like it and drop in a comment. I love reading your comments below.
Disclosure: This is just my opinion and not any type of financial advice. I enjoy charting and discussing technical analysis. Don't trade based on my advice. Do your own research! #cryptopickk
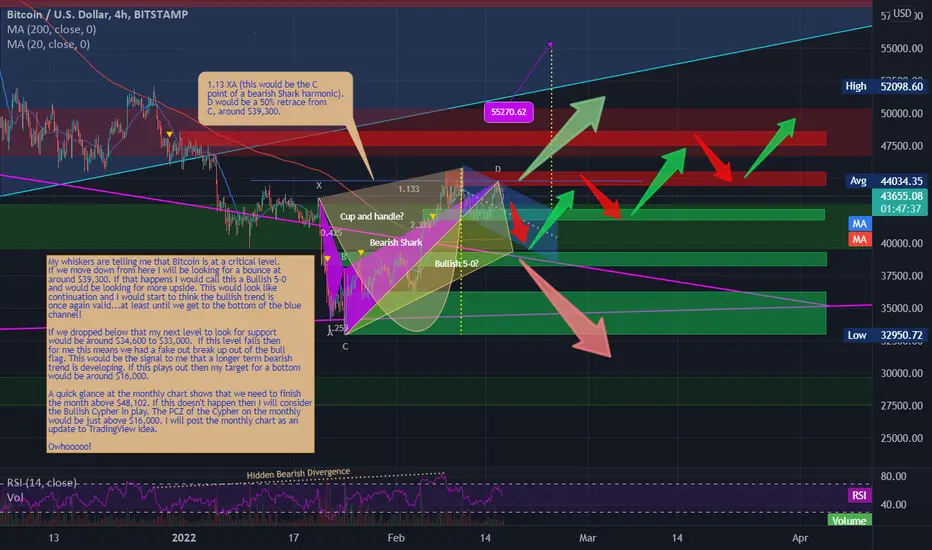
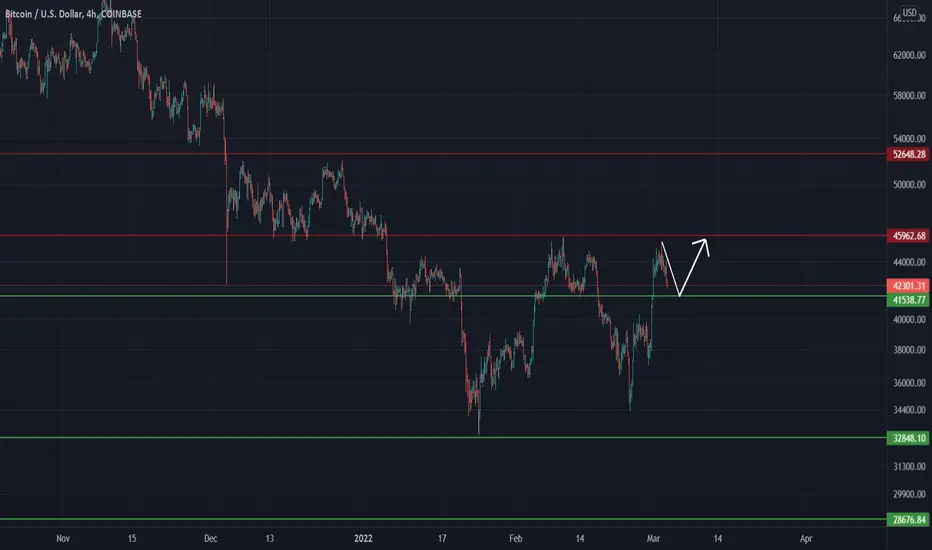
Bitcoin Do or Die?Looking at this 4HR chart it seems Bitcoin could be up to something!
My whiskers are telling me that Bitcoin is at a critical level.
If we move down from here I will be looking for a bounce at
around $39,300. If that happens I would call this a Bullish 5-0
and would be looking for more upside. This would look like
continuation and I would start to think the bullish trend is
once again valid...at least until we get to the bottom of the blue
channel!
If we dropped below that my next level to look for support
would be around $34,600 to $33,000. If this level fails then
for me this means we had a fake out break up out of the bull
flag. This would be the signal to me that a longer term bearish
trend is developing. If this plays out then my target for a bottom
would be around $16,000.
A quick glance at the monthly chart shows that we need to finish
the month above $48,102. If this doesn't happen then I will consider
the Bullish Cypher in play. The PCZ of the Cypher on the monthly
would be just above $16,000. I will post the monthly chart as an
update to TradingView idea.
Owhooooo!