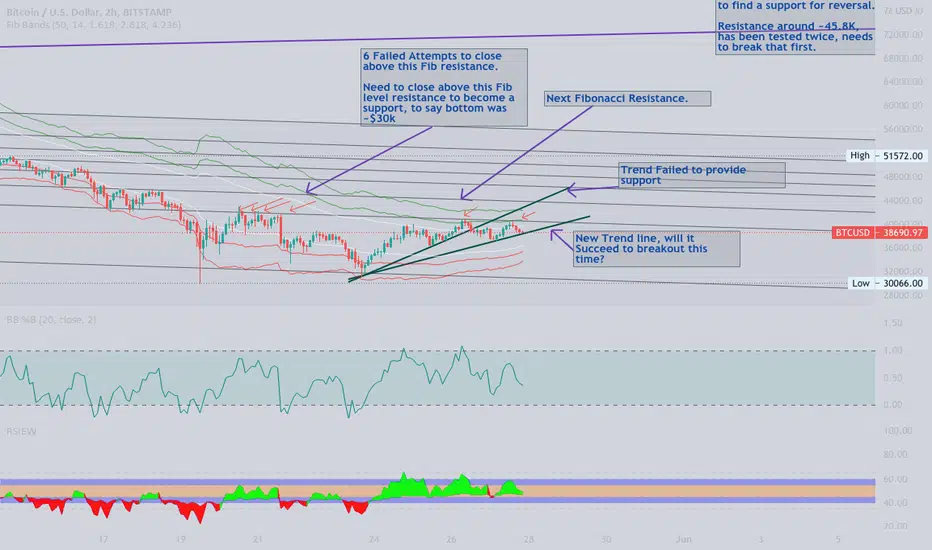
Bitcoin Daily shows us that a HUGE Hurdle has been crossed
The question I will answer in this post is "What is the significance of that Blue line that BTC PA is now sitting on"
On the Daily chart, we can see it has been tested as support and Held.
Previously, it was resistance..
So what ? This has happened many times before.
Lets zoom out and look at the weekly.
So, we see that the Blue line was also the rejection zone in 2021.
Infact, if you look, it has rejected BTC PA 5 times since March 2021 and we have finaly managed to get over it and seem to be comfortable using ot as support now.
This leaves the door open to move higher once PA is ready
But there is WAY MORE to this
Lets look at the monthly chart
So now we see that that same Blue Arc has also been rejecting BTC PA since 2011.
That is nearly the entire life span of Bitcoin and it is certainly the entire life span of its current Bullish momentum since we entered the current channel we are in..
So, in many way, this could be seen as a new beginning, a New cycle.
We do need to remain cautious for now though. As we can see, we did get over this line in 2013 but fell back below......and of course, the possibility for this to happen again exists BUT we now have massive Corporate investment. This could stop that fall.
PA needed to get over this line or fall.
Should this fail to hold for now, we will return to lower lines of support, around 70K- 80K but I would anticipate a massive buying spree should that happen.
The next few months in Bitcoin are absolutely CRUCIAL.
We need to remain above this Arc.
And as I have shown months ago, this Arc is not just a line drawn freehand.
It is actually calculated and is part of a Fibonacci Arc.
The Monthly chart also shows us we are near the ATH Zone on a time span shown under PA on this chart.
We may not see the steep rise we have previously...but the Major Victory is remaining ABOVE this Blue Arc
Fingers Crossed
Bitcointrendlines


Massive Crash Incoming On BTC -Watch This To Not Get TrappedBTC\1H Doing a pennant which is a sign of continuation
With yesterday move performing a SL hunt and start to performing a pennant there which shows us there might be more down side to come.but it could also invalidate it by going up and taking all the liquiditiy around 22900 to 23400.
Todays Events will totally spice things up even more than yesterday
Dxy rising to 105 and holding it is a sign of Market getting weaker
Please Boost,Follow,Comment if you find this informative
Details on the video

[Tutorial] Price Action And How Can We Use It To Make MoneyWelcome to this video on Bitcoin and price action Part 1 of 3. But what exactly is price action, and how can it help you make informed trading decisions?
Price action is a technique used by traders to analyze market movements based on the price and
volume of a security, without relying on technical indicators or other external factors.
In this video, we'll explore some of the most commonly used price action patterns in Bitcoin trading
, including support and resistance levels, trend lines, candlestick patterns, price action patterns, and moving averages.
We'll also discuss how to use these patterns in combination with other forms of analysis to make informed trading decisions,
and how to manage risk when trading Bitcoin.

Bitcoin Bullas wants to push it higher on Monthly Close!BTC/1H `at the bottom of rising broadening wedge Forming another pennant `
After Pumping into 23.9 yesterday btc gets rejected at a local support and starts to bleed and touches the bottom of the rising broadening wedge
The Rejection was heavier than the pump and price endedup consolidating near the bottom of the wedge indicating we might exit it again
Also today is **Monthly Close** if btc loses 23K and close below, depending on the momentum of the move we could consider it very bearish
Some liquidity Cluster to be taken at 24.6 which can cause bitcoin to legup again if it breaks above 24.7
Please Boost,Follow,Comment if you find it informative
Thanks for watching

Bitcoin pure price action analysisIn this chart you can see that first btc breaks triangle pattern than it takes support at 40k level which is major support so that if it breaks that you can see btc at all time low or if it brakes the side trend so that its possible that btc touch all time high

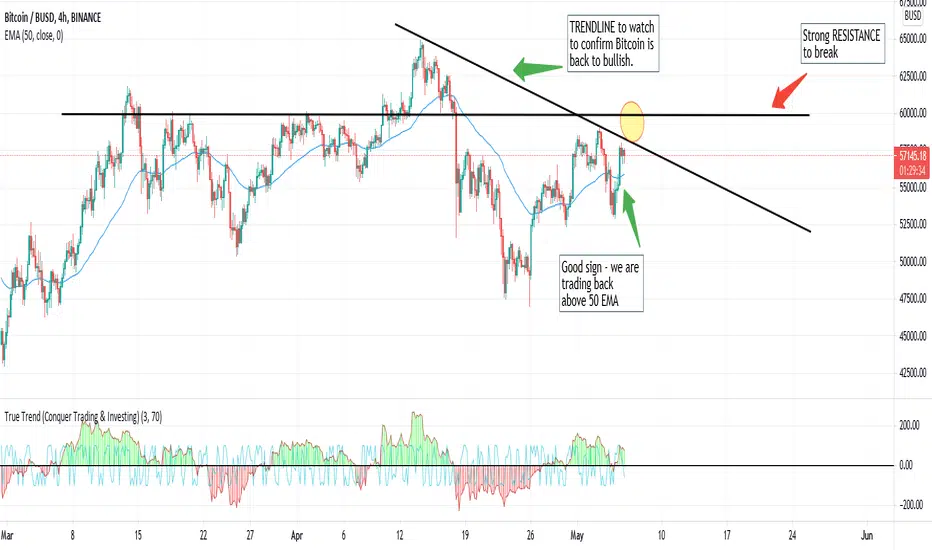
BTC /BUSDTrendline to keep an eye on to confirm we are back to the uptrend.
Also, the key resistance is still at psychological 60s.
I am not into any trades with BTC at the moment, especially not with leverage.
Just observing.
Bitcoin trend updateas I have marked on my idea if breach down 53k we gonna roll down to 52 but after that, it's 51 waiting for us. if you see my rectangle after one breakout, it gonna go down sharp but, there is no reason for it and as I imagine, bitcoin gonna range max one day between 53-55,5 until one good break that shows the future bitcoin days. there is no reason for a fall so I think it gonna range for some hours and after that gonna breach upwards forward to 57k and maybe sharp forward to 61,5 k. every number in this text is approximately number for a nearly exact number check my chart.
Bitcoin whats nextI just wanted to share my idea for BTCUSDT
This is just my personal opinion, I don't have any market background, this is just based on the facts i know about the market for now and what i see in the chart.
I'm doing this kind of charts for 2 weeks now, keep this in mind too.

PERFECT - BTC Target for 2/15/21 - GUARANTEED!Hello all,
I have spent the better part of 18 hours working on this chart. It seems that February 15, 2021 will be a great day for BTC HODLER's.

Bitcoin can catch us ?Hi there,
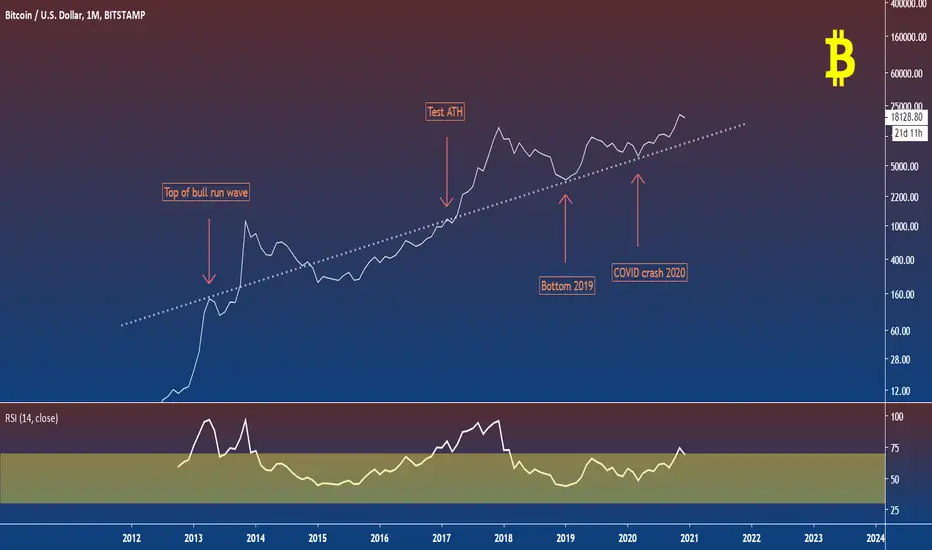
Another 1M log chart about bitcoin , to see the trend and know what could happen the next months.
Bitcoin can always catch us, but we can't deny that not only the chart seams bullish, the investors, FOMO peoples and the public opinion too (see my last chart and google trends).
In this chart I didn't show the price expectation, or the next ATH. I show the facts. Every last time that we touch the ATH, we are almost on a way to break it but a little confusing happens. We can have one or two months of hesitation, so if you have the profile of an investor stay strong.
Best regards,
Gaetan Lpp
BTCUSD What could happen ?Since the last months we broke all the resistances to top at a new ATH and now we got a lot of support behind us.
Nothing should stop Bitcoin with this market sentiment since the new high.
People start to talk more and more about bitcoin, hope, believe, dreams to be rich and it's exactly what makes a bubble / bull run.
One thing that you can't deny it's Google trend
trends.google.com
Keep your nuts,
ScratLpp
Mather of days before Bitcoin will be tapping 14K Exact same breakout will happen, funding shows aswell this is a good place to buy some more.
Also the consolidation in itself is very bullish, since profits of margin exchanges won't flow into fiat.

Bitcoin say hi to 12k - What's next?Bitcoin broke through resistance to past 12k then belted downward then back upward in a sign of pure selling and buying volume.
RSI is trending ok and all other indicators point to another big move happening in 7 to 14 days.
What is going to happen next - only the squeeze of resistance can tell what may happen!
What do you think 13k or back to 11K?
Risk Reminder:
1. Trading in digital assets comes with high risks due to huge price fluctuations. Users should be fully aware of the risks associated with digital asset trading and make prudent trading decisions.
2. Huobi Global’s announcements and information do not constitute investment advice, and Huobi will not bear responsibility or provide compensation for direct or indirect losses arising from trading decisions whilst relying on this information.

