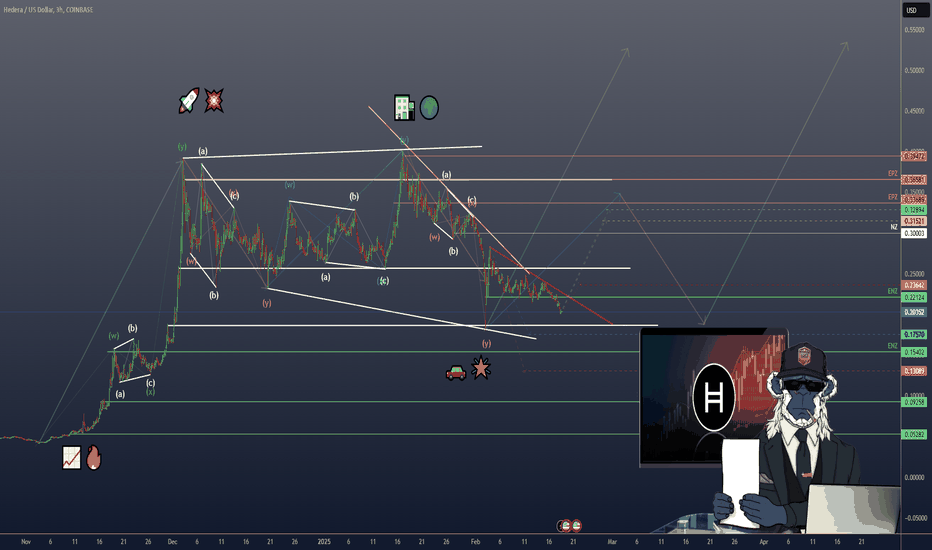
HEDERA’S Q4 2024—$HBAR SURGES ON CHAIN GROWTH & ETF RUMORSHEDERA’S Q4 2024— CRYPTOCAP:HBAR SURGES ON CHAIN GROWTH & ETF RUMORS
(1/9)
Good morning, Tradingview! Hedera’s Q4 2024 is blazing—chain GDP hit $840M, up 213% QoQ 📈🔥. Meme coins and dApps drove the surge, with CRYPTOCAP:HBAR up 30% overnight. Let’s unpack this blockchain beast! 🚀
(2/9) – NETWORK PERFORMANCE
• Q4 Chain GDP: $840M, +213% QoQ 💥
• TVL: $8.6B, DEX Volume: $3.3B/day (+150%)
• Stablecoin Volume: $5.1B/day (+36%)
• Jan ‘25: $517M app revenue, $552M econ value
Hedera’s humming—10k TPS at $0.0001 fees!
(3/9) – BIG MOVES
• Q3 Asset Tokenization Studio: Enterprise appeal soars 🏦
• Feb 9 X Buzz: HBAR ETF rumors, NVIDIA/Intel AI chip embeds 🌍
• Coinbase HBAR Futures: Drops today, Feb 18! 🚗
Speculation and scale are lighting up $HBAR!
(4/9) – SECTOR CHECK
• Market Cap: $11.61B (Jan ‘25), Now $0.39-$0.40 🌟
• Vs. L1s: ETH ($400B), SOL ($88.6B), ADA ( FWB:20B )
• Outpaces in speed/cost, 53% of global L1 fees Dec ‘24
Undervalued sleeper vs. giants? X thinks so!
(5/9) – RISKS TO FLAG
• Volatility: Feb 8 drop hints manipulation 📉
• Regs: ETF hype could flop if SEC stalls ⚠️
• Competition: SOL’s Firedancer, ETH scaling loom 🏛️
• Meme Coin Fade: Speculative juice may dry up
(6/9) – SWOT: STRENGTHS
• Speed: 10k TPS, $0.0001 fees slay 🌟
• Q4 Stats: $840M GDP, $8.6B TVL 🔍
• Enterprise Edge: Nairobi Stock Exchange, SpaceX 🚦
Hedera’s a lean, mean blockchain machine!
(7/9) – SWOT: WEAKNESSES & OPPORTUNITIES
• Weaknesses: Meme coin reliance, smaller dApp pool 💸
• Opportunities: ETF approval, NVIDIA/Intel deals, DeFi push 🌍
Can CRYPTOCAP:HBAR turn hype into lasting heat?
(8/9) – CRYPTOCAP:HBAR ’s Q4 fire—where’s it headed?
1️⃣ Bullish—ETF & tech blast it up.
2️⃣ Neutral—Growth holds, risks bite.
3️⃣ Bearish—Speculation fizzles out.
Vote below! 🗳️👇
(9/9) – FINAL TAKEAWAY
Hedera’s Q4 shines—$840M GDP, ETF buzz, and tech leaps fuel CRYPTOCAP:HBAR ’s charge 🌍. Cheap vs. L1s, but volatility lurks. Gem or trap?
Blockchain
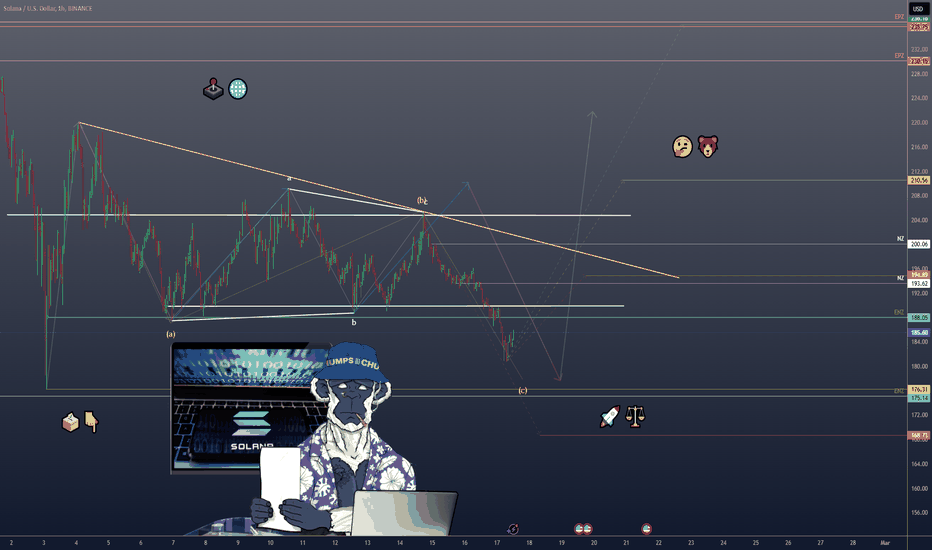
SOLANA ($SOL) – ROARING REVENUE & FIREDANCER POTENTIALSOLANA ( CRYPTOCAP:SOL ) – ROARING REVENUE & FIREDANCER POTENTIAL
(1/7)
Ecosystem Revenue: Solana’s Q4 2024 app revenue surged +213% to $840M (vs. $268M in Q3), largely driven by meme coin mania. Network revenue reached new highs—$517M in app revenue & $552M in real economic value in January alone! Let’s dig in. 🚀
(2/7) – ONCHAIN ACTIVITY
• DEX Volume in Jan: $339B
• Stablecoin supply: $11.4B
• TVL: $8.6B—all-time highs
• 18 Firedancer validators deployed in Q4, boosting transaction capacity
(3/7) – SECTOR SNAPSHOT
• Market cap: ~$88.6B (late Dec 2024)
• SOL token trades around $200–$300 per recent posts
• Some speculate SOL could hit $500–$1,000—strong fundamentals + revenue growth might point to undervaluation vs. Ethereum ⚖️
(4/7) – COMPETITIVE EDGE
• Outperforms many L1 peers in transaction volume, speed, and revenue
• Handles more transactions than all other chains combined (per X posts)
• DEX volume +150% to $3.3B daily in Q4—low fees & high throughput = user magnet 🕹️
(5/7) – RISK FACTORS
• Market Volatility: Crypto’s rollercoaster can swing SOL prices wildly
• Regulatory: US policy changes, token classification → potential headwinds
• Competition: Ethereum scaling (rollups) & new L1s (Aptos, Sui) loom
• Technical Risks: Firedancer delays or issues = potential network reliability concerns
(6/7) – SWOT HIGHLIGHTS
Strengths:
High TPS + low fees → leading L1 contender
Robust ecosystem growth (TVL, DEX, stablecoins)
Strong revenue: $840M Q4 app rev, $517M in Jan alone
Weaknesses:
Heavy reliance on meme coin activity for recent revenue
Centralization worries due to validator concentration
Opportunities:
Solana ETF approval → institutional inflows 🌐
Firedancer aiming for 1M TPS, tech superiority
Expansion into DePIN, PayFi → new revenue streams
Threats:
US regulatory clampdowns
Ethereum’s scaling solutions & emerging L1 competition
Meme coin hype dying down, revenue from speculation dips
(7/7) – Is Solana undervalued or overhyped?
1️⃣ Bullish—Firedancer + revenue surge = unstoppable 🚀
2️⃣ Neutral—Impressive growth, but watch the meme factor 🤔
3️⃣ Bearish—Competition, centralization concerns… pass 🐻
Vote below! 🗳️👇
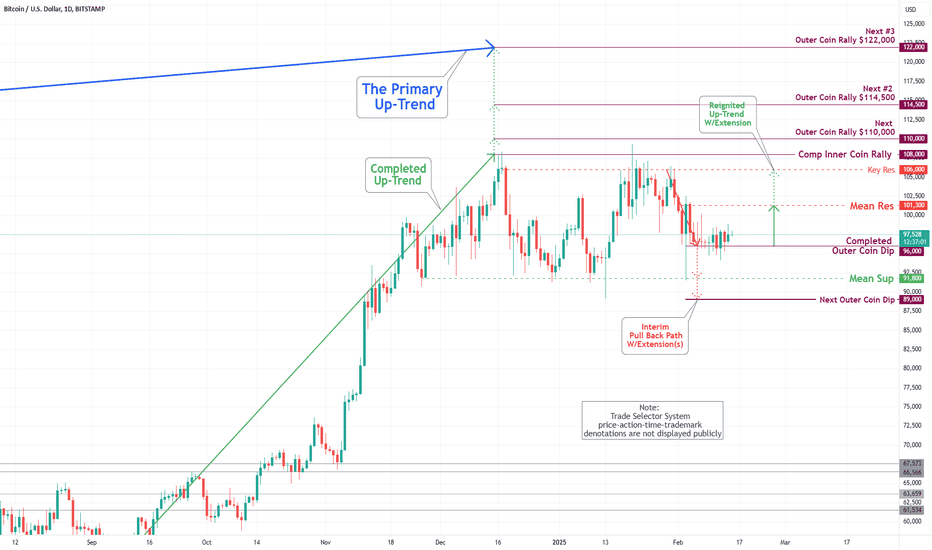
Bitcoin(BTC/USD) Daily Chart Analysis For Week of Feb 14, 2025Technical Analysis and Outlook:
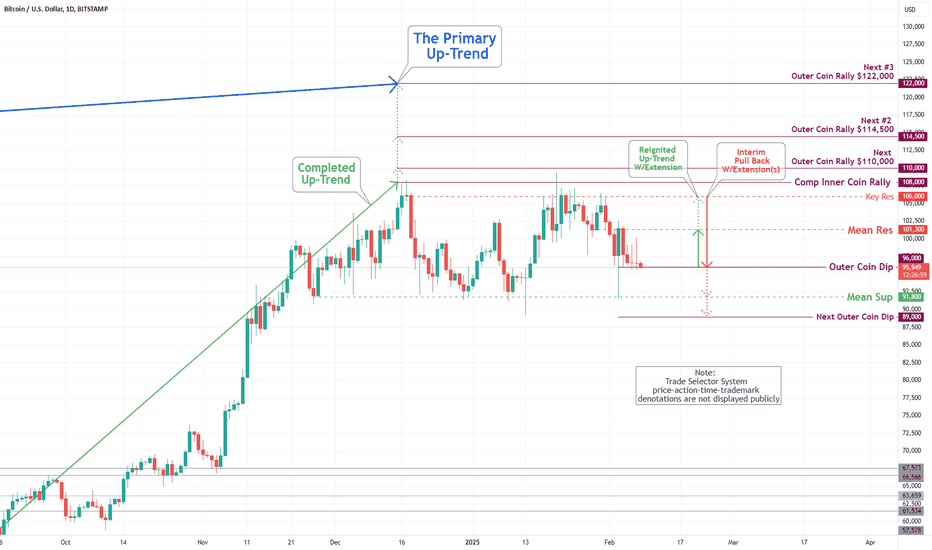
During this week's trading session, Bitcoin has remained closely aligned with the completed Outer Coin Dip at 96000. This development suggests a potential pullback to retest the Mean Support level at 91800, with the possibility of further decline down to the Outer Coin Dip marked at 89000 before a possible resurgence in the bull market.
On the other hand, if the anticipated pullback does not occur, the cryptocurrency may experience upward momentum, retesting the Mean Resistance level at 101300. This could lead to an extension toward challenging the completed Outer Coin Rally at 108000 through Key Resistance at 106000.
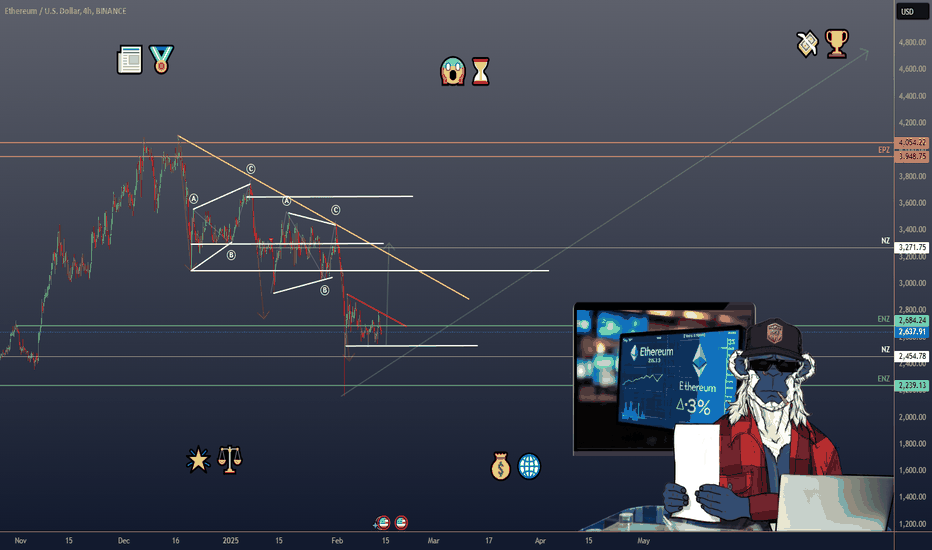
ETHEREUM ($ETH) – COULD STAKING ETFs TRANSFORM THE NETWORK?ETHEREUM ( CRYPTOCAP:ETH ) – COULD STAKING ETFs TRANSFORM THE NETWORK?
(1/7)
Ethereum fees (i.e., network revenue) are climbing as DeFi, NFTs, and now potential staking ETFs attract more usage and institutional capital. Let’s see what’s moving the second-largest crypto by market cap! 🚀💎
(2/7) – RECENT “REVENUE” TRENDS
• Network fees jumping with higher on-chain activity (DeFi, NFTs)
• Potential ETF staking could funnel institutional money and supercharge Ethereum’s fees & usage
• ETH price at $2,647—some say undervalued vs. historical highs & future prospects 💸
(3/7) – STAKING NEWS & IMPACT
• CBOE BZX filed to add staking to 21Shares Ether ETF—a first in the U.S. if approved 🏆
• ETH spiked +3% on Feb 13, 2025, after the news broke 📰
• Could pave the way for more institutional ETH adoption & yield opportunities
(4/7) – CRYPTO SECTOR COMPARISON
• NVT ratio (network value to transactions) suggests Ethereum might be undervalued given expected usage hikes
• Competitors (e.g., Solana, Cardano) also have DeFi & smart contracts, but ETH’s brand & developer base remain top-tier 🏅
• If staking ETFs become mainstream, ETH’s yield potential could shine even brighter 🌟
(5/7) – RISK ASSESSMENT
• Regulatory: SEC scrutiny of staking—could they tighten the reins? ⚖️
• Market Volatility: Crypto can pivot from bull to bear in a heartbeat 😱
• Tech Hurdles: Ongoing Ethereum upgrades (sharding) face potential delays ⏳
(6/7) – ETHEREUM SWOT HIGHLIGHTS
Strengths:
Leading smart contract platform, huge dev community
Growing staking potential, possibly extended to ETFs
Weaknesses:
High gas fees + ongoing scalability concerns
Regulatory uncertainties around staking
Opportunities:
If ETF staking passes, institutional inflows could surge 💰
DeFi & NFT expansion continue to drive demand
Threats:
Lower-fee rivals like Solana or Polygon on the rise 🌐
Potential crackdowns on staking by regulators
(7/7) – Is Ethereum undervalued at $2,647 given the ETF staking hype?
1️⃣ Bullish—ETH’s about to skyrocket! 🚀
2️⃣ Neutral—Show me actual adoption first 🤔
3️⃣ Bearish—Competition & regulation overshadow it 🐻
Vote below! 🗳️👇
Bitcoin(BTC/USD) Daily Chart Analysis For Week of Feb 7, 2025Technical Analysis and Outlook:
On Monday, during the current week’s trading session, Bitcoin reached the Mean Support level of 91800 and consistently hit the targeted Outer Coin Dip at 96000. This development indicates a likely pullback to retest the Mean Support level of 91800, with the possibility of further decline down to the Outer Coin Dip located at 89000 before a potential resurgence in the bull market.
Conversely, the anticipated pullback does not materialize. In that case, the cryptocurrency may experience upward momentum, retesting the Key Resistance level at 106000 and potentially extending to challenge the completed Outer Coin Rally at 108000 and beyond.
Bitcoin(BTC/USD) Daily Chart Analysis For Week of Jan 31, 2025Technical Analysis and Outlook:
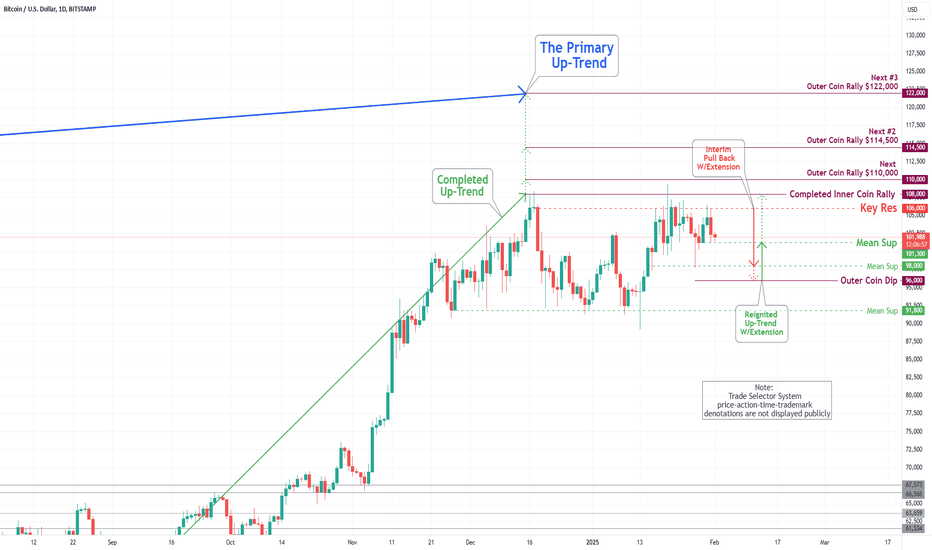
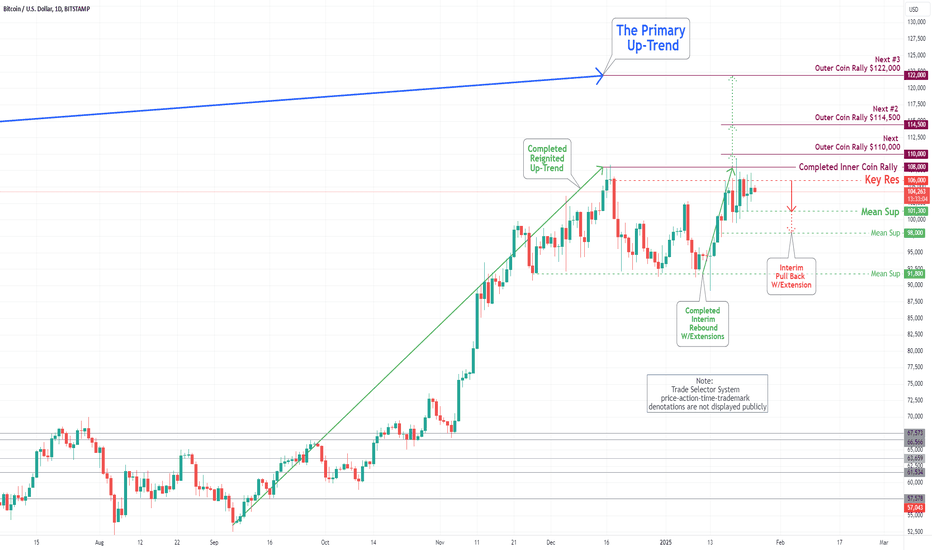
During this week’s trading session, Bitcoin reached its targeted Mean Support levels, specifically at 101300 and 98000. This development indicates a probable pullback to retest the Mean Support level of 98000, with the potential for further extension to the Outer Coin Dip positioned at 96000 before a possible resurgence in the bull market occurs. Conversely, should this anticipated pullback not materialize, the currency may experience upward movement, retesting the completed Inner Coin Rally at 108000 and potentially expanding to 110000 and 114500, ultimately challenging the outermost Outer Coin Rally at 122000.
Komodo (KMD)Introduction:
The Performance of KMD Coin
KMD (Komodo) is a blockchain platform that enables developers to create their own private blockchains while benefiting from robust security features. This coin is used in the cryptocurrency market with the goal of enhancing security, scalability, and interoperability between blockchains. As a result, KMD has a high growth potential and can serve as an attractive option for both investors and blockchain users.
Comprehensive and Optimized Analysis for KMD Coin
📊 Current Market Status:
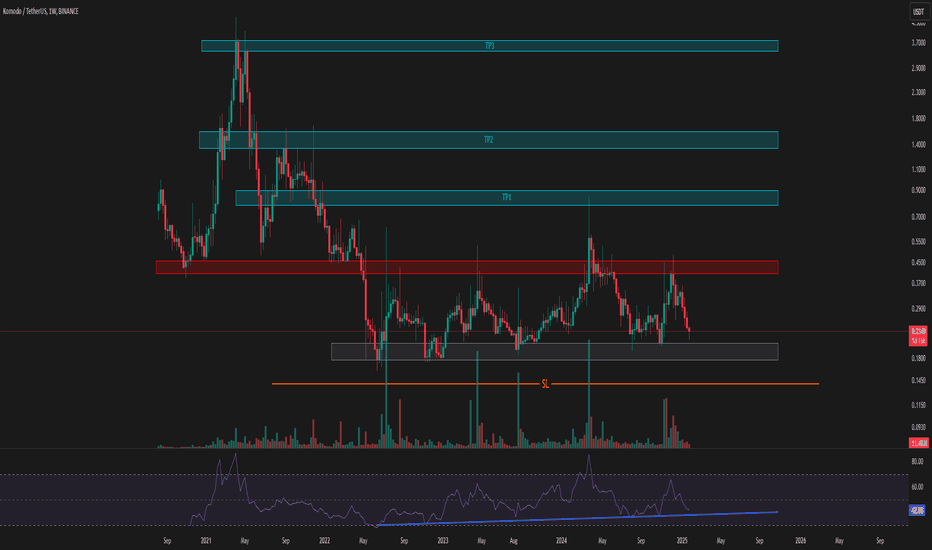
Support Range: 0.1772 - 0.2344
KMD is currently positioned at the lower boundary of a range box. This support area is the most critical level for market entry. If the market holds at this level, there is a potential for price movement toward the upper boundary of the range box and higher resistance zones. This could present an excellent entry point for investors.
Stop Loss: 0.1400
If the support level fails and the price moves lower, the stop loss should be set just below this level. This risk management strategy is crucial to prevent further losses and properly manage the investment.
📈 Price Upside Potential:
Upper Range Boundary (Red Zone):
Resistance Zone: 0.4043 - 0.4584
This resistance zone is observed on the weekly time frame, and based on historical data, each time the price has approached this zone, we’ve seen a pullback to the lower end of the range. However, if the price manages to break through this zone, there’s potential for the uptrend to continue.
Upside Targets (if the upper range boundary is broken):
TP1: 0.7819 - 0.9000
TP2: 1.3486 - 1.5824
TP3: 3.4201 - 3.7903
If the current resistance zone is broken, the price could reach higher targets as listed above.
🔍 Technical Features:
Low Market Cap:
Given KMD’s relatively low market cap, if liquidity flows into the market, this coin could experience growth beyond the mentioned targets. This characteristic provides a higher profit potential for investors.
RSI (Relative Strength Index):
Connecting RSI lows may indicate support at this trend line, suggesting a potential move toward higher levels. This technical tool can be considered a confirmation signal for long positions.
📊 Trading Volume:
To validate the uptrend, trading volume must increase significantly. Low volume could indicate a fake upward move that lacks sustainability. High volume can serve as a strong confirmation signal for the continuation of the uptrend.
🔒 Risk Management and Stop Loss:
After breaking the weekly resistance zone (red zone), the stop loss can be moved below this level.
Also, as price reaches each target and stabilizes above it, the stop loss should be adjusted to below the broken targets to protect the profits.
💡 Conclusion:
KMD is currently at an important support level, and if this level holds, a move toward higher targets can be expected. With favorable technical features like a low market cap, RSI, and trading volume, this coin has high growth potential. For effective risk management, adjusting the stop loss based on price fluctuations and resistance breakouts is essential.
LINK/USDT Analysis – Breakout or Rejection?CRYPTOCAP:LINK is approaching a key descending resistance zone, while the rising trendline continues to provide strong dynamic support (marked with golden boxes).
The price is currently at a decision point—either a breakout or a rejection from resistance.
Please tap the like button to show your support.
Thank you!
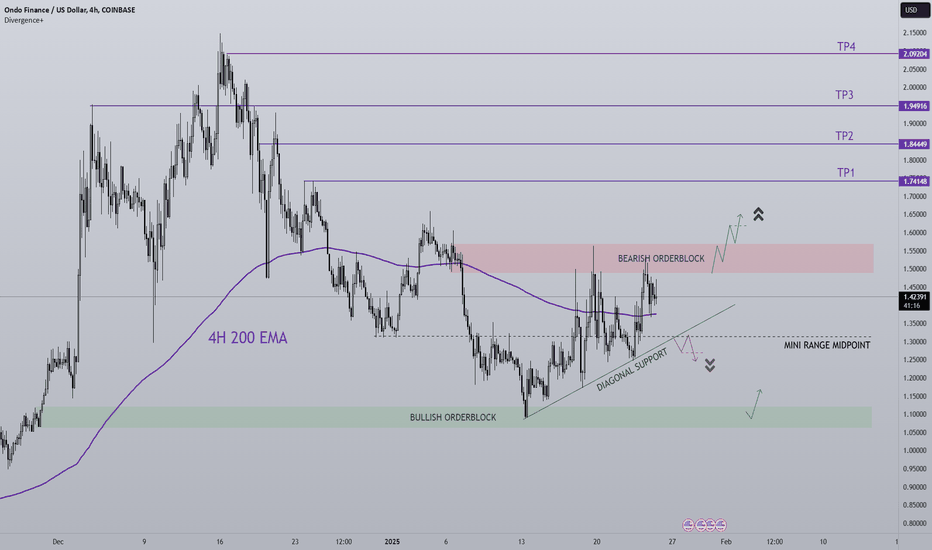
ONDO 4H TRADE SETUP ONDO is a very exciting project with massive potential in the tokenization of real world assets, an aspect of crypto that has many very high profile interested parties, such as BlackRock and now the US Government via the Trump administration. World Liberty Financial (which is run by the Trump family) has an ONDO position currently and has been adding to it over time, so what is the future of ONDO?
For me the chart has some key points:
- Structurally ONDO been bearish since the later stages of December, retracing 50% from local high and losing the 4H 200 EMA in the process before bouncing off the bullish Orderblock that started the end of year rally in the first place, a very strong support area.
That bounce was capped off by the bearish orderblock zone with rejection in that zone on four separate occasions, so we now have a local range with a clear S/R level at the midpoint.
- Within that mini range we have higher lows constantly which forms a diagonal support as buyers put increasing pressure on price to break through the Bearish orderblock. The 4H 200 EMA has also been reclaimed and in a bullmarket this level is a key level to consider, more so during a trending phase and not chop but still important in this situation.
- That's the technical analysis but money is made in execution of the trade. For me a reclaim of the bearish orderblock would be a bullish trigger for ONDO to climb back up the hill towards local high with consideration to set SLs in stages. The trade would be invalidated on a loss of the bearish orderblock flip as this Swing fail pattern often leads to a further sell-off.
- In a bearish scenario, say BTC misbehaves or some bad news hits the timeline I would step away from the coin if diagonal support is lost. I would look to become a buyer at the bullish orderblock which would give a higher probability entry with the range midpoint and bearish orderblock as targets for price to reach.
BTC still runs the market currently with alts not getting much liquidity, I do believe that will change soon going into the second half of Q1. Once Bitcoin can get a trend going altcoins will follow in my view.
Bitcoin(BTC/USD) Daily Chart Analysis For Week of Jan 24, 2025Technical Analysis and Outlook:
During this week's trading session, Bitcoin has successfully achieved and completed a significant Inner Coin Rally at the 108000 level. This development indicates a probable pullback to the Mean Support level of 101300, with the potential for further extension to the Mean Support level of 98000 before a resurgence in the bull market may occur. Conversely, should this pullback not transpire, the currency may experience upward movement, retesting the completed Inner Coin Rally at 108000 and challenging the next Outer Coin Rally at 110000 and beyond.
POL - Bullish Pressure Soon!Hello TradingView Family / Fellow Traders. This is Richard, also known as theSignalyst.
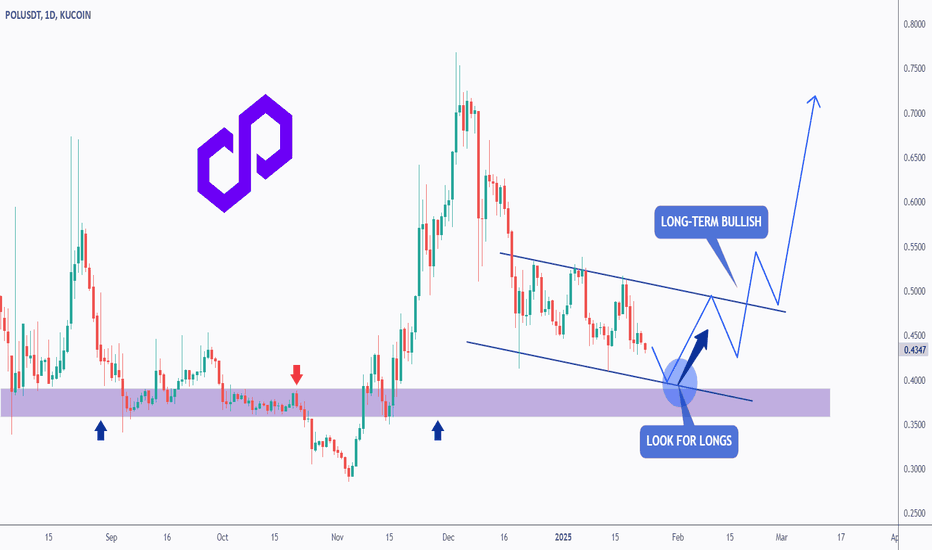
📈POL has been overall bearish trading within the falling channel marked in blue.
Currently, it is approaching the lower bound of the channel.
Moreover, the purple zone is a strong structure and demand.
🏹 Thus, the highlighted blue circle is a strong area to look for buy setups as it is the intersection of support and lower trendline acting as a non-horizontal support.
📚 As per my trading style:
As #POL approaches the blue circle, I will be looking for bullish reversal setups (like a double bottom pattern, trendline break , and so on...)
In parallel, for the bulls to take over long-term, a break above the upper blue trendline is needed.
📚 Always follow your trading plan regarding entry, risk management, and trade management.
Good luck!
All Strategies Are Good; If Managed Properly!
~Rich
Axie Infinity (AXS)🎯 Introduction
AXS (Axie Infinity Shards) is the native token of the Axie Infinity ecosystem, a popular blockchain-based game operating on the "Play-to-Earn" model. Players can earn AXS tokens by breeding, battling, and trading digital creatures known as "Axies." This token is also used in governance mechanisms, staking, and in-game transactions. The growth in AXS’s value is tied to the ongoing development of the game and its wider adoption within the cryptocurrency world.
📊 AXS Technical Analysis
Current Status:
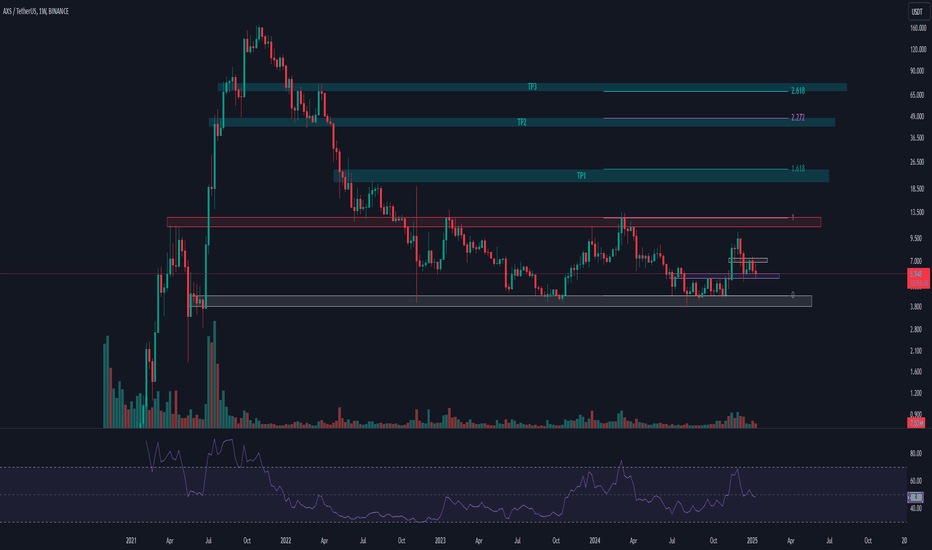
On the weekly timeframe, AXS is in a long-term range-bound zone:
📈 Range High: Red zone (11.186 - 12.605)
📉 Range Low: Gray zone (3.840 - 4.414)
Key Support and Resistance Zones:
Daily Support: Purple zone (5.581 - 5.932)
This zone has acted as a key support level. If lost, the price is likely to fall toward the lower range (gray zone).
Daily Resistance: Yellow zone (6.910 - 7.328)
Breaking through this level could trigger a price move towards the range high (red zone).
Upcoming Scenarios:
🟢 Bullish Scenario:
If the purple support zone holds and the yellow resistance is broken:
Move towards the range high (red zone).
A breakout above the red zone will lead to price targets based on Fibonacci levels:
🎯 TP1: 20.007 - 24.056
🎯 TP2: 41.929 - 48.315
🎯 TP3: 67.896 - 77.108
Important Note: At each of these targets, profit-taking 💵 is strongly advised.
🔴 Bearish Scenario:
If the purple support zone is lost, the price may drop towards the lower range (gray zone).
🎯 Suggested Entry Points:
Break above the daily yellow resistance with a stop loss below the gray zone.
Break above the red resistance with a stop loss below the purple zone.
Indicators and Volume:
RSI:
Crossing above the midpoint of the RSI may indicate a bullish move.
Entering the Overbought region could lead to sharp upward movements 🚀.
📊 Volume Analysis:
Increased volume during resistance breaks is crucial; otherwise, there’s a higher risk of false breakouts.
📌 Summary:
AXS is currently at a critical level. Price behavior in relation to the identified support and resistance zones will determine the future trend. Effective risk management through stop-loss and close monitoring of trading volume are key to success in trading this coin. 💡
Recommendation: Always consider the overall market conditions and any related news regarding the Axie Infinity project before making trading decisions.
Bitcoin(BTC/USD) Daily Chart Analysis For Week of Jan 17, 2025Technical Analysis and Outlook:
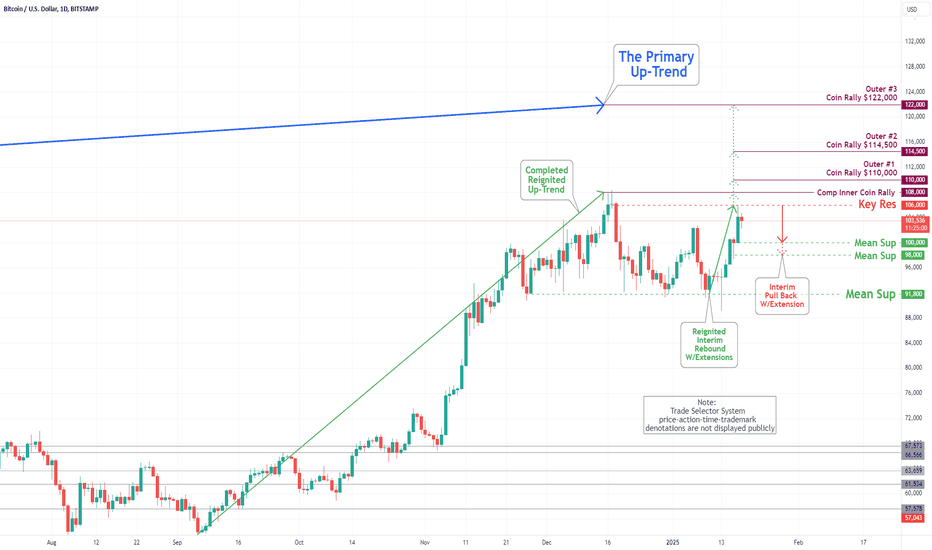
Bitcoin has reached our significant Key Resistance level of 106000 during the current week's trading session. This development signals a retest of the completed Outer Coin Dip of the 108000 cryptocurrency before the expansion of the continued upward movement. Nevertheless, an interim decline may likely occur, leading down to the Mean Support level of 100000, with a potential further extension to the Mean Support level of 95000 before any resurgence in the bull market occurrence.
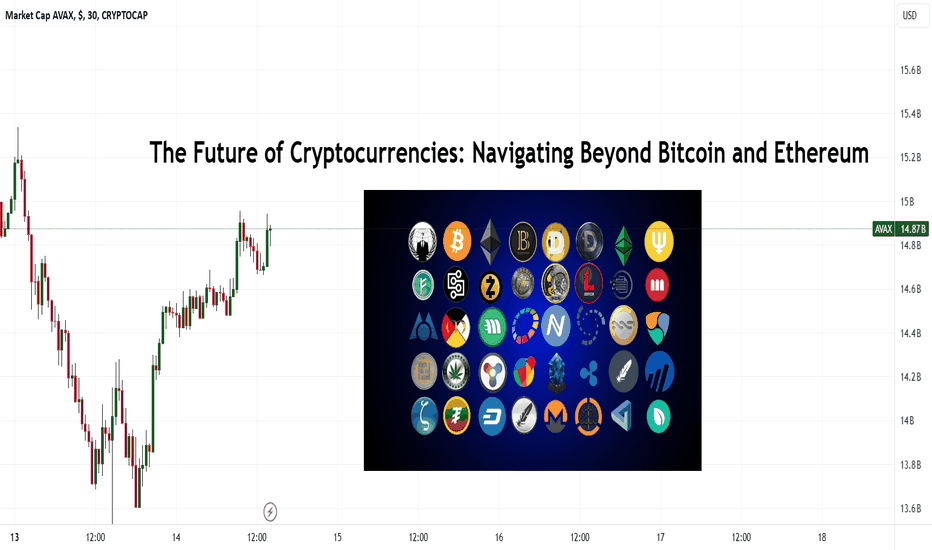
The Future of Cryptocurrencies: Navigating Beyond BitcoinI've been diving deep into the crypto world, and it's clear that Bitcoin and Ethereum aren't the only players anymore. As we're pushing through 2025, the crypto landscape is buzzing with altcoins, DeFi projects, and wild blockchain innovations. Here's how I've learned to navigate this exciting, yet sometimes wild, space:
Beyond Bitcoin and Ethereum
I used to think Bitcoin and Ethereum were the be-all and end-all of crypto, but man, was I wrong. Now, I'm exploring altcoins because:
-Diversification: I spread my crypto eggs across multiple baskets to catch the next big wave while keeping my portfolio balanced.
-Innovation: Altcoins are where the coolest new tech is happening. From privacy features to new ways of reaching consensus, it's like a tech playground out there.
Current Trends in Altcoins
-DeFi Developments: I've fallen down the rabbit hole of DeFi. Platforms like Aave or Compound? They're letting me lend, borrow, or farm yields directly on the blockchain. It's like the Wild West of finance, but I'm loving the autonomy and potential returns.
-Layer 2 Solutions: Ethereum's scaling problems got me looking at projects like Polygon (MATIC) and Solana (SOL). These are speeding up transactions and cutting costs, making blockchain tech more usable for everyday stuff, from gaming to buying digital art.
My Investment and Trading Strategies
Researching Altcoins:
-Technology: I geek out on the tech. Does it solve a real problem?
-Team: I check if the team behind it seems legit or if they're just in it for the quick buck.
-Community: A lively community is a good sign. It's like having a cheerleading section for your investment.
-Real-world Use: I'm all about coins that have a practical use. It gives me confidence in their longevity.
Portfolio Allocation: Here's how I juggle my crypto stash:
50-60% in Bitcoin and Ethereum for stability.
20-30% in well-established altcoins with solid fundamentals.
10-20% for the moonshots – those high-risk, high-reward projects that keep the thrill alive.
Managing Risks in Crypto Trading
- Volatility : Crypto can be a rollercoaster. I use dollar-cost averaging to smooth out the wild rides and set stop losses because, let's be real, I've learned the hard way that the market can tank when you least expect it.
-Security: I'm super paranoid about security. I keep my significant holdings in hardware wallets and do my homework on every ICO – because scam coins are real, folks.
Case Studies
- Success Story: I've been watching Cardano (ADA), which has been on fire with its focus on security and real-world applications, especially in Africa. It's been a good reminder that tech with purpose can go places.
-Cautionary Tale: The Terra (LUNA) crash was a wake-up call. It showed me how quickly things can go south in the crypto world, especially with stablecoins.
Technological Innovations
- NFTs: I've seen NFTs go from digital art to owning pieces of virtual land. They've changed my view on what digital ownership can be.
-Cross-Chain Solutions: Projects like Polkadot and Cosmos are fascinating because they're trying to make all these different blockchains talk to each other. It's like building a universal translator for crypto.
Looking Ahead
-Regulatory Landscape: I keep an eye on regulations because they could either make or break some altcoins I'm interested in.
-Integration with Traditional Finance: I'm seeing more and more traditional finance players dipping their toes into crypto. It's exciting to watch.
Next Big Use Case: I'm always on the lookout for the next big thing, like Web3, which could totally shift how we interact online.
If you want to know more, send me a DM or head over to my profile. If you liked this post, please don't forget to boost, share, and comment below.
Kris/Mindbloome Exchange
Trade What You See
Bitcoin(BTC/USD) Daily Chart Analysis For Week of Jan 10, 2025Technical Analysis and Outlook:
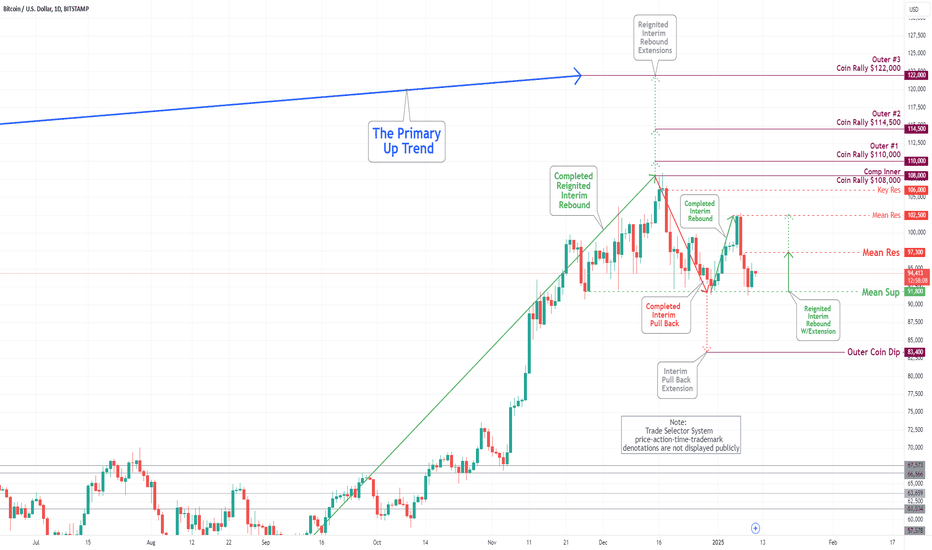
Bitcoin has surpassed our crucial Mean Resistance of 99500 in this week's trading session by plunging sharply back to a critical Mean Support of 91800. This decline suggests that a significant interim pullback may be underway, potentially bringing the cryptocurrency to the Outer Coin Dip 83400 before any resurgence in the bull market occurs. However, an interim strong upside move to Mean Res 97300 might be in the works.
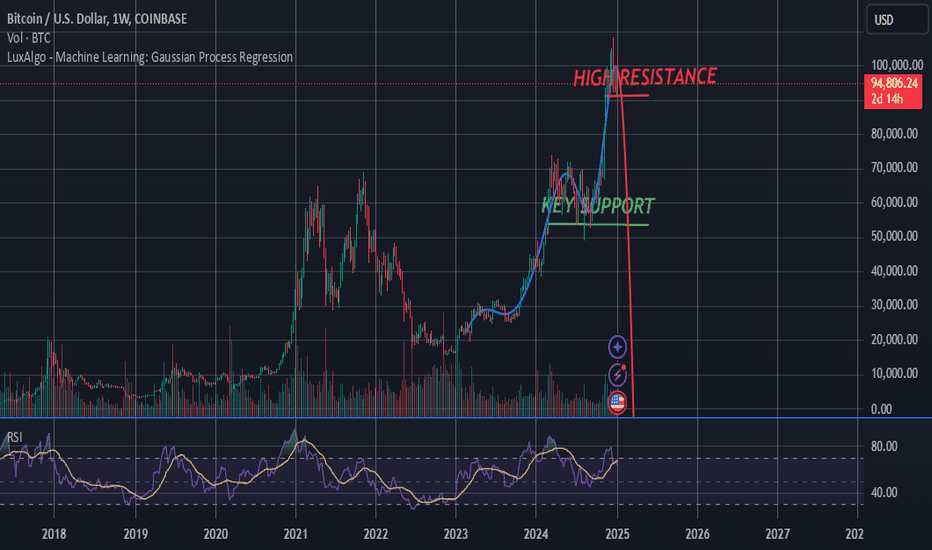
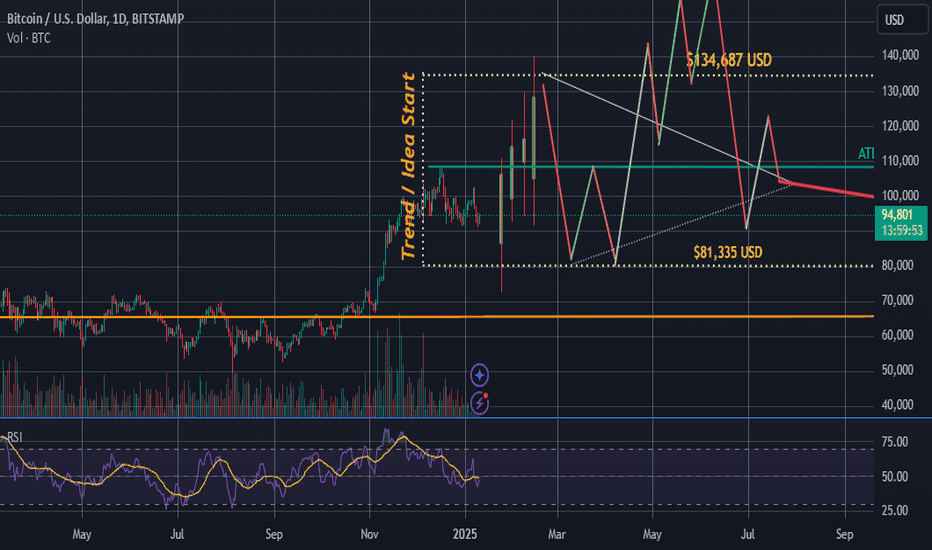
$BTC consolidation continues as we approach HUGE UP/DOWN EventI know we cant predict it but we can speculate. I use many many strategies and analytic built into trdingview and many other trading sites tools for trading cryptocurrency and FX stocks etc.. To the point. Using this ML by LuxAlgo sows a bad pic for BTC on 1D and 1W BUT the 1H is showing up trend to 130k~ the opposite for the 1D down to possibly 55k then the 1W is more SHARP down to $35k :L REMEMBER this is a Machine learning bot not the best thing to guess with. BUT it does work for what its made to do and I have made many positive gains with this tool alone or with MACD or RSI or sometimes other ML scrips or analytics.
So please put this over your BTC chart and see what LUX ALGOs ML chart as shown in idea on Left middle side. Check ho various it is not just on BTC but also try ETH and other smaller markets or memes like PEPE or even BONK etc or oter chain types POL(was MATIC) or DOT or ATOM etc. See and check the change between short 1Min - 1Hour vs 1Day - 1Month.
Note THIS indication isn't Correct! No IDEA is not 100%. Remember that. Remember "What WILL BE WILL BE" or "WHAT HAPPENS WILL HAPPEN" as my nan always said if we anxious of future events! It set me free literally as you realize its always going to Be what it Will BE! It cannot be changed! You think it can. and you CAN if you realize this. Then you can act with knowledge that you much make change in the NOW present to make that change you wanted in the Future.
If you manifest it it can happen. and that makes it What will be will be ore true. if you didn't do it it would still BE what it will be at that time. It cant change via thought. It can chnge by action before the "future".
ANyway share BTC knowlede share ideas sty strong! This isnt going to happen anyway...
$BTC Long long term Short Short term seems like its following VHi all how are we!? hope spirit are well stay strong!
This is update to my first of this idea the same idea I posted at the line it started. Its slowly moving to a LL Low low currently shaping a HL high low. When it swaps into a LH Low High that is confirmation of bullish sentiment between the LL nd HL. Basically a prime time to buy if other signals and analytics tell you to make a buy/long position. Never go of what I or anyone in Ideas say ALONE.. or reddit soil even Bloomberg or Forbes..
Anyway share your input o we can all learn more and grow as the Bitcoin Community!
Bitcoin(BTC/USD) Daily Chart Analysis For Week of Jan 3, 2025Technical Analysis and Outlook:
As specified in the Bitcoin Daily Chart Analysis for December 27, an extraordinary rebound bull movement occurred from the Mean Support of 91800. Current analysis suggests a high likelihood that the cryptocurrency will continue to advance, potentially testing the Mean Resistance level of 99500 and aiming for a retest of the completed Inner Coin Rally marked at 108000. Nevertheless, it is crucial to recognize the possibility of a pullback to retest the Mean Support level of 91800 again before any resurgence in the bull market.
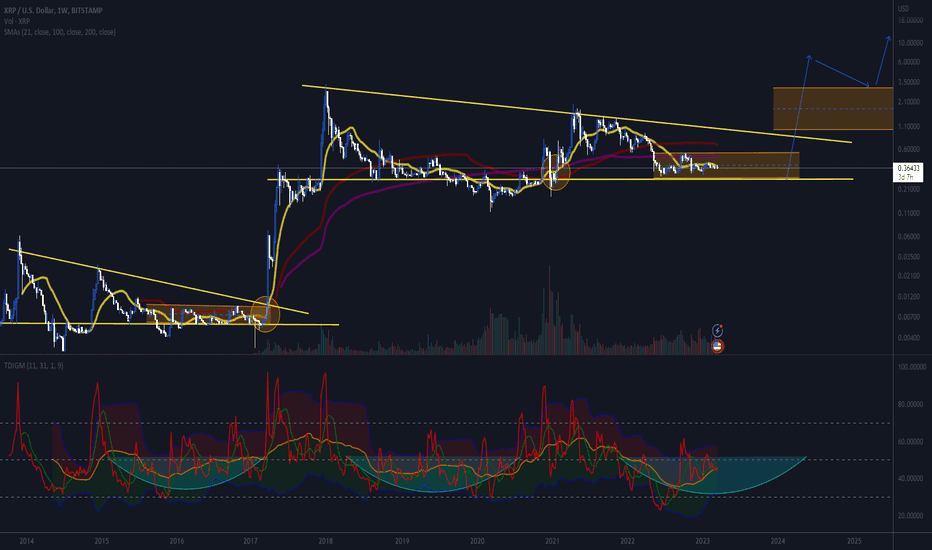
XRP, will history repeat?XRP and the Army.
XRP will do nothing and could be considered a stable coin until it finally doesn't. Historically XRP does nothing without the rest of the market, they all follow bitcoin.
When does the magic start? When the yellow line crosses the purple and the red, more specifically the purple. Until then, stable coin. I have that area circled in prior history.
When it starts it should be 4 weeks of insanity then a correction and pause for approximately 8 months and a final 4 weeks of the final phase. That's the good news, the bad news is it might be well into 2024 and bitcoin will have to make new highs before XRP de-pegs it self from it's stable coin status.
I have also added the TDI indicator on the bottom as it shows the bear market areas and bull market areas.
I Have linked another chart that I made a few back on XRP and a lengthening altcoin cycle chart.
I have picked long for XRP but I don't expect it anytime soon. The earliest would be late this year but most likely 2024.
WeAreSat0shi
Thank you
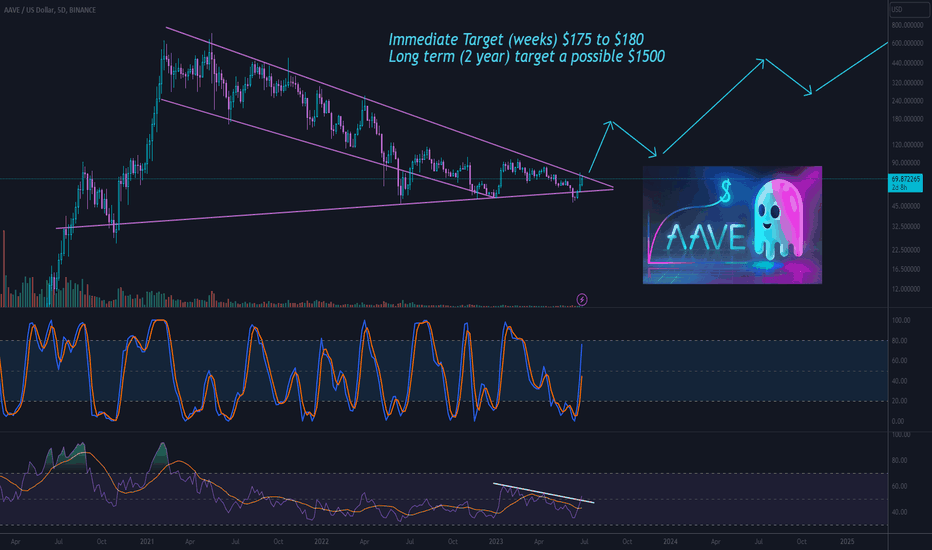
AAVE, Break out and bullish move eminent? Aave looks like it's building momentum that could break out of the bull flag/pennant. A break out of this formation could lead to $175 move in fairly short deration.
The technical trade is the break out and a hold of the break out. If it were to fall back in the zone it is considered a fake out.
Either way you cut it, AAVE is good price here for long term growth.
Let me know what you think AAVE and this analysis down below.
Kind regards
WeAreSat0shi
