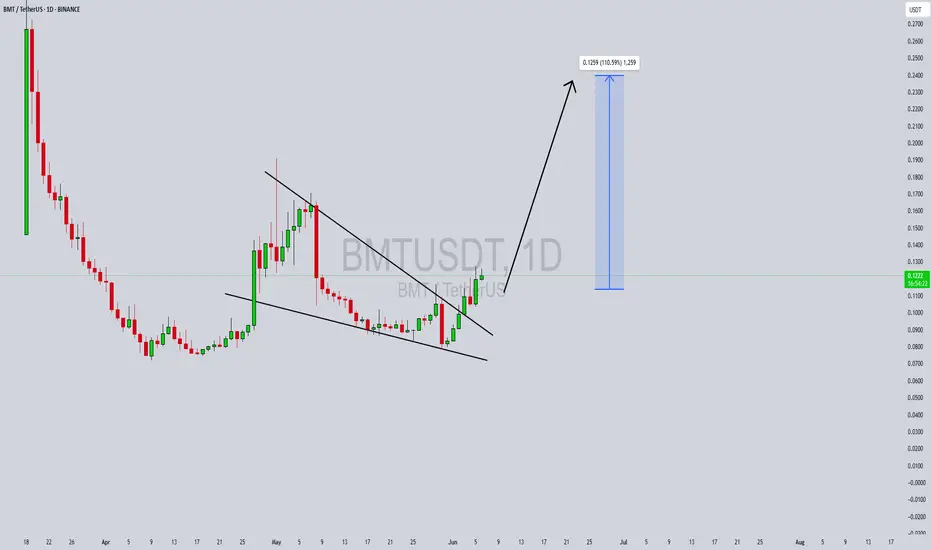
BMTUSDT Forming Strong BullishBMTUSDT is demonstrating a strong bullish structure following its breakout from a descending wedge, which typically signals a reversal of trend. After consolidating for several weeks in a falling wedge pattern, the breakout to the upside—supported by increasing volume—marks a clear shift in momentum. Buyers are reclaiming dominance, and the price is now holding above a strong support zone highlighted in purple, which has acted as a solid accumulation area.
The chart shows a projected upward move with two target levels, suggesting potential gains of 30% in the near term and over 100% in the mid-term. These targets are realistic given the size of the breakout and the bullish price action. The pattern breakout is accompanied by bullish candles and consistent higher lows, adding credibility to the breakout setup. Technical traders watching this pair may interpret the current setup as a high-reward, low-risk opportunity.
What makes BMTUSDT especially interesting is the timing—it's breaking out while the broader market is showing signs of recovery and renewed interest in altcoins. As sentiment shifts across the crypto landscape, projects like BMT that show real-time technical strength tend to draw in both retail and algorithmic interest. Combined with healthy trading volume, this can fuel a rapid price climb toward the highlighted targets.
This setup places BMTUSDT on the radar for breakout traders and swing investors alike. With strong support levels, bullish breakout confirmation, and significant upside potential, BMTUSDT could offer one of the most promising mid-cap opportunities in the current market cycle.
✅ Show your support by hitting the like button and
✅ Leaving a comment below! (What is You opinion about this Coin)
Your feedback and engagement keep me inspired to share more insightful market analysis with you!
Bmtbtc

BMTUSDT Forming a Bearish TriangleBMTUSDT is currently forming a bearish triangle pattern on the chart, which typically signals potential downward continuation. However, what makes this setup intriguing is the price's strong resilience around a key support level and signs of accumulation within the pattern. The volume remains steady, which could indicate growing investor interest despite the bearish appearance. This could set the stage for an unexpected breakout in the opposite direction, potentially flipping the market sentiment and leading to a sharp rally.
While the triangle suggests caution, seasoned traders understand that breakouts from such patterns—especially in altcoins—can lead to explosive moves when combined with strong volume and market interest. BMTUSDT is now in a critical zone, and if buyers step in with conviction, we could see a reversal and surge of 90% to 100% or more, targeting higher resistance zones. These setups often surprise the market, especially when retail sentiment is overly bearish.
This crypto project is also gaining attention due to its increasing presence across social platforms and crypto communities. As altcoin season gradually gains momentum, coins like BMTUSDT with technical breakout potential and active trading volumes become prime candidates for short-term gains. Watching for a clean breakout above the triangle resistance could provide the perfect entry for momentum traders.
In conclusion, BMTUSDT is worth monitoring closely. It offers a unique scenario where technical bearishness could be overturned by investor accumulation and a possible trend reversal. A confirmed breakout with volume could trigger a powerful upside move that catches many off guard.
✅ Show your support by hitting the like button and
✅ Leaving a comment below! (What is You opinion about this Coin)
Your feedback and engagement keep me inspired to share more insightful market analysis with you!
BMT Rebuy Setup (4H)After the heavy drop in BMT, the price is now approaching demand zones.
If it reaches the green zone, we can consider entering a buy position there.
Risk and capital management should not be forgotten.
Targets are marked on the chart. A daily candle closing below the invalidation level will invalidate this analysis.
For risk management, please don't forget stop loss and capital management
When we reach the first target, save some profit and then change the stop to entry
Comment if you have any questions
Thank You
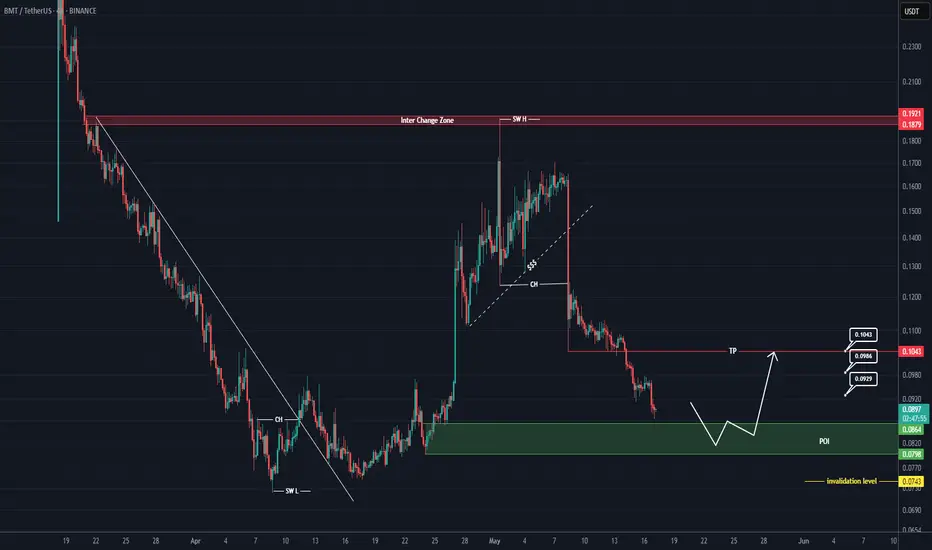
BMT rebuy setup (4H)Given the momentum drop, lack of reaction to hourly support zones, and candlestick formation, it is recommended that if you're looking for a rebuy on BMT, you should wait for a setup in the demand zone at the lower part of the chart.
It seems we have a large triangle, with wave D likely to end in the green zone.
After buying, once you're 20% in profit, start scaling out gradually and break even.
A daily candle closing below the invalidation level will invalidate our buy outlook.
For risk management, please don't forget stop loss and capital management
Comment if you have any questions
Thank You
