BMT/USDT – Major Rebound Potential from Accumulation Zone?🔍 Overview
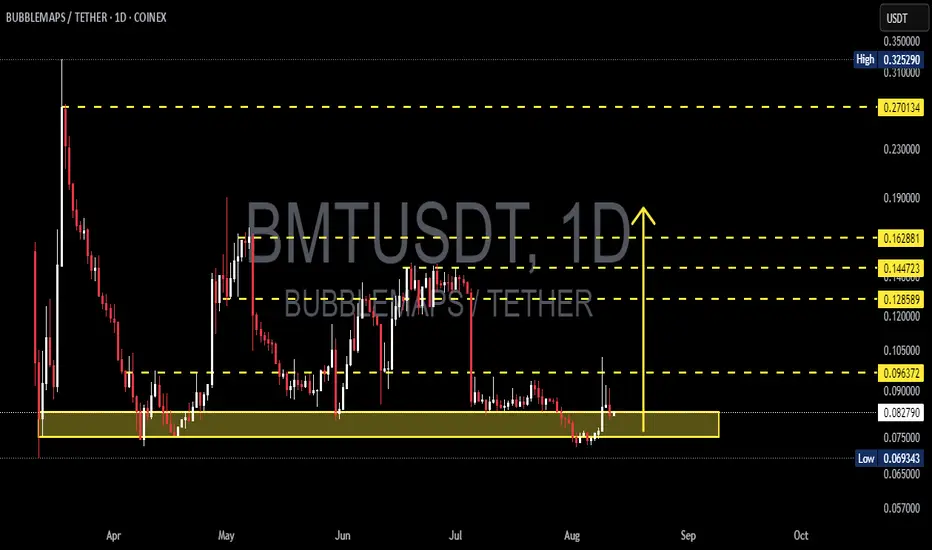
BMT/USDT is currently trading at a critical support zone after a prolonged downtrend from the local peak at 0.32529. The 0.075 – 0.083 range, highlighted in yellow, has acted as a strong price defense area from March to August 2025.
The structure indicates a potential reversal pattern if the price can break above key resistance levels.
---
📈 Pattern & Technical Structure
Main Pattern: Potential Double Bottom or Accumulation Base on the daily chart.
Key Support:
Accumulation zone: 0.07500 – 0.08277
Final support: 0.06934 (lowest price of the year)
Layered Resistance Levels:
R1: 0.09637 → First psychological resistance
R2: 0.12859 → Short-term profit-taking area
R3: 0.14472 → Mid-term resistance
R4: 0.16288 → Major resistance before a strong rally
R5: 0.27013 → Long-term bullish target
---
🚀 Bullish Scenario
If the price breaks and sustains above 0.09637 with significant volume:
Short-term target: 0.12859 (+55% from current price)
Mid-term target: 0.14472 – 0.16288 (+74% to +96%)
Long-term major breakout target: 0.27013 (+226%)
Additional Confirmation:
RSI climbs above 50 and continues to strengthen
MACD forms a golden cross
Gradual increase in buying volume
---
⚠️ Bearish Scenario
If the price fails to hold above 0.075 and breaks 0.06934:
Potential downside targets:
S1: 0.06500 (-21%)
S2: 0.05700 (-31%)
Additional Confirmation:
Surge in selling volume
Daily candlestick closes below 0.06934
RSI breakdown below 40
---
🎯 Strategy & Risk Management
Buy at Support Strategy:
Entry at 0.082 – 0.083, SL below 0.06934, Target 0.12859 → Risk:Reward ± 3.4
Breakout Buy Strategy:
Entry after daily close above 0.09637, SL below 0.082, Target 0.14472 → Risk:Reward ± 2.24
---
📌 Conclusion
BMT/USDT is at a make-or-break zone: a successful breakout could trigger a strong rally, while a breakdown would extend the bearish trend. This is a decision point for swing and position traders to monitor closely.
#BMTUSDT #CryptoAnalysis #Altcoins #TechnicalAnalysis #PriceAction #Crypto #BreakoutTrading #SupportResistance #CryptoSignal #AltcoinSeason
Bmtlong
BMT/USDT Rebounding from Strong Demand Zone Is a Major Breakout?🧠 Complete and Insightful Technical Analysis:
The daily chart of BMT/USDT reveals a compelling structure for traders looking to capitalize on early-stage reversals and bottom entries. The price is currently consolidating within a strong historical demand zone, ranging between $0.069 – $0.087 USDT — a level that has previously triggered multiple significant rallies (March, May, July 2025).
This isn’t just any support zone; it's a classic accumulation area, where bearish momentum appears to be fading and buyers are gradually stepping in.
🔍 Identified Chart Patterns:
✅ Accumulation Range – Sideways movement within the highlighted yellow box suggests a potential base formation.
✅ Double Bottom (W Formation) Potential – A break above resistance would confirm this bullish pattern.
✅ Wyckoff Spring Setup – If a fake breakdown below support occurs followed by a swift recovery, it could signal a powerful trend reversal.
🚀 Bullish Scenario (Reversal in Play):
If the price continues to hold above the $0.069 support, it sets the stage for a strong bullish reversal. A confirmed breakout above $0.096 with high volume would validate the bullish thesis.
📈 Upside Targets:
TP1: $0.096 USDT – Local resistance
TP2: $0.128 USDT – Previous key equilibrium zone
TP3: $0.144 - $0.162 USDT – Historical resistance
TP4: $0.270 - $0.290 USDT – Major range top
This structure provides the potential for a +200% upside move if momentum builds and resistance levels are broken sequentially.
⚠️ Bearish Scenario (Breakdown Risk):
If the price fails to hold above the demand zone and closes below $0.069, the bearish outlook takes precedence:
The next support sits at $0.063
A breakdown below this may lead to price discovery lower with strong downside pressure
👉 Caution is advised: use tight risk management if trading within this range.
🔑 Key Takeaways:
The yellow box is a critical battleground between bulls and bears.
Holding this demand zone could ignite a strong breakout.
The risk/reward setup is favorable for swing and trend traders.
A confirmed breakout could signal the start of a new bullish phase.
📊 Additional Chart Stats:
Current Price: ~$0.075 USDT
Support Zone: $0.069 - $0.087
Key Resistance Levels: $0.096 / $0.128 / $0.144 / $0.162 / $0.270
Market Structure: Sideways → Accumulation → Breakout Potential
#BMTUSDT #CryptoTrading #BreakoutSetup #WyckoffMethod #AltcoinAnalysis #SupportAndResistance #SwingTradeOpportunity #CryptoReversal

BMTUSDT Forming Strong BullishBMTUSDT is demonstrating a strong bullish structure following its breakout from a descending wedge, which typically signals a reversal of trend. After consolidating for several weeks in a falling wedge pattern, the breakout to the upside—supported by increasing volume—marks a clear shift in momentum. Buyers are reclaiming dominance, and the price is now holding above a strong support zone highlighted in purple, which has acted as a solid accumulation area.
The chart shows a projected upward move with two target levels, suggesting potential gains of 30% in the near term and over 100% in the mid-term. These targets are realistic given the size of the breakout and the bullish price action. The pattern breakout is accompanied by bullish candles and consistent higher lows, adding credibility to the breakout setup. Technical traders watching this pair may interpret the current setup as a high-reward, low-risk opportunity.
What makes BMTUSDT especially interesting is the timing—it's breaking out while the broader market is showing signs of recovery and renewed interest in altcoins. As sentiment shifts across the crypto landscape, projects like BMT that show real-time technical strength tend to draw in both retail and algorithmic interest. Combined with healthy trading volume, this can fuel a rapid price climb toward the highlighted targets.
This setup places BMTUSDT on the radar for breakout traders and swing investors alike. With strong support levels, bullish breakout confirmation, and significant upside potential, BMTUSDT could offer one of the most promising mid-cap opportunities in the current market cycle.
✅ Show your support by hitting the like button and
✅ Leaving a comment below! (What is You opinion about this Coin)
Your feedback and engagement keep me inspired to share more insightful market analysis with you!
