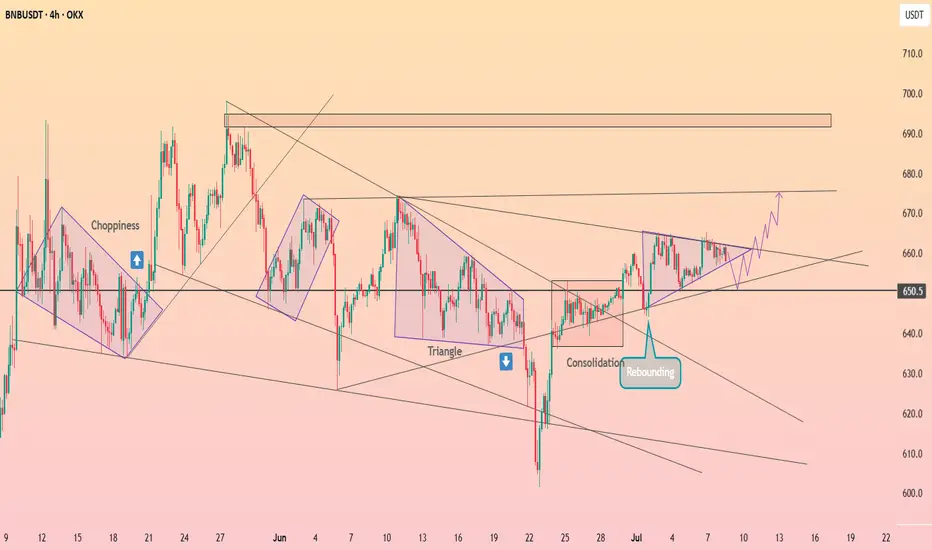
HolderStat┆BNBUSD forming the triangleBINANCE:BNBUSDT is approaching the apex of a symmetrical triangle pattern with strong support from 650. Repeated rebounds and higher lows indicate bullish pressure. A breakout above 665 could drive price to test the 695 resistance block.
BNB
Skeptic | BNB Surge: Rocket Triggers for Spot & FuturesHey everyone, it’s Skeptic! 😎 Is BNB ready to rocket? I’m diving into a pro-level breakdown of Binance Coin (BNB), a top 5 crypto with a $92.9B market cap, now trending on CoinMarketCap with surging momentum. This analysis unpacks recent upgrades, ecosystem strength, and technical triggers for spot and futures trading, grounded in cycle-based strategies. Trade with no FOMO, no hype, just reason.
Recent Performance & Key Events
Binance Coin ( BNB ), trading at $ 660 with a $92.9 billion market cap, ranks among the top 5 cryptocurrencies globally. The Maxwell hard fork in recent weeks slashed block times to 0.75 seconds, boosting network speed and efficiency, adding $8 billion to the Binance Chain’s market cap. BNB powers the Binance ecosystem, supporting staking, NFTs, and DeFi projects. Despite regulatory scrutiny, ongoing platform expansion and token burn mechanisms sustain BNB’s utility and investor interest. Let’s dive into the technical setup for actionable trades. 📊
Technical Analysis: Cycle-Based Breakdown
The Weekly timeframe is range-bound, so lower timeframes drive price action. Let’s break it down:
Daily Timeframe
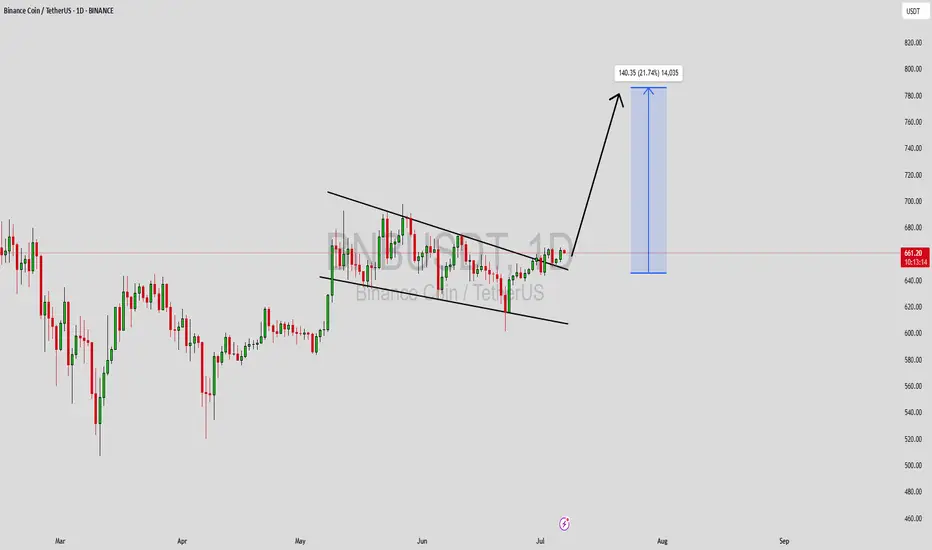
On the Daily, we had a primary uptrend within an upward channel, which broke downward. I cloned the channel and placed it below, and price has reacted well to the midline, still holding there. A midline break could drive price to the channel floor at $536.47. However, a V-pattern stands out as one of the strongest patterns. Why? It shows sellers broke support and consolidated below, but buyers overwhelmed them, pushing price back above support instantly. This signals immense buying pressure, liquidating shorts despite heavy selling—big respect to buyers! lol
💬 For spot trading , wait for BTC.D to turn bearish, as rising BTC.D means liquidity flows to Bitcoin, making altcoin buys less attractive. BNB/BTC turning uptrend is another confirmation—currently, BNB/BTC is bearish, so focus on Bitcoin for now. Check pair/BTC ratios to spot coins outperforming Bitcoin.
Key Insight: Volume and BTC.D/BNB/BTC confirmation are critical for spot buys to avoid low-liquidity traps.
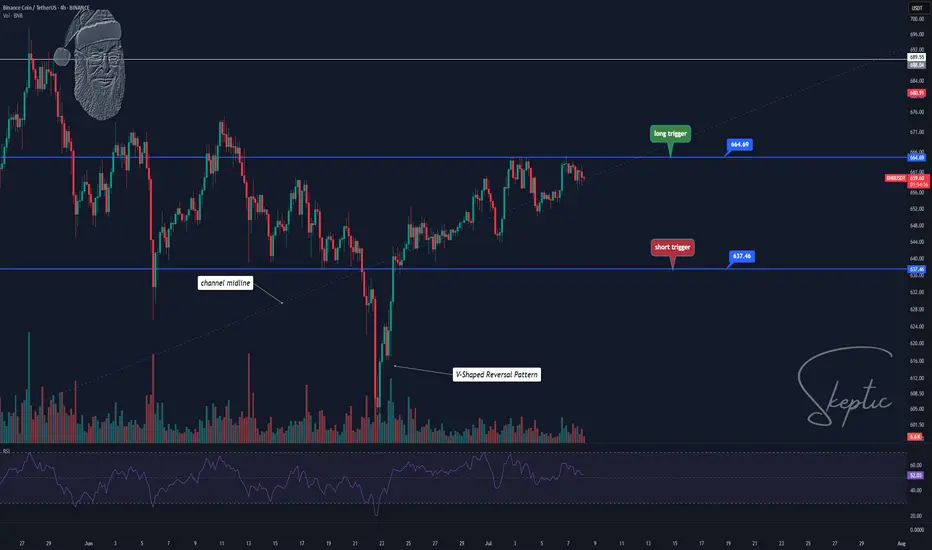
4-Hour Timeframe (Futures Triggers)
On the 4-hour, for longs:
Trigger: Break of resistance at $ 664.69 , confirming the V-pattern. Validate with a volume surge on breakout and RSI entering overbought.
Short Trigger: If support at $ 637.46 breaks again, go short, as buyers may lack strength after exhausting their effort in the prior defense. Volume confirmation is essential.
Pro Tip: ALWAYS use volume to confirm positions. Without a volume spike, fakeout risk is high. Stick to 1%–2% risk per trade to protect capital.
Final Vibe Check
This BNB breakdown delivers precise triggers: long at $664.69 (futures with V-pattern confirmation), short at $637.46 (futures). With a range-bound Weekly and Daily V-pattern, volume and BTC.D/BNB/BTC signals are your edge. BNB’s Maxwell fork and ecosystem strength fuel its potential, but regulatory risks demand tight stops. Want more cycle setups or another pair? Drop it in the comments! If this analysis sharpened your game, hit that boost—it fuels my mission! 😊 Stay disciplined, fam! ✌️
💬 Let’s Talk!
Which BNB trigger are you eyeing? Share your thoughts in the comments, and let’s crush it together!
BNBUSDT Forming Bullish PennantBNBUSDT is showing an impressive breakout pattern that’s catching the attention of crypto investors and traders alike. Binance Coin has consistently proven itself as a top altcoin, and this breakout signals a strong shift in momentum that could push prices higher by 10% to 20% in the short term. The current surge in trading volume supports this bullish scenario, indicating that both retail traders and institutional players are positioning themselves for potential upside gains.
This breakout is not just a technical event — it’s underpinned by BNB’s robust fundamentals. Binance Coin remains one of the most utility-driven tokens in the crypto market, with use cases ranging from transaction fee discounts on the Binance Exchange to staking, launchpad participation, and even DeFi projects. As Binance continues to expand its ecosystem, the demand for BNB is likely to grow, adding fuel to this breakout rally.
For traders, the key is to watch for price stability above the breakout level and look for confirmation signals that the move is backed by sustainable momentum. Managing risk with clear stop-losses and profit targets will be crucial as the market reacts to broader trends and any news from the Binance ecosystem. With the current sentiment positive and buyers stepping in aggressively, BNB could be poised for another leg higher in its long-term uptrend.
✅ Show your support by hitting the like button and
✅ Leaving a comment below! (What is You opinion about this Coin)
Your feedback and engagement keep me inspired to share more insightful market analysis with you!
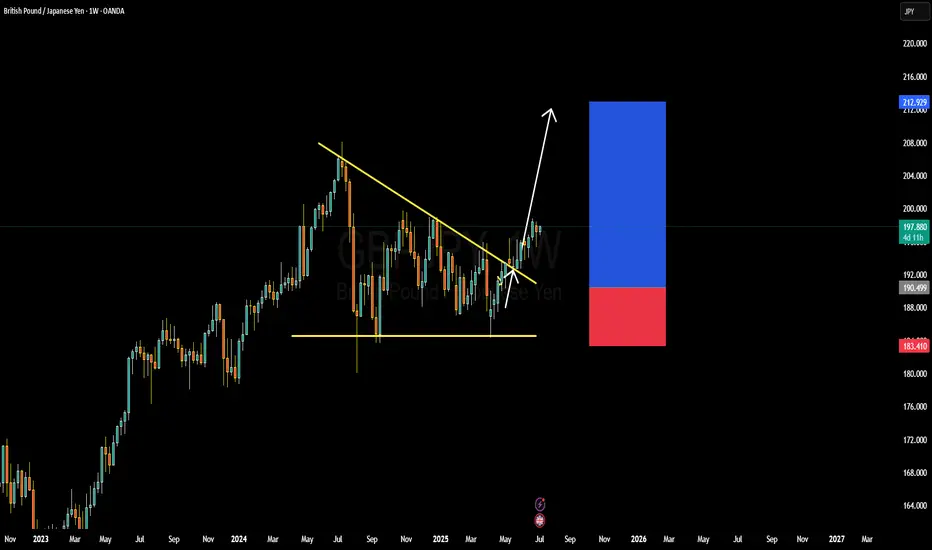
GBPJPY BULLISH OR BEARIS DETAILED ANALYSISGBPJPY has successfully broken out of a long-term falling wedge on the weekly chart, and the bullish momentum is unfolding as expected. Price has rallied from 190.00 to the current 197.00 level, delivering solid profits from the breakout zone. This continuation setup is extremely strong, with the market respecting the wedge breakout structure and forming higher highs. As long as we hold above the 190.00 support, the bullish bias remains fully intact, with 205.00 as the next key upside target.
Fundamentally, the British pound remains well-supported due to the Bank of England’s hawkish stance. Despite softer inflation data, the BoE has signaled a cautious approach to rate cuts compared to other central banks, maintaining underlying GBP strength. On the other side, the Japanese yen continues to weaken as the Bank of Japan sticks with its ultra-loose monetary policy. Yen weakness is further fueled by rising US and UK bond yields, widening the yield differential and attracting carry trades into GBPJPY.
Technically, the breakout is unfolding with textbook precision. Price has cleared descending resistance, retested it, and is now building a new leg higher. The volume profile is supporting this bullish breakout, and market structure is confirming further upside. The 200.00 psychological level may act as a minor resistance, but once cleared, 205.00 is well within range and aligns with major Fibonacci extensions.
GBPJPY is also benefiting from increased volatility in risk-on sentiment, as equity markets remain firm and bond yields rise globally. Traders are favoring high-yielding currencies like GBP while shorting low-yielders like JPY. With the fundamentals and technicals now strongly aligned, this trade is well-positioned to deliver continued profits toward 205.00 and beyond.
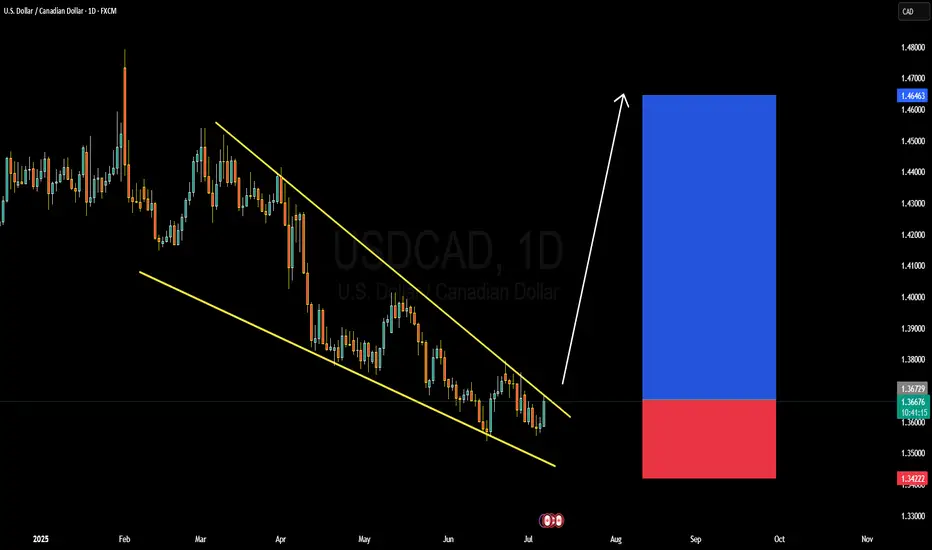
USDCAD BULLISH OR BEARISH DETAILED ANALYSISUSDCAD has just completed a clean falling wedge breakout—a classic bullish reversal pattern often signaling trend exhaustion. After months of consistent lower highs and lower lows within a well-defined wedge, price has now broken decisively above the descending resistance. The current price sits around 1.367, and we are confidently targeting the 1.407 level in the coming weeks. This breakout aligns perfectly with the seasonal USD strength historically seen in Q3, especially following soft Canadian economic data.
From a fundamental perspective, the Canadian dollar is facing downside pressure amid falling crude oil prices and softening domestic data. Canada’s most recent GDP growth came in below expectations, raising concerns around economic resilience. Meanwhile, the Bank of Canada is expected to remain dovish with growing speculation of another rate cut in the next quarter. In contrast, the US dollar has been gaining traction following stronger-than-expected ISM services data and a better-than-anticipated ADP employment report, supporting the Fed’s “higher for longer” stance on interest rates.
Technically, the breakout is further supported by increasing bullish momentum and a break of market structure on lower timeframes. We’re seeing volume confirmation with this push, adding conviction that buyers are stepping in with strength. The risk-to-reward ratio remains highly favorable here, and any pullback into the 1.36 zone would provide an excellent re-entry opportunity for continuation.
With sentiment shifting in favor of USD bulls and oil-related weakness dragging CAD, USDCAD looks primed for a rally. The 1.407 target aligns with both key resistance levels and Fibonacci projections from the breakout structure. Momentum is with the bulls, and this setup has the potential to deliver solid profits as we head deeper into Q3.
US
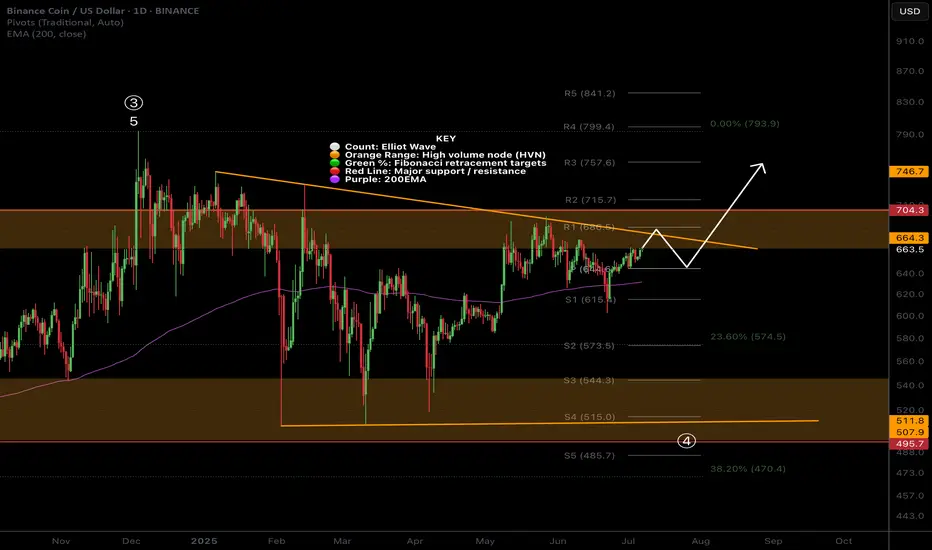
BNB Stuck in Barrier Triangle?CRYPTOCAP:BNB appears to be in a macro wave 4 barrier triangle, and for some time.
It has held up particularly well during the alt coin massacre, not even reaching the .382 Fibonacci retracement.
Price is testing the upper boundary for the 4th time, that starts to give us the higher probability breakout which increases with each test. The daily 200EMA and pivot were tested as support successfully.
Safe trading.
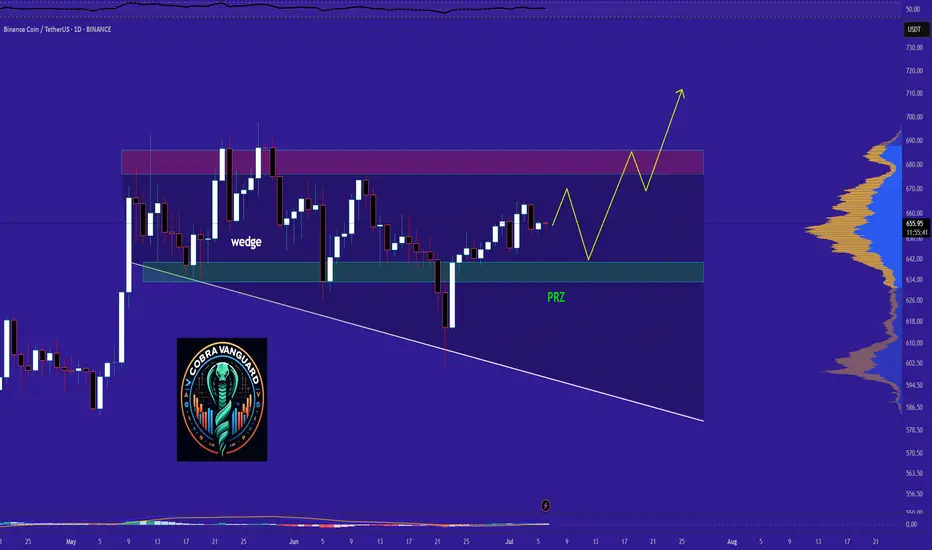
BNB Ready for PUMP or what ?The price could drop to the PRZ range and then rise toward the wedge's ceiling. If the wedge breaks, higher prices are not out of the question.
Best regards CobraVanguard.💚
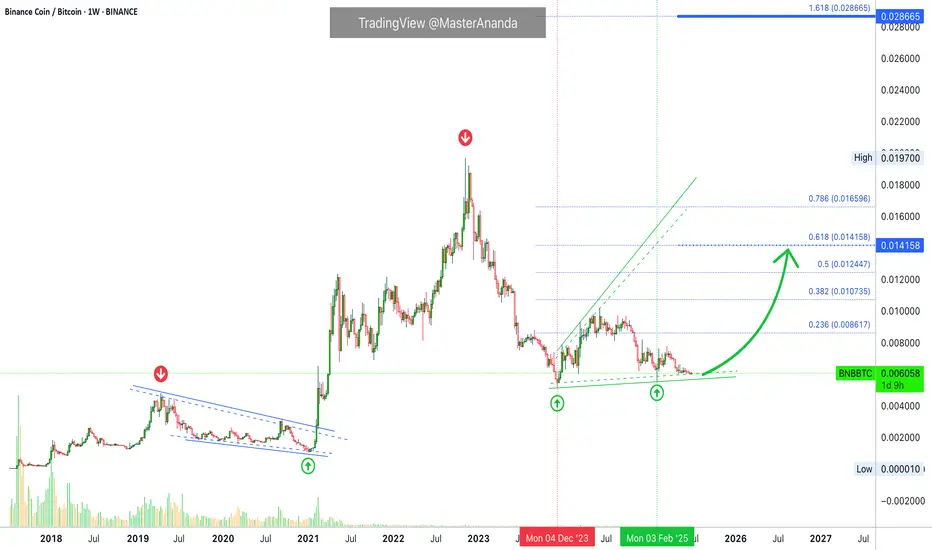
BNBBTC (Binance Coin vs Bitcoin) New All-Time High & 2026 BullI've been looking at Binance Coin vs Bitcoin and this chart has some pretty interesting dynamics, quite unique I should say. This can be a great opportunity for what is about to happen.
In the last bull market BNBBTC produced massive growth, the most interesting part is the fact that it continued to grow even during the bear market. Not that it lacked during the bull market and then grew during the bear market, but it grew strongly in early 2021 and continued to grow through 2022 while everything was going down. BNBBTC peaked only in November 2022 when Bitcoin hit bottom.
If we get some similar dynamics in this cycle, we can imagine BNBBTC starting to grow now, together with the rest of the market. When the bull market ends, all-time high, Bitcoin is going to 1M+ etc., then BNBBTC continues growing as the bear market unravels. This is because people tend to use BNB to store value and also because trading, market activity and engagement shoots up after the bullish cycle is over. Everybody, their mothers and cousins become professional traders and gamble everything away. This process can take an entire year... When all the money that was earned through the bull market is lost, then we get the bear market bottom and the cycle repeats.
At this point many people will be selling and giving up, but that would only be the start. November 2022 vs November 2026. Ok... That is too far away, let's focus on this present day.
Binance Coin vs Bitcoin, BNBBTC, produced a major low December 2023 and a higher low February 2025. December 2023 marked the end of the bear market for this pair. February 2025 confirms the bearish wave is over; the downtrend is no more.
We have a transition period, consolidation for more than a year. From the bottom we grow.
I am expecting a new all-time high on this pair and this is an easy guess. The only danger Binance was facing came from the previous administration, before Trump. Now that the Cryptocurrency hating crowd is gone, we can aim to the top and beyond. There is no limit to how far up anything Crypto can go. Truly... This is only the start...
It is still early
Notice how some pairs are really high and very advanced on their bullish cycle. Notice how other pairs are still trading at bottom prices. Pairs like this one can be approached easily, with low risk with 5X focused on the long-term. Very low risk with a high potential for reward... Never chase a rising wave. It is better to look for one that is yet to start.
Imagine if you were surfing. Would you be able to join a wave that is already pretty advanced? It can end your life. But if you glide patiently on your board looking around to catch a newly developing wave... It would be an awesome ride and your enjoyment is secure, guaranteed and safe. Catch the early wave.
There are endless opportunities in this market.
Your continued support is appreciated.
Crypto is the future of finance.
Crypto is the evolution of the Internet.
.....
Oh and by the way, the same dynamic I mentioned here between 2021 and 2022, also happened in 2018-2019. This means that there is high probability that BNBBTC will continue growing beyond the 2025 bull market. It is likely to grow during the bear market as well.
There are always several pairs that are used as a hedge. Finding those ahead of time can make a huge difference on how strong your portfolio remains during the bear market. I will be recommending selling though but not 100%. We will be selling around 60-70% and the rest we keep invested regardless of what happens. We are Crypto, we love Crypto and we support he market.
Namaste.
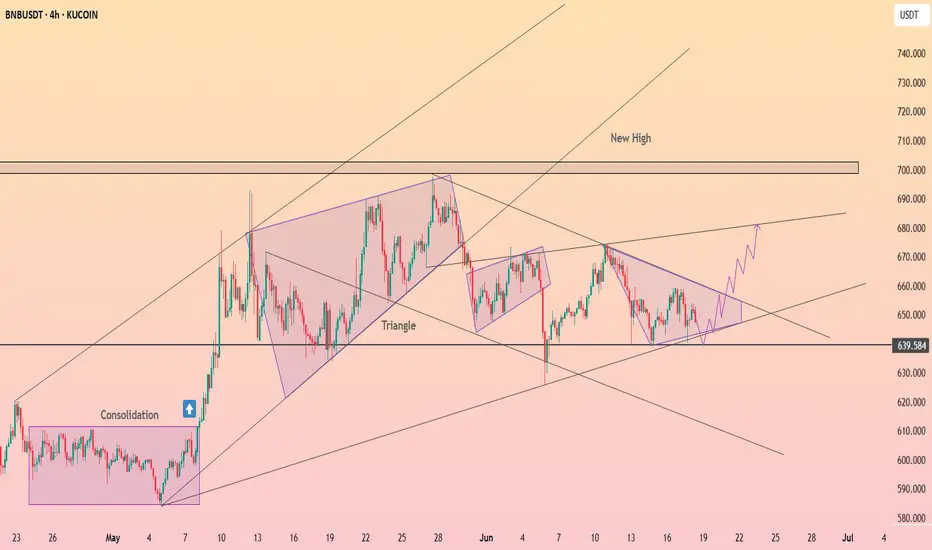
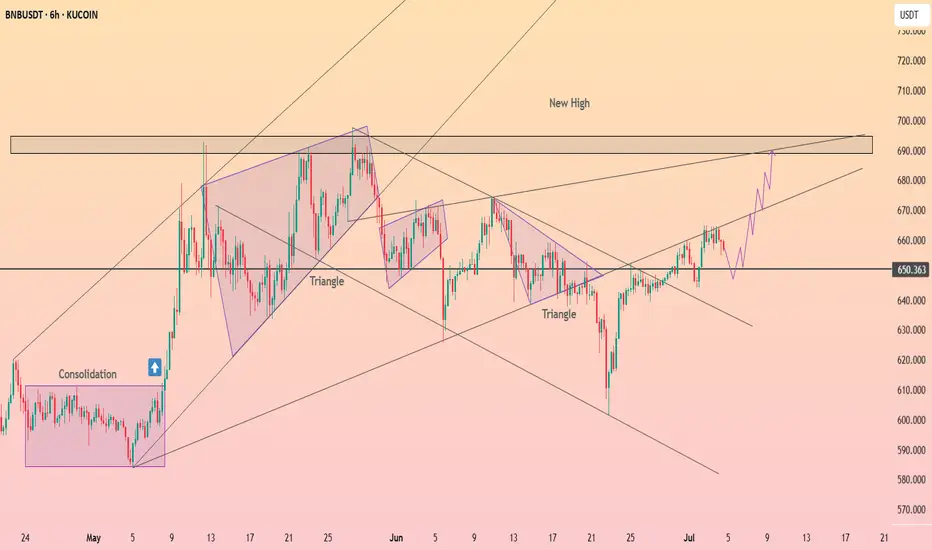
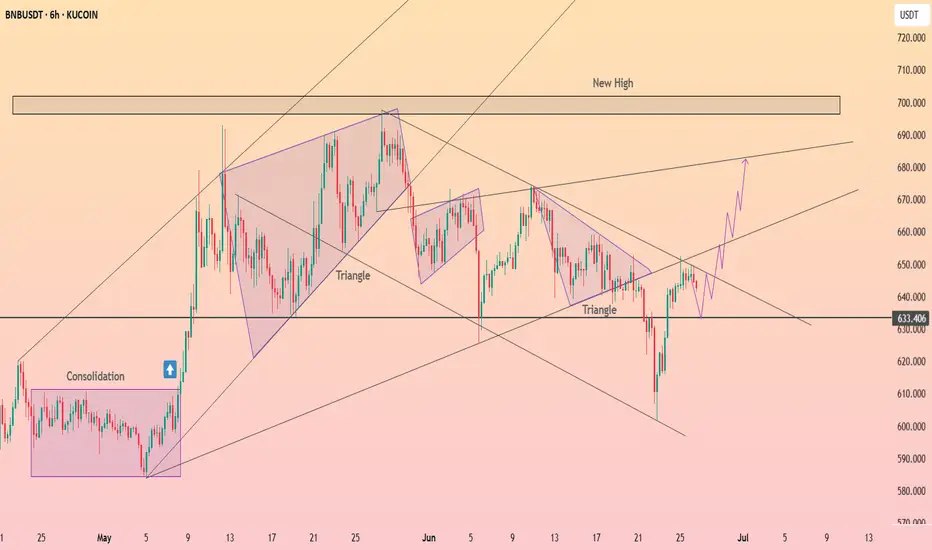
HolderStat┆BNBUSD consolidated above the $650 levelKUCOIN:BNBUSDT is holding firm above 650 after breaking through a symmetrical triangle. The price structure is supporting a bullish continuation toward the upper resistance zone at 690–700. A clear uptrend is forming with tight consolidation along support, hinting at a breakout move.
BNB/USD (4h interval)🔍 1. Chart structure
Instrument: Binance Coin / USD (BNB/USD)
Interval: 4 hours
📐 2. Technical formations
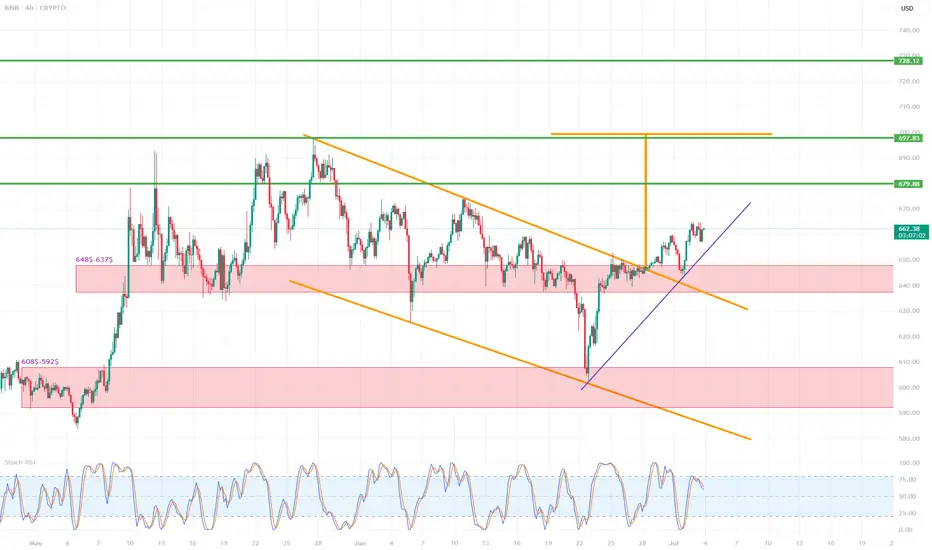
🔸 Breakout from the descending wedge formation
The descending wedge (orange lines) is a bullish formation - it suggests a potential breakout upwards.
The breakout occurred dynamically, with a large breakout candle (confirmation of the formation).
The goal of breaking out of the wedge is usually the height of the entire formation - this is marked with an orange arrow.
📈 Breakout range (target): around $697–710
🟢 Potential next targets:
697.83 (local resistance/projection result)
710.73 (main wedge height projection)
728.12 (strong resistance from history)
📊 3. Supports and resistances
🟥 Support zones (red rectangles):
$648.5–637.5 – previous resistance, now tested as support after the breakout.
$608.5–592.5 – strong support from previous lows.
🔼 Currently, the price has tested the upper support zone (648–637), reacted positively and continues to move up.
🟩 Resistance levels (green horizontal lines):
679.88 USD – local resistance, first target after breaking out of the wedge.
697.83 USD – projected range from the formation.
710.73 USD – full technical range of the breakout.
728.12 USD – strong resistance from history, may be a long-term target.
📉 4. Trends and support lines
Purple upward trend line – currently the price is above, which confirms the short-term upward trend.
Its break may lead to a retest of 648–637 USD.
Only below this zone can a larger correction be considered.
📈 5. Stochastic RSI indicator
Currently in the overbought zone (above 80).
Possible temporary cooling – signal for local correction / consolidation.
It is worth waiting for the indicator to go down to around 20 to re-enter the long.
✅ 6. Scenarios
🔼 Bullish (base) scenario:
Staying above 648–637 USD.
Maintaining the uptrend line.
Continuation to 679.88 → 697.83 → 710.73.
🔽 Bearish scenario:
Breaking the purple trend line.
Returning below 648 USD → going down to the 608–592 zone.
Negation of the breakout from the wedge.
📌 Final conclusions
Breaking out from the descending wedge is a strong pro-growth signal.
The price behaves in accordance with technical analysis, testing the previous resistance as support.
Currently, the retest and consolidation phase is underway – maintaining the trend line and the level of $648 will be key.
The medium-term target is $697–710.
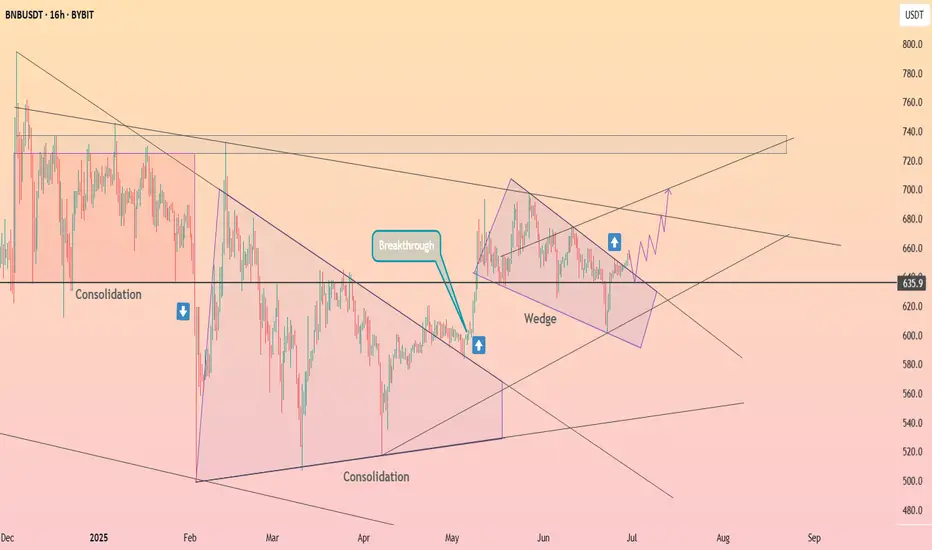
HolderStat┆BNBUSD came out of the wedgeBINANCE:BNBUSDT just cleared a multi-week wedge resistance, signaling a bullish breakout above $635. The price is now poised to retest the upper channel boundary near $700–730. If bulls maintain momentum, this breakout could mirror prior impulsive legs higher, especially following similar consolidation patterns earlier this year.
BNB Price Today: Downtrend Ends As Bullish Momentum Strengthens
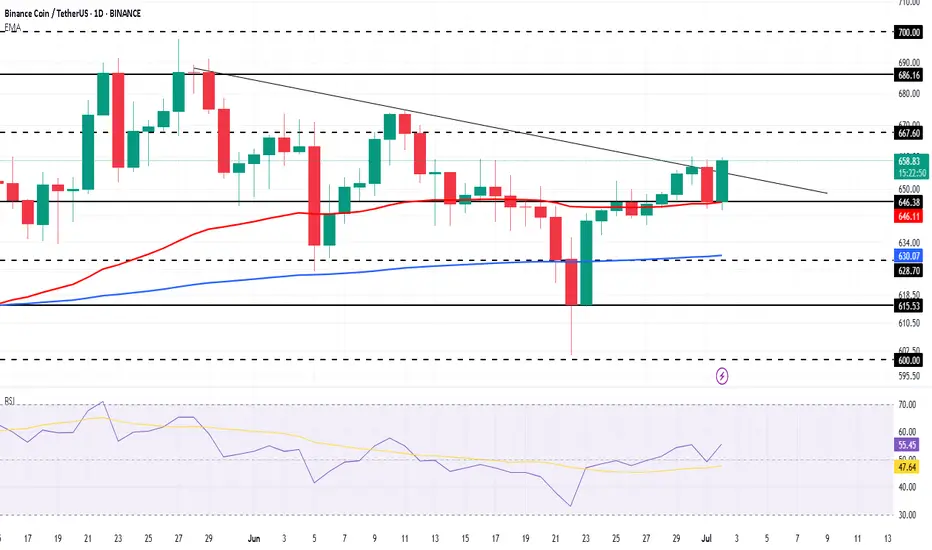
BNB is currently priced at $658 , showing resilience despite market volatility. However, it’s facing a micro downtrend this month. The positioning of the exponential moving averages (EMAs) below the candlestick indicates a potential bullish trend.
This pattern suggests that if BNB can maintain its current price, there could be an upward movement, making it a favorable outlook for investors despite the ongoing market uncertainty.
For BNB to regain bullish momentum, breaking free from the downtrend is key. A bounce off $646 support could help BNB target $667 , which has proven difficult since May.
The RSI remains above neutral, signaling growing buying pressure that could fuel the uptrend. A successful breach of $667 into support would confirm a more optimistic outlook for the coin.
If market conditions worsen, BNB risks dropping below the $646 support . In this scenario, the next levels of support at $628 and $615 would be tested.
A break below these levels could invalidate the bullish outlook, leading to further declines. Investors should stay alert to shifts in broader market sentiment.
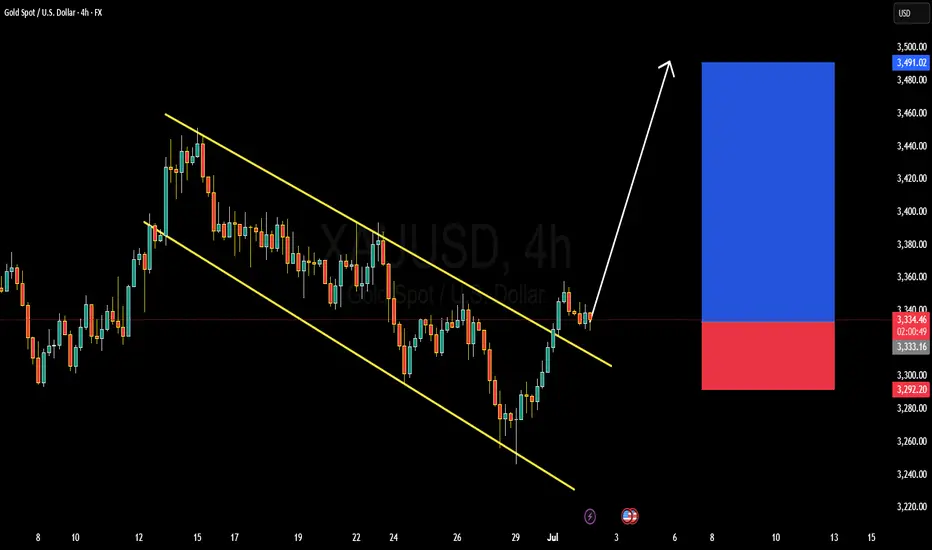
XAUUSD BULLISH OR BEARISH DETAILED ANALYSISXAUUSD has officially broken out of a well-structured descending channel on the 4H timeframe, suggesting a potential shift in market sentiment from bearish to bullish. After multiple rejections from the lower boundary and consistent pressure on the upper trendline, the breakout above the channel confirms a strong upside bias. Price is currently holding near 3330, and I’m now eyeing 3450 as the next key resistance level. This setup aligns perfectly with a textbook channel breakout, offering a solid risk-to-reward scenario for bullish continuation.
The breakout comes at a time when macro fundamentals are supportive of gold strength. With rising uncertainty surrounding global inflation trends and mixed economic signals from the US, investors are leaning back into gold as a defensive hedge. The US dollar has shown signs of softening amid increasing speculation that the Fed could pivot to a more neutral stance in the coming months. This gives gold more breathing room to the upside, especially as real yields begin to flatten out.
Geopolitical tensions, especially renewed volatility around global trade and Middle East developments, are further fueling demand for safe-haven assets like XAUUSD. The recent breakout is backed by rising volume and momentum indicators turning bullish, making this move more sustainable than a short-term spike. Gold typically thrives during periods of uncertainty and shifting rate expectations, and that’s exactly the phase we are entering now.
From a technical and macroeconomic perspective, gold is showing strength just as the broader markets begin to wobble. This breakout isn’t just about structure—it’s supported by real macro catalysts and seasonal demand strength. I'm bullish toward the 3450 zone, and any retest of the broken channel resistance now turned support would offer an attractive entry. Staying focused on gold as a top performer in Q3 could offer strong upside with controlled risk.
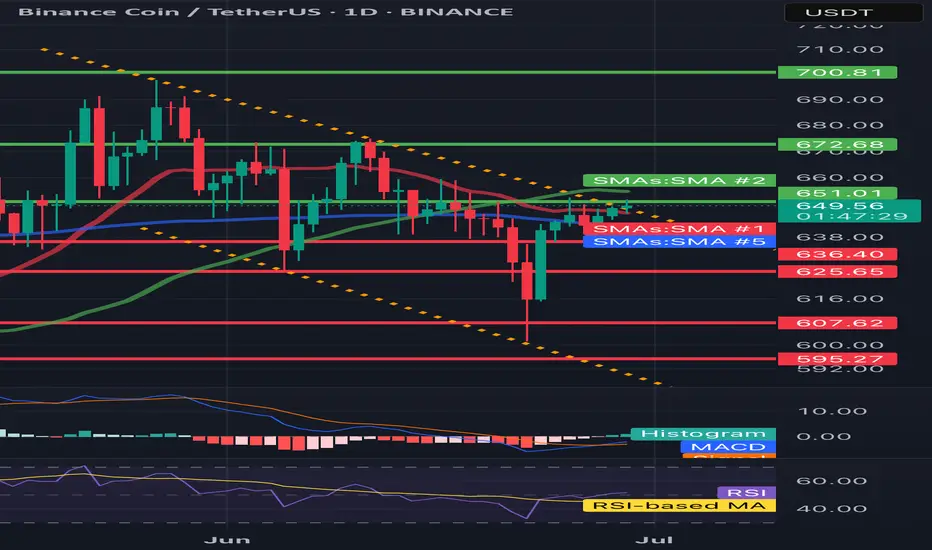
BNB/USDT 1D🕵️♂️ General context
• Steam: BNB/USDT
• Price: 649.52 USDT
• Time: 1D (daily interval)
• Currently, the reflection is underway after the inheritance, but the technical situation remains uncertain.
⸻
📈 Trend and market structure
• You can see a previous strong drop (visible long red candles).
• Currently, reflection is underway to the level of technical resistance (approx. 650–672 USDT).
• A medium -term inheritance trend is still in force - marked with an orange interrupted line of decreasing (inheritance) trend.
⸻
📊 Technical levels
🔹 Opora (green levels):
1. 651.01 USDT - the first tested resistance (current price right next to it).
2. 672.68 USDT - another resistance, above SMA (2), historically strong level of sales.
3. 700.81 USDT - strong psychological and technical level, tested in the past.
🔻 Support (red levels):
1. 636.40 USDT - short -term support (price maintaining just above this level).
2. 625.65 USDT - key support - if it is broken, a possible test of lower levels.
3. 607.62 and 595.27 USDT - subsequent support, where purchases appeared earlier (Long Knoty).
⸻
📉 Technical indicators
🔵 MacD
• Histogram comes out of red - a potential signal of Momentum change to upward.
• The MacD line begins to turn up to the signal line - possible Bullly Crossover soon (buy signal).
🟣 RSI
• RSI oscillates around line 40-50-it is a neutral zone with a slight tilt down, but RSI-Based has a possible reflection.
• Lack of purchase or sale - suggests that traffic can go both ways.
⸻
🔃 Medium walking (SMAS)
• The price is tested by several medium (green, red, blue line):
• SMA (1) and SMA (5) are similar and flat - no clear short -term trend.
• SMA (2) acts as a strong resistance at 672 USDT.
• Need to break out over 672.68 to recognize that the trend can turn around.
⸻
✅ Applications - technical scenarios
🔼 Bullish (upward) scenario:
• Crossing the level 651–672 USDT and closing the daily candle above.
• Confirmation by RSI> 50 and MacD crossover.
• Target: 700–710 USDT.
🔽 Bearish (inheritance) scenario:
• Price rejection with current resistance and descent below 636 → 625 USDT.
• If 625 falls, a possible drop in around 607/595 USDT.
• RSI may then fall into the sale zone.
⸻
🧠 Neutral / swing strategy
• Currently, the market in potential consolidation between 625 and 672 USDT.
• You can consider:
• Buying at the lower consolidation limit (625–636) with a stop-loss below 620.
• Short or Take Profit at the upper limit (670+) until it breaks out.
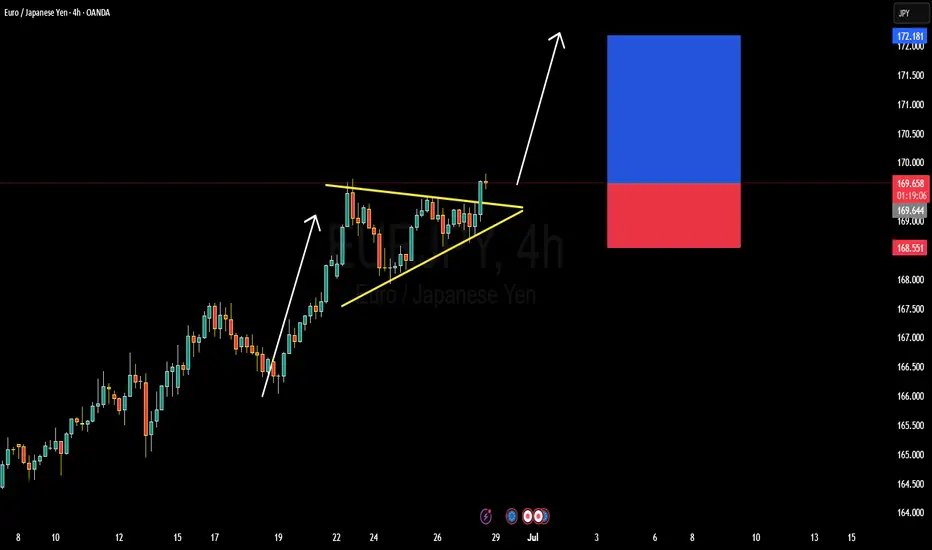
EURJPY BULLISH OR BEARISH DETAILED ANALYSISEURJPY has just broken out of a well-defined bullish pennant pattern on the 4H timeframe, confirming strong continuation potential to the upside. The price is currently hovering around 169.60 after consolidating in a tight structure, respecting both dynamic trendline support and horizontal resistance. This breakout signals renewed bullish momentum, and I'm now targeting the 172.10 zone as the next significant resistance level. The structure is clean, volume supported the breakout, and price action is aligned with the dominant uptrend.
Despite a relatively quiet start to the week—largely influenced by global risk-off sentiment surrounding Middle East tensions—EURJPY has held firm. Now that geopolitical jitters are easing slightly, yen weakness is resurfacing. The Bank of Japan remains firmly dovish, maintaining ultra-loose policy, while the Euro is supported by hawkish commentary from the ECB as inflation in the eurozone remains sticky. This divergence continues to fuel the long-term bullish bias for EURJPY.
Fundamentally, Japanese economic indicators remain soft, and there's still no clarity on when the BoJ will meaningfully shift policy. Meanwhile, EUR zone confidence indicators have stabilized, and speculation is growing around the ECB holding rates higher for longer into Q3. With widening yield differentials and a favorable risk sentiment return, this pair is positioned well for upside movement. Current momentum supports the probability of reaching the 172.00–172.10 area as risk appetite rebuilds across markets.
Technically and fundamentally aligned, EURJPY offers one of the strongest bullish continuation opportunities on the board right now. I will continue to monitor for minor dips as potential add-on areas, aiming for a full extension of the measured move from the pennant formation. Patience pays in setups like this where structure, sentiment, and macro all align.
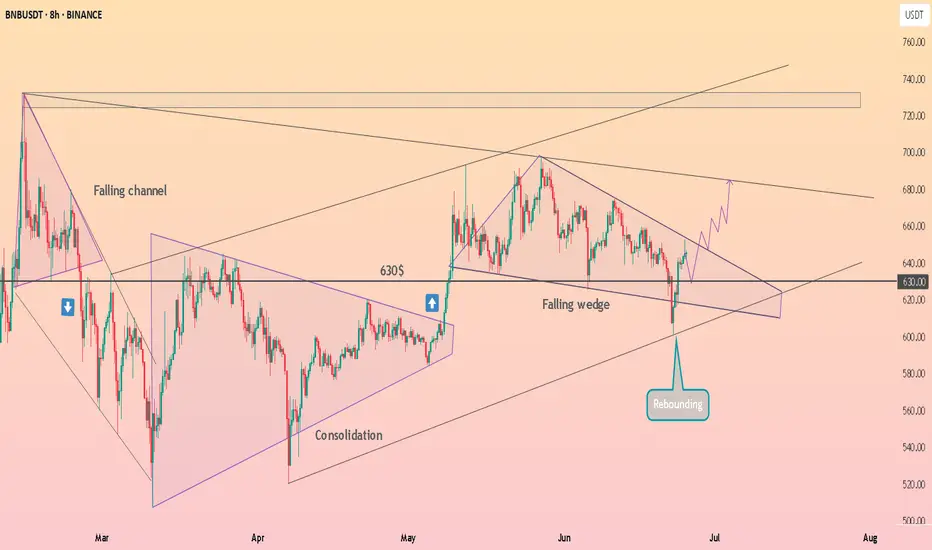
HolderStat┆BNBUSD forming the falling wedgeBINANCE:BNBUSDT on the 8h chart rebounded from a falling wedge and reclaimed the $630 support. Price structure shows growing strength as it aims for $680 next. Watch for a breakout confirmation to ignite a push toward $740.
HolderStat┆BNBUSD retest of the channelBINANCE:BNBUSDT has completed a bullish reversal from the 633.4 level and is now testing upper trend resistance. A breakout from this wedge structure may lead to a rapid move toward the 680–700 region. Past triangle patterns have preceded strong rallies, and momentum indicators favor bulls. Traders will look for a breakout above 650 to confirm.
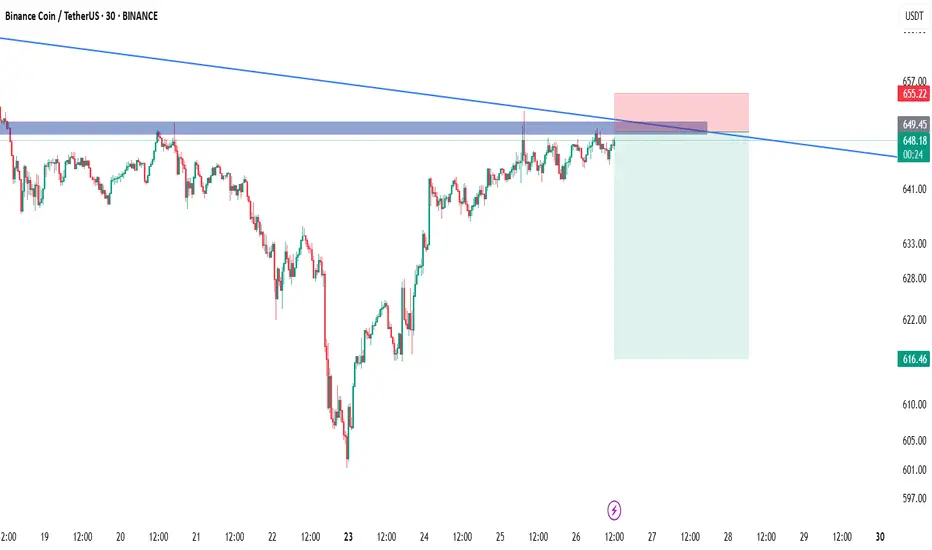
BNBUSDTPersonally, I see BNB struggling to break above that key resistance zone near 648–649. The rejection from that level, especially with decreasing momentum, makes me lean bearish in the short term. We’ve seen this zone hold back price before, and unless there's a strong breakout with volume, I think there's a higher chance we see a pullback toward the 616–618 area. I’m just watching price action closely and waiting for a clean confirmation—no need to rush a position when the structure’s already signaling hesitation.
NZDJPY TECHNICAL AND FUNDAMENTALS DETAILED ANALYSISNZDJPY has just completed a bullish breakout from a well-defined symmetrical triangle on the 4H chart, confirming the start of a fresh impulsive move. Price action has broken cleanly above the descending trendline resistance around 87.400, supported by consecutive bullish candles with momentum. This breakout structure is signaling trend continuation, and I’m now targeting 89.500 as the next key resistance zone. The pair has also held higher lows consistently, showing strong bullish pressure in the medium term.
Fundamentally, the New Zealand Dollar remains supported by the Reserve Bank of New Zealand’s persistent hawkish stance. With the RBNZ maintaining higher interest rates to combat sticky domestic inflation, NZD has found strong backing in recent sessions. On the other hand, the Japanese Yen continues to weaken across the board, with the Bank of Japan maintaining ultra-loose monetary policy and no real signals of tightening. Japan’s latest inflation reading came in weaker than expected, further dimming any hawkish BOJ bets.
Today’s sentiment also reflects a global risk-on environment, with equities up and commodity-linked currencies like NZD benefiting. This reinforces bullish momentum in NZDJPY, especially as yield differentials between New Zealand and Japan favor carry trades. Technically, the pair could see brief pullbacks toward 87.100–86.900, which may offer fresh entries for bulls aiming to ride the breakout wave toward 89.500.
With technical confirmation, bullish momentum, and a supportive macro backdrop, NZDJPY looks well-positioned for further upside. I’ll be watching for sustained price action above the breakout zone, and any dips will be viewed as buying opportunities. The trend is up, and momentum is real—this is a textbook breakout setup aligned with both fundamentals and price action.

BNB Analysis (Crypto)Here is my analysis on BNB, the native token of Binance. I'll be using ICT concepts, primarily liquidity, efficiency, PD Arrays, and premium/discount/OTE.
Hope you find it insightful in knowing where price is going to go!
- R2F Trading

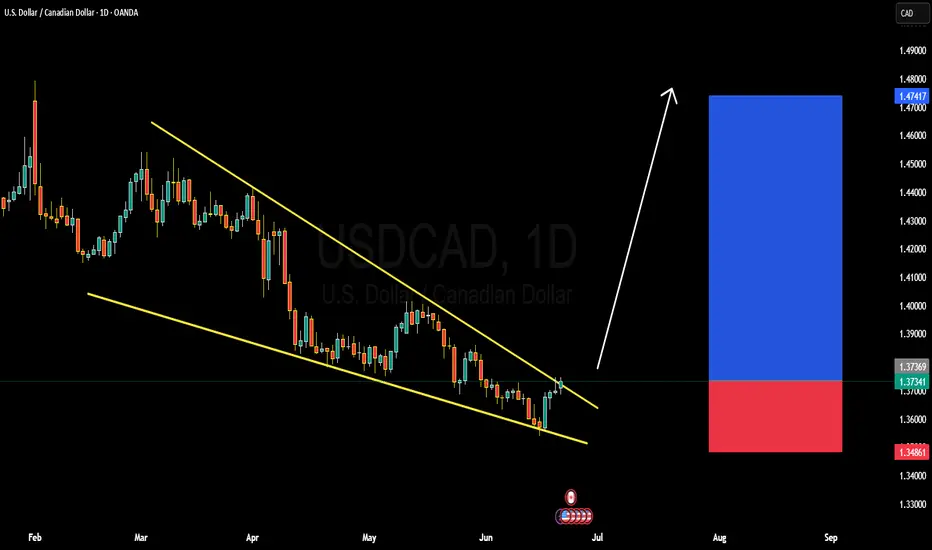
USDCAD DETAILED ANALYSISUSDCAD has formed a classic falling wedge pattern on the daily timeframe, with price currently pressing against the upper trendline resistance near 1.37300. This is a high-probability bullish reversal setup, and the pair is showing early signs of a potential breakout. The recent bullish momentum from the lows suggests buyers are stepping in aggressively, and if we get a strong daily close above the wedge, it could confirm the start of a new upward leg. My near-term target for this breakout is 1.47300, offering an excellent risk-reward profile.
From a fundamental perspective, the Canadian Dollar is currently under pressure due to weakening oil prices and softening domestic economic data. The Bank of Canada has recently signaled a dovish tilt following its latest rate cut in June, citing slower GDP growth and easing inflation. On the other hand, the US Dollar is finding renewed strength backed by sticky inflation and the Fed’s cautious stance on rate cuts. The divergence in monetary policy between the Fed and BoC is creating a favorable environment for USDCAD bulls.
Technically, the confluence of wedge resistance, bullish divergence on the RSI, and a clear higher low formation all point toward a breakout scenario. A break above 1.37600–1.38000 would unlock the next wave of bullish continuation, potentially accelerating momentum toward the 1.47 handle. This area also aligns with the previous March highs, making it a strong technical magnet.
I remain bullish on USDCAD and will be watching the breakout closely this week. If the pair holds above 1.36800 and breaks structure convincingly, I’ll be adding to longs on confirmation. The current setup presents a textbook breakout opportunity supported by strong fundamentals, technical structure, and market sentiment leaning in favor of the USD.
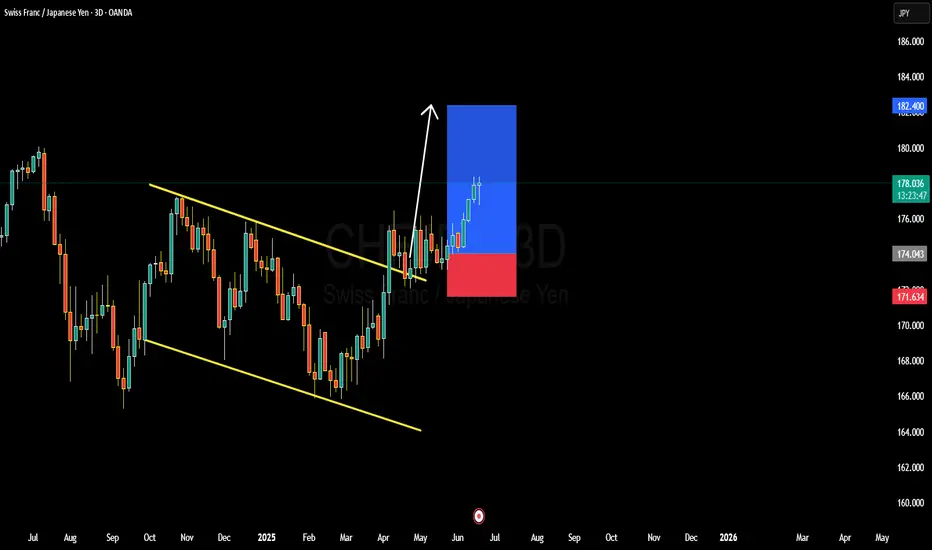
CHFJPY BULLISH OR BEARISH DETAILED ANALYSISCHFJPY has continued to play out exactly as forecasted, breaking out cleanly from the descending channel on the 3D timeframe and rallying strongly above key structure. Price is currently trading around 178.00, already delivering solid upside from the breakout zone. The bullish breakout was confirmed by consecutive impulsive candles with minimal retracement, a clear sign of institutional strength behind this move. As long as this momentum holds, the next major target is 182.00 – a psychological level and previous structure high, now acting as a magnetic zone for price.
On the fundamental side, the Swiss Franc continues to enjoy safe-haven flows as global macro uncertainty persists. The Swiss National Bank has maintained a relatively tight stance, with inflation staying stable and CHF demand picking up. On the flip side, the Japanese Yen remains broadly weak due to ultra-loose monetary policy from the Bank of Japan. BOJ’s reluctance to shift away from yield curve control and negative interest rates makes JPY one of the most attractive funding currencies, driving consistent CHFJPY upside.
Technically, this move is supported by a textbook breakout from a falling wedge pattern, which historically has a high probability of bullish continuation. The volume and momentum on the breakout were strong, and we have a clean higher high and higher low structure forming. This confirms the end of the correction phase and a transition into a trending bullish cycle. With the current risk sentiment leaning toward CHF strength and JPY weakness, I’m confident in further upside toward my 182.000 target.
I’ll continue to trail stops below 174.00 to lock in profit while giving the trade room to breathe. If price consolidates near 179.50–180.00 with low volume, I may look for re-entry setups on pullbacks. As of now, CHFJPY remains one of the strongest trending pairs on the board, and I’ll stay long as long as the structure holds.
HolderStat┆BNBUSD held supportKUCOIN:BNBUSDT keeps coiling inside a contracting wedge above the $639 launchpad. A 4-h close over 650-655 can spark a thrust to 680 and revive the 700–710 “new-high” box; slip-back under 630 delays the breakout but leaves the structure intact 🚀