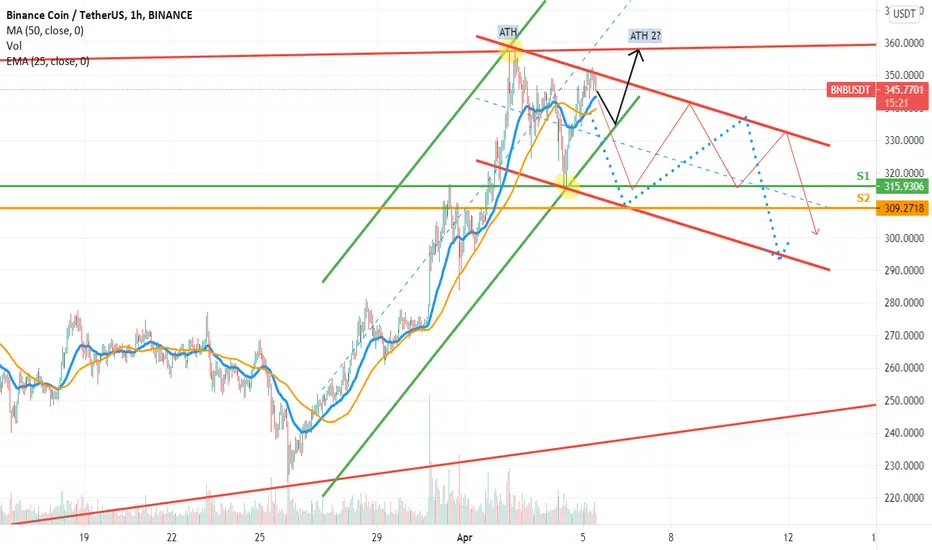
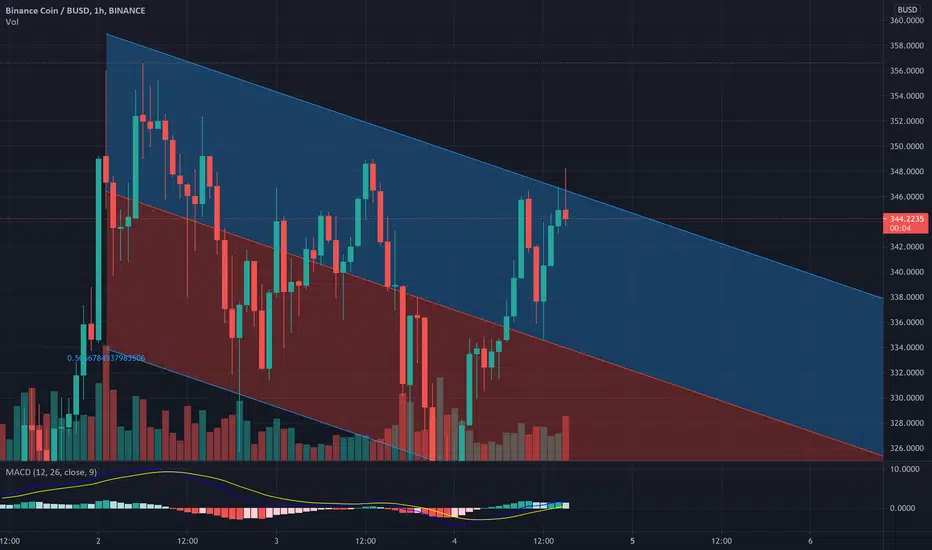
Is it time for BNB to rest after outstanding performance?BNB has been moving at an impressive speed over the past couple of weeks and it has touched its new ATH in April. BNB is moving in an upward parallel channel, however post touching its ATH it has not tried touching it again. Instead it has settled for 352, which indicates it might be heading for a downward trend.
However it is too early to say, if BNB is officially in a downward trend. It hasn't touched the other corner of its upward trend yet. So we will have to wait and watch if manages to break the Green parallel channel to officially enter the downward trend. After analysing all the trends, below are three potential scenarios.
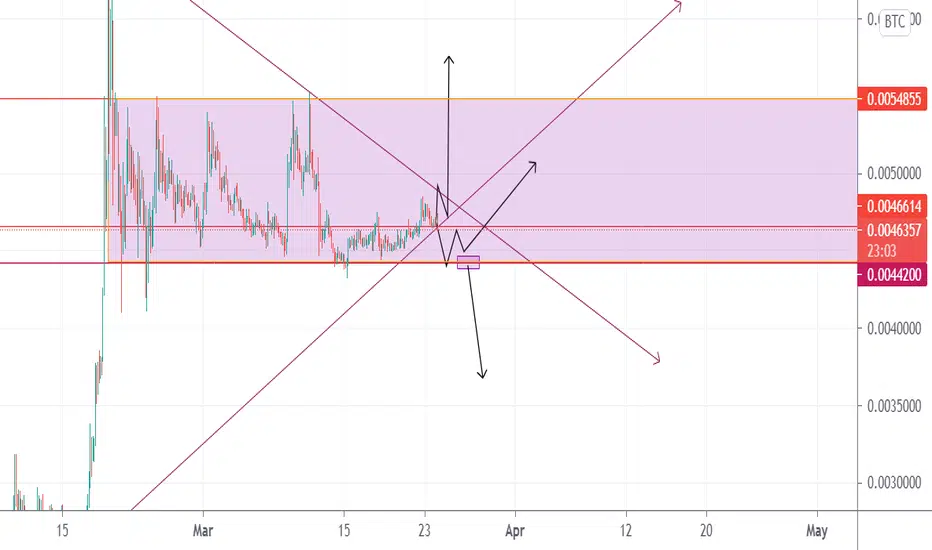
Scenario 1 (Black path) - BNB will bounce back from 330-337 range and can potentially try to create a new ATH. However if it is pulled back from its earlier ATH, then it can potentially form Double top pattern.
Scenario 2 (Red path) - BNB will break green upward trend and will officially enter the downward trend. However it will be supported by S1. In this case BNB will be moving in an descending triangle, which is again an indicator of further fall.
Scenario 3(Blue dotted path) - BNB will ignore all trends and will straight way follow the downward trend channel by initially taking support at S2.
If you like my analysis then do drop a LIKE and a COMMENT. Also do SHARE it with your friends.
Dont forget to click FOLLOW button to get daily analysis of different crypto currencies.
NOTE - These are my personal notes and in no way a financial advice. Do your own research and trade wisely
BNBBTC
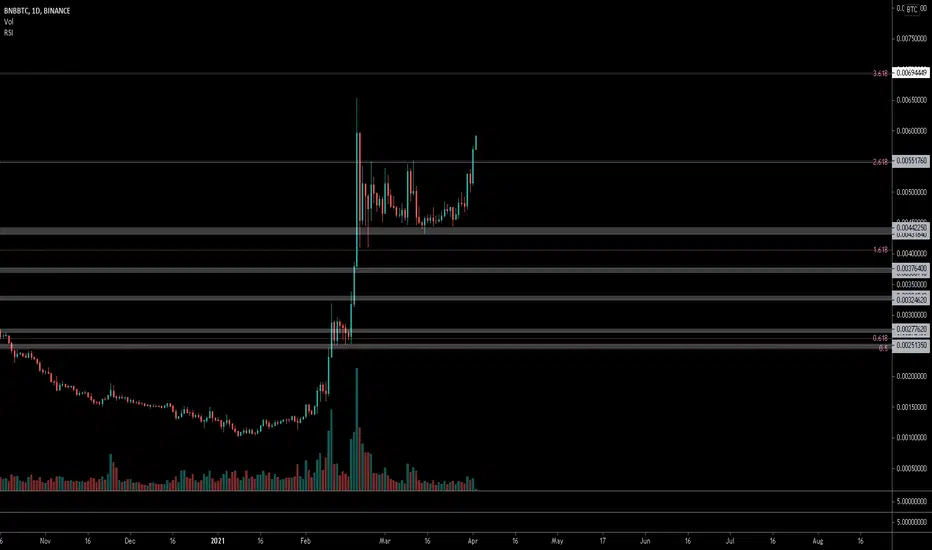
$BNB could lose momentum here, MACD reversingRSI is still around the overbought zone but volume is dropping
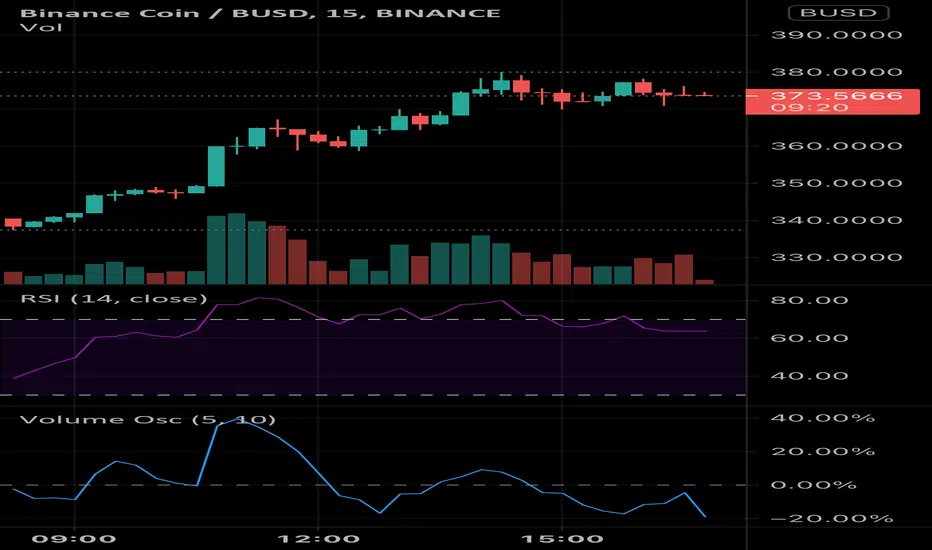
$BNB RSI entered overbought zone so #BNB may start falling soonAlthough it has reached an all-time high once again, the gains over the last couple of days are unsustainable

$BNB is falling sharply after failing breakout from channel #BNBWithout breaking out of this descending channel, Binance Coin will remain bearish
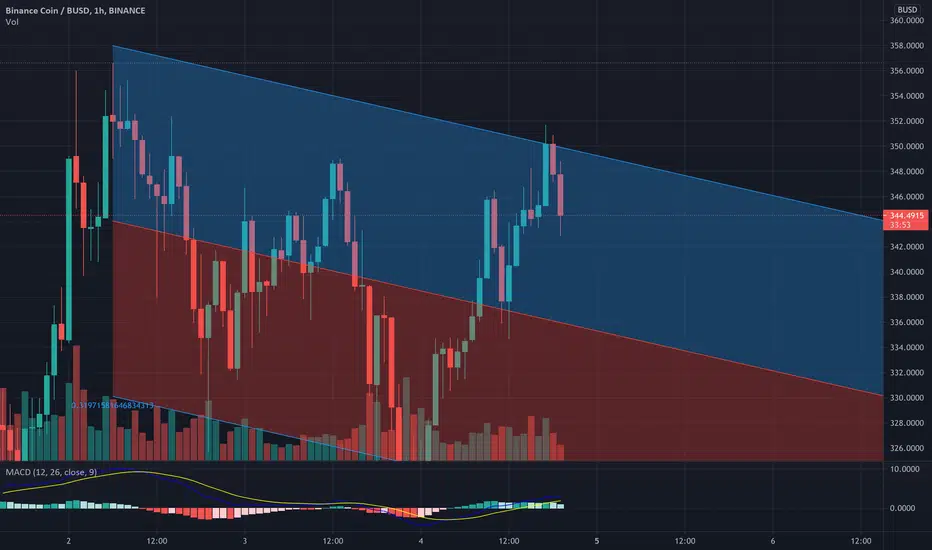
$BNB regression trend from ATH still bearish, breakout rejectedAlthough short term regression trends show upward momentum, Binance Coin is struggling to break out of a descending channel
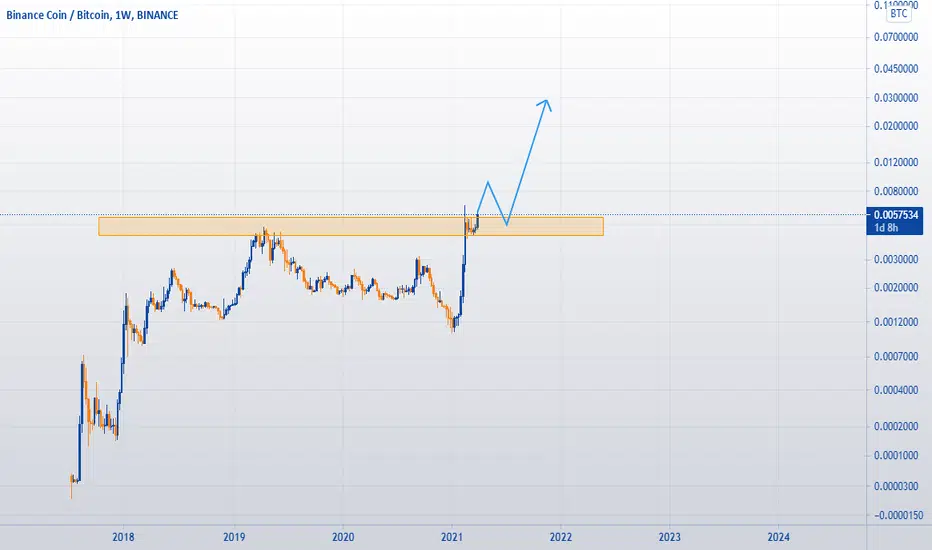
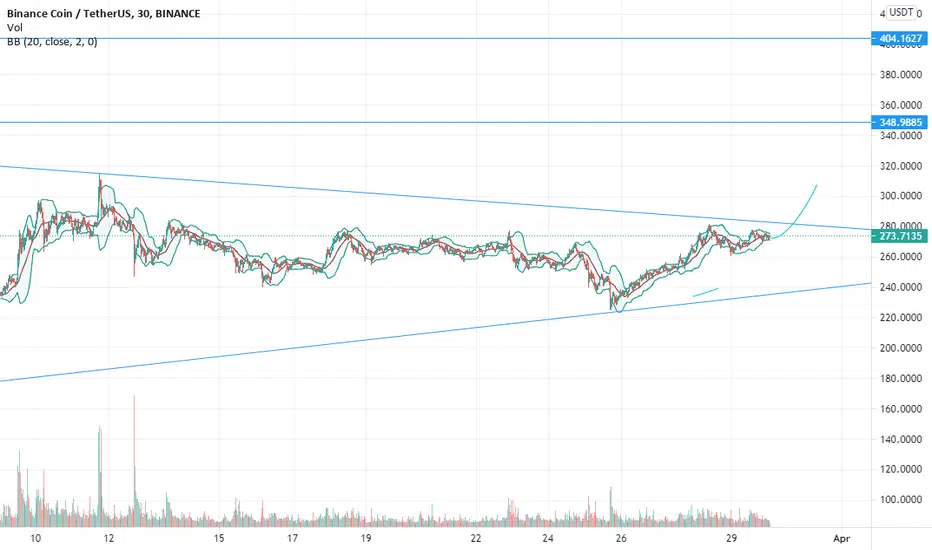
$BNB, Looking to restart the way up toward all time high$BNB
Breaking from the range it has been bouncing for the last 40+ days...
Looking to restart the way up toward all time high level & looking for a potential breakout into price discovery..
UCTS bullish across the board (1D turning buy once again)
#BNB
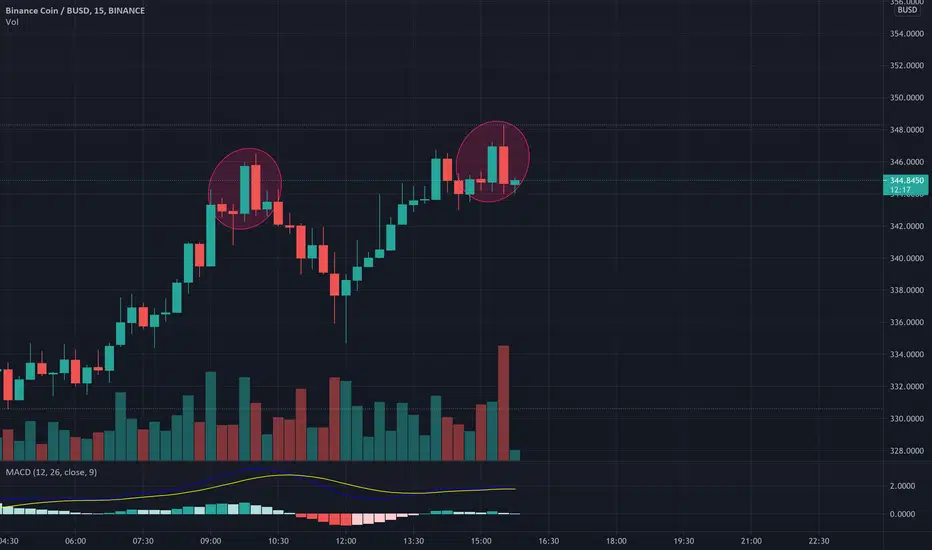
Binance Coin $BNB is failing to find support at $347 #BNBAs the current hourly candle closes in an inverted hammer shape, the value is likely to dip from here.
It may find support at 340, 335 or 330.


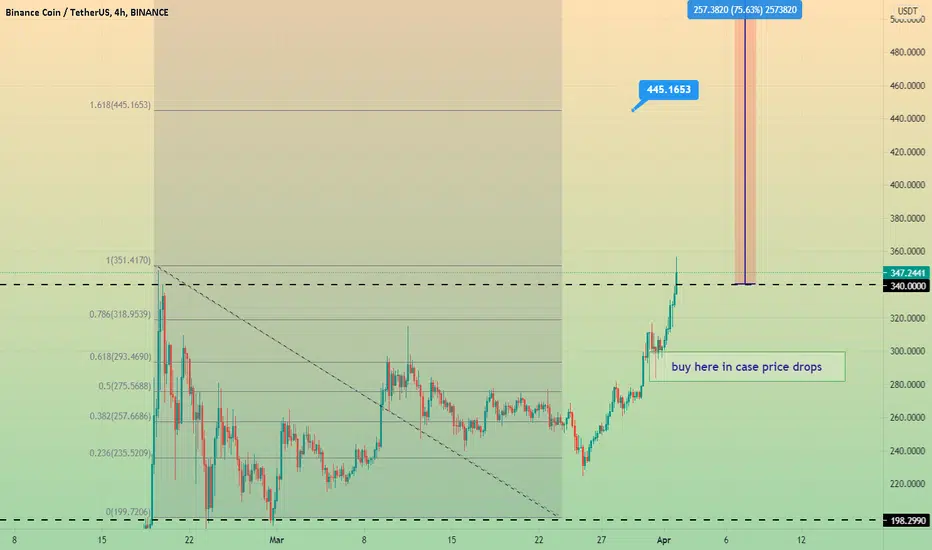
BNB +$1000 trip starts ... book your seatsIn all ways I think that BNB will exceed $1000 for 2021 , however we can say that it will begin in that case...
we need breakout as a 4hr candle close above the resistance $351 so we can predit $445 then $596
and in case price drops Fibonacci levels can guide strongly where to buy as per the chart below $293 is considered good entry
Please click Like button and Appreciate my hard work.
Must follow me for latest crypto real time updates.
Thank you.
BNB LONG ? Hello ;
BNB launches Lunch for New TKO Token. This process passes with the obligation to hold BNB for 7 days. One reason that generally supports this upward expectation is when it is checked on the chart. A rise up to the 410 band seems to be a perfectly normal expectation.
Merhaba ;
BNB Yeni TKO Token için Lunch başlattı . Bu süreç 7 gün boyunca elimizde BNB tutma zorunluluğu ile geçiyor . Bu yükseliş beklentisini genel olarak destekler bir gerekçe bunun yanında grafik üzerinden kontrol edildiğinde . 410 bandına kadar bir yükseliş tamamen normal bir beklenti olarak gözükmekte.

BNB: send it to the moon!Pennant has broken up.
Above the previous redistance
Please hit LIKE if you find this useful!

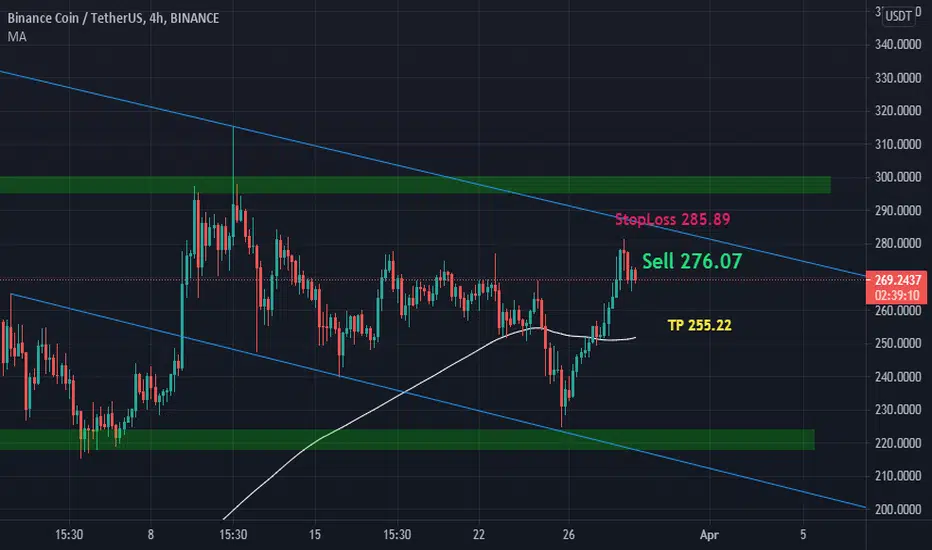
BINANCE COIN (BNBUSDT/BNBBTC) LONGPair BNBUSDT
Direction Long
Entry $302.6991
SL $295.2748
TP1 $305.2976
TP2 $307.5249
TP3 $309.3810
TP4 $311.6083
Signal Rating 2/5: new strategy

HoldHi
It has a good position and if it passes 295, it will probably reach its previous ceiling and we can see the price double in the medium term

Be ready to explode!So far everything is advanced according to my technical analysis.
I hope you have a heavy purchase
So enjoy

Binance Coin (BNB) - March 26Hello?
Dear traders, nice to meet you.
By "following" you can always get new information quickly.
Please also click "Like".
Have a good day.
-------------------------------------------------- -----
We have to see if we can get support in the 225.2330-252.2300 section.
In particular, we need to see if we can climb along the uptrend line and get out of the downtrend line.
If it falls at 171.2388, you need a Stop Loss to preserve your profit or loss.
If the CCI line falls below 100 on the CCI-RC indicator, volatility may occur, so careful trading is necessary.
(1M chart)
(1W chart)
-------------------------------------
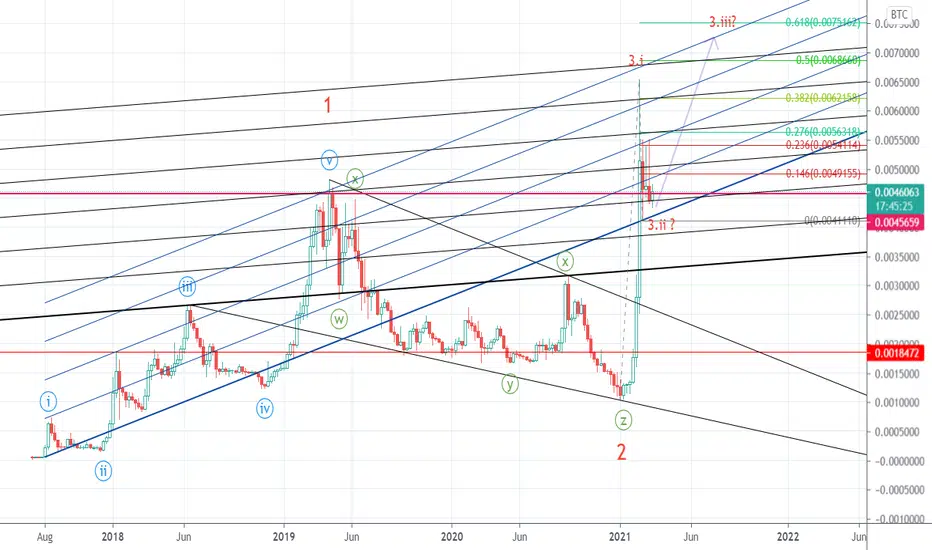
(BNBBTC 1D chart)
It remains to be seen if volatility around the 27th of March leads to a movement that deviates from the downtrend line.
In particular, we have to see if it can rise above the 0.0047326 point.
If it falls from the 0.0035029 point, a Stop Loss is required to preserve profit and loss.
-------------------------------------------------- -------------------------------------------
** All indicators are lagging indicators.
So, it's important to be aware that the indicator moves accordingly with the movement of price and volume.
Just for the sake of convenience, we are talking upside down for interpretation of the indicators.
** The wRSI_SR indicator is an indicator created by adding settings and options from the existing Stochastic RSI indicator.
Therefore, the interpretation is the same as the conventional stochastic RSI indicator. (K, D line -> R, S line)
** The OBV indicator was re-created by applying a formula to the DepthHouse Trading indicator, an indicator that oh92 disclosed. (Thank you for this.)
** Check support, resistance, and abbreviation points.
** Support or resistance is based on the closing price of the 1D chart.
** All explanations are for reference only and do not guarantee profit or loss on investment.
Explanation of abbreviations displayed on the chart
R: A point or section of resistance that requires a response to preserve profits
S-L: Stop Loss point or section
S: A point or segment that can be bought for profit generation as a support point or segment
(Short-term Stop Loss can be said to be a point where profits and losses can be preserved or additionally entered through installment transactions. It is a short-term investment perspective.)
GAP refers to the difference in prices that occurred when the stock market, CME, and BAKKT exchanges were closed because they do not trade 24 hours a day.
G1: Closing price when closed
G2: Cigar at the time of opening
(Example) Gap (G1-G2)

BNB stealing directly from ETH, do see what I seeI’ve mentioned that subject in previous ideas,
Not the first time I say that BNB is stealing the show!
Technical analysis not 100%
Beware of Ethereum updates,
As mentionned previously, the BinanceChain has a working product with low transaction fees and the market cap!
This is not financial advice,
Follow the money
9to5

Binance Coin (BNB) - March 21Hello?
Dear traders, nice to meet you.
By "following" you can always get new information quickly.
Please also click "Like".
Have a good day.
-------------------------------------------------- -----
We need to see if we can get support from the 225.233-252.23 section and get off the downtrend line.
We need to see if we can move off the downtrend line around March 25th-around April 2nd and climb along the uptrend line.
If you fall between 225.233-252.23, you need a short stop loss.
----------------------------------------
(BNBBTC 1D chart)
You should watch for any movement that deviates from the 0.0043227-0.0047326 segment.
If you go down at 0.0043227, you need a short stop loss.
It remains to be seen if it can break off the downtrend line around March 27-April 8 and rise above the 0.0047326 point.
-------------------------------------------------- -------------------------------------------
** All indicators are lagging indicators.
So, it's important to be aware that the indicator moves accordingly with the movement of price and volume.
Just for convenience, we are talking upside down for interpretation of the indicators.
** The wRSI_SR indicator is an indicator created by adding settings and options from the existing Stochastic RSI indicator.
Therefore, the interpretation is the same as the conventional stochastic RSI indicator. (K, D line -> R, S line)
** The OBV indicator was re-created by applying a formula to the DepthHouse Trading indicator, an indicator published by oh92. (Thank you for this.)
** Check support, resistance, and abbreviation points.
** Support or resistance is based on the closing price of the 1D chart.
** All explanations are for reference only and do not guarantee profit or loss on investment.
Explanation of abbreviations displayed on the chart
R: A point or section of resistance that requires a response to preserve profits
S-L: Stop Loss point or section
S: A point or segment that can be bought for profit generation as a support point or segment
(Short-term Stop Loss can be said to be a point where profit or loss can be preserved or additionally entered through installment transactions. It is a short-term investment perspective.)
GAP refers to the difference in prices that occurred when the stock market, CME, and BAKKT exchanges were closed because they do not trade 24 hours a day.
G1: Closing price when closed
G2: Cigar at the time of opening
(Example) Gap (G1-G2)
