Bnbusdtbuy
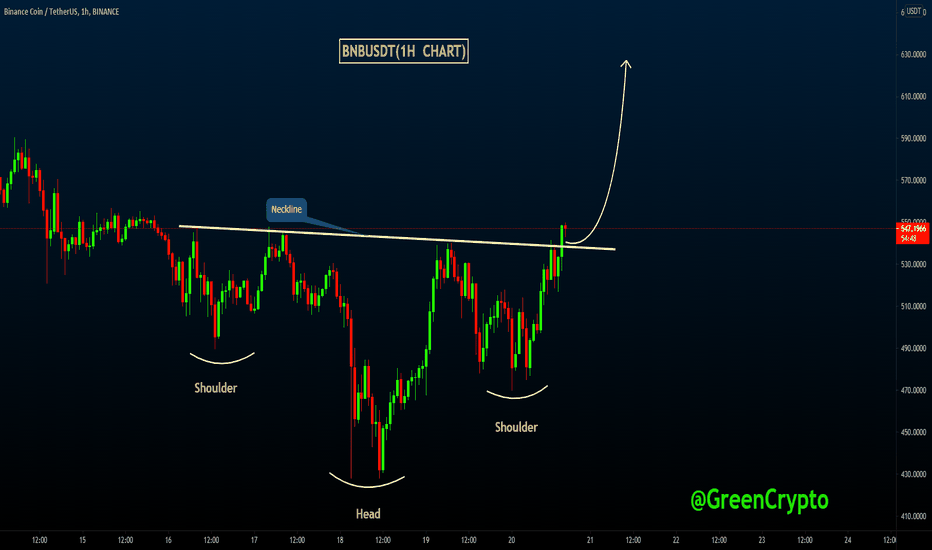
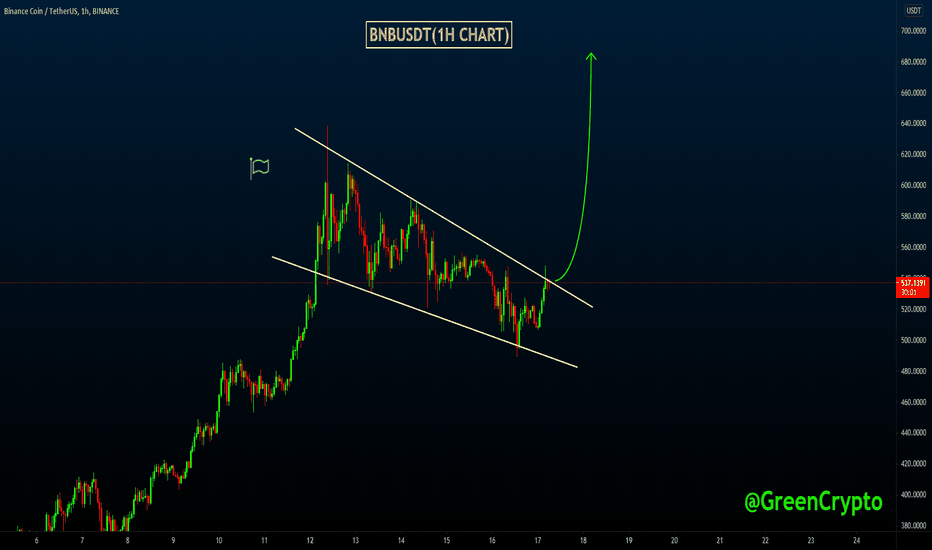
BNBUSDT Inverse Head and ShoulderBNBUSDT (1H Chart) Technical Analysis Update
Inverse Head and Shoulder
BNB/USDT currently trading at $544
Buy-level: $538- $545
Stop loss: $508
Target 1: $571
Target 2: $590
Target 3: $610
Max Leverage: 3X
ALWAYS KEEP STOP LOSS...
Follow Our Tradingview Account for More Technical Analysis Updates, | Like, Share and Comment Your thoughts.
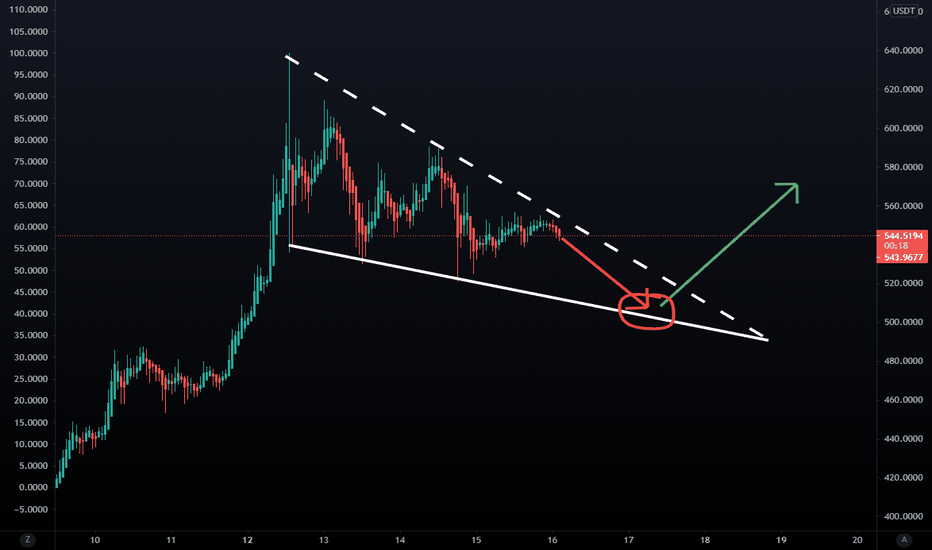
BNBUSDT Next Target!BNBUSDT (1H Chart) Technical Analysis Update
BNB/USDT currently trading at $536
Buy-level: Above $550
Stop loss: $503
Target 1: $580
Target 2: $610
Target 3: $650
Target 4: $700
Max Leverage: 3X
ALWAYS KEEP STOP LOSS...
Follow Our Tradingview Account for More Technical Analysis Updates, | Like, Share and Comment Your thoughts.
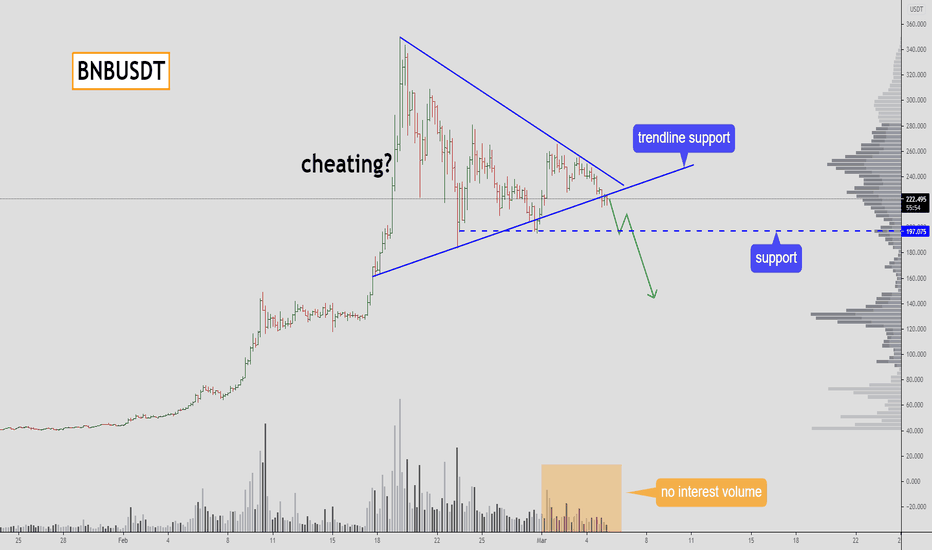
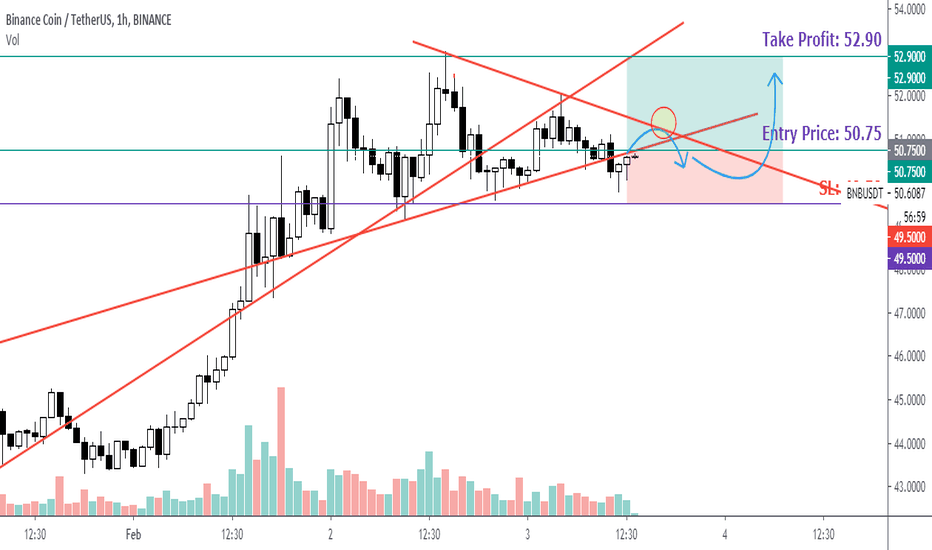
BNBUSDT - do you believe in growth?such a triangle breaks down?
pressure on support is increasing
You will learn the best place where we can trade this instrument at low risk.
Write in the comments all your questions and instruments analysis of which you want to see.
Friends, push the like button, write a comment, and share with your mates - that would be the best THANK YOU.
P.S. I personally will open entry if the price will show it according to my strategy.
Always make your analysis before a trade
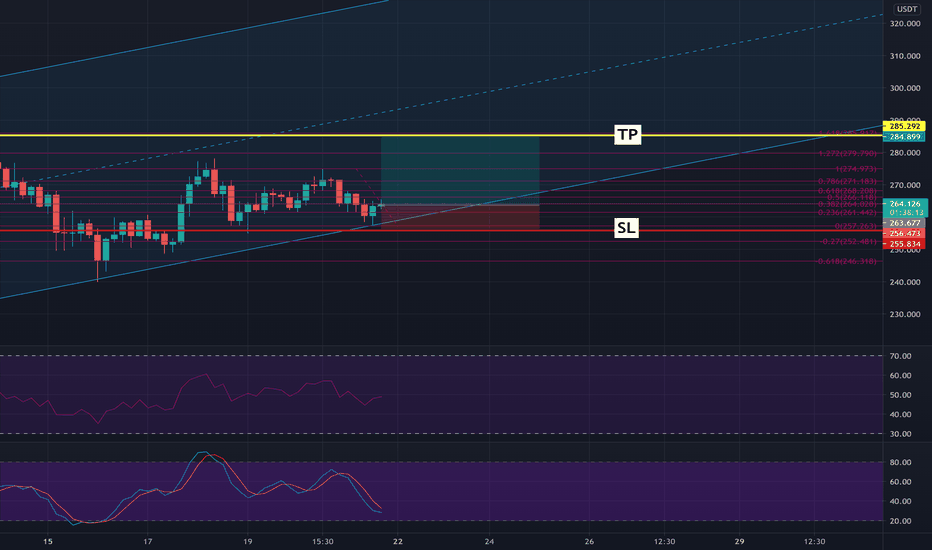
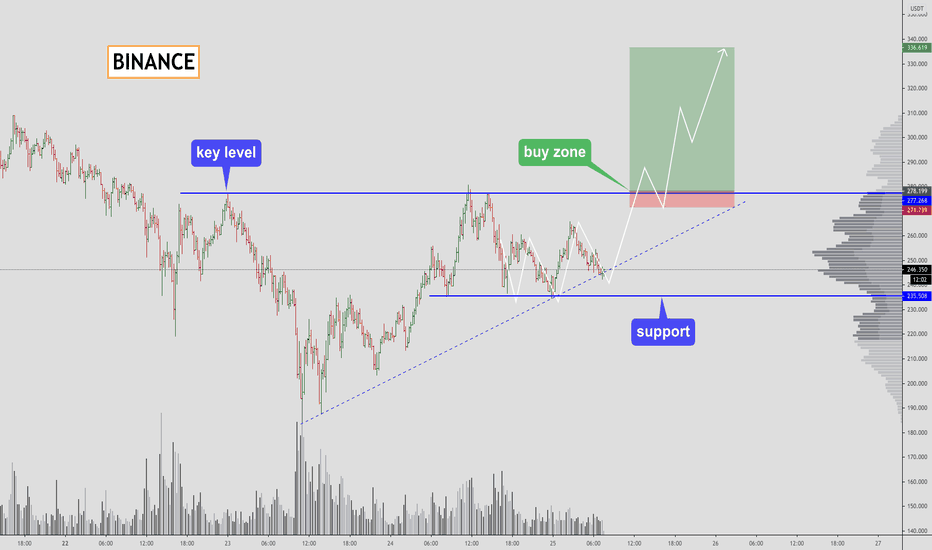
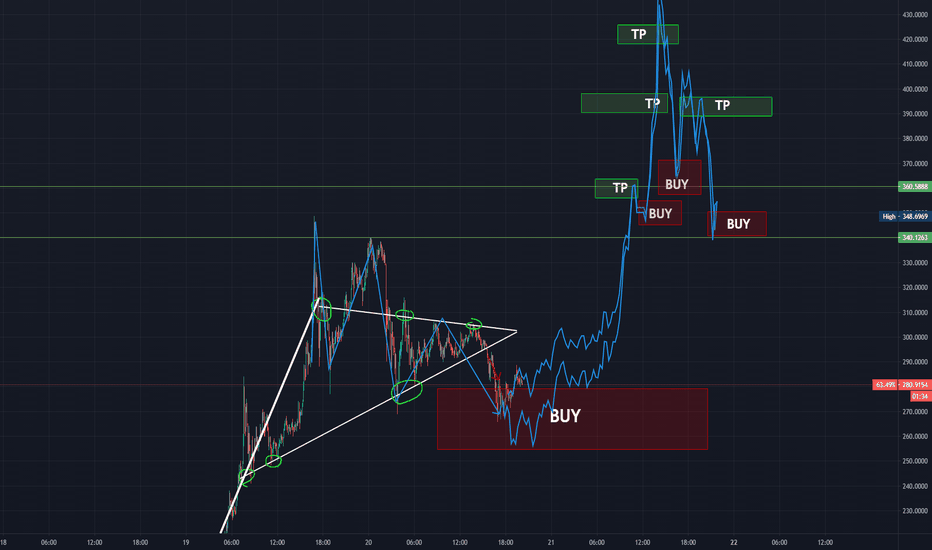
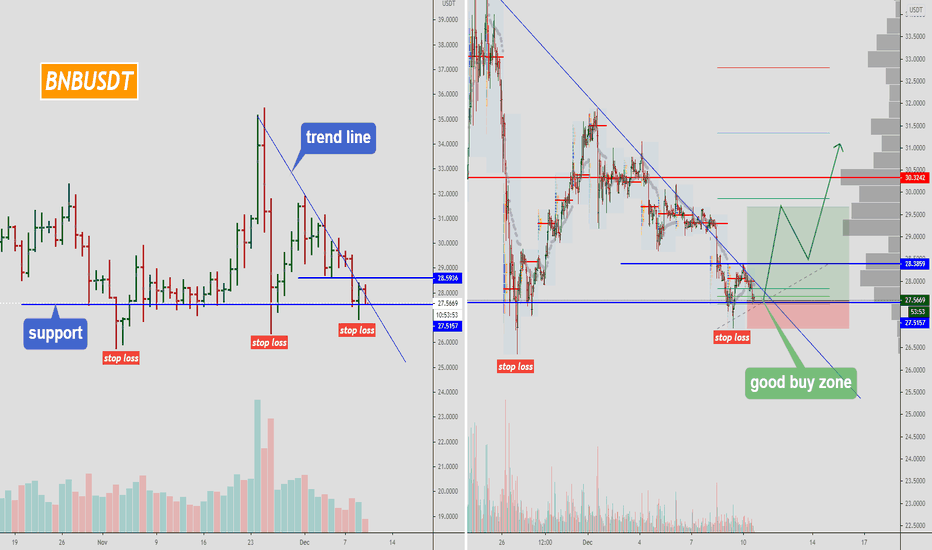
BNBUSDT - two areas to buy! keep moving forward with this plan
It's a mess, but keep going down
marked two areas for shopping!
You will learn the best place where we can trade this instrument at low risk.
Write in the comments all your questions and instruments analysis of which you want to see.
Friends, push the like button, write a comment, and share with your mates - that would be the best THANK YOU.
P.S. I personally will open entry if the price will show it according to my strategy.
Always make your analysis before a trade
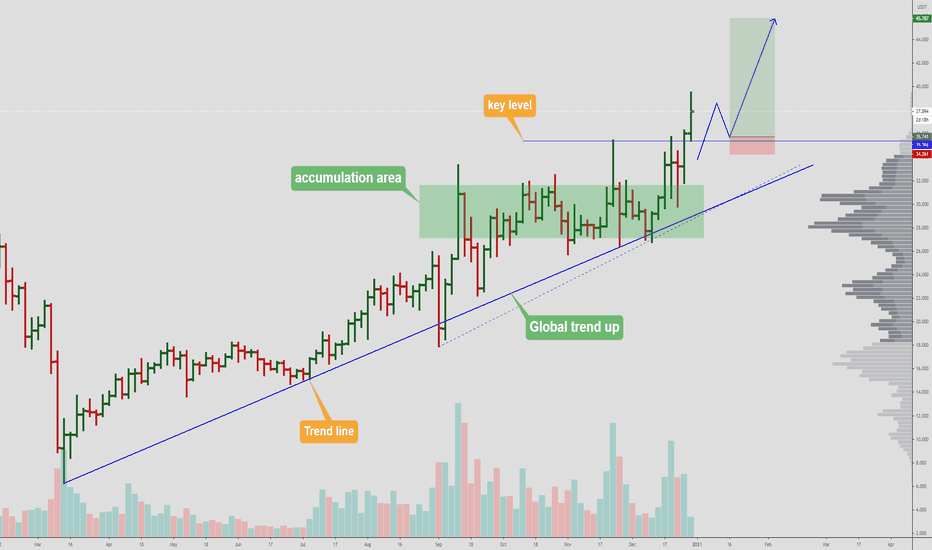
BNBUSDT - head and shoulders preconditions:
- gl up trend
- lc up trend
- key level
- accumulation
You will learn the best place where we can trade this instrument at low risk.
Write in the comments all your questions and instruments analysis of which you want to see.
Friends, push the like button, write a comment, and share with your mates - that would be the best THANK YOU.
P.S. I personally will open entry if the price will show it according to my strategy.
Always make your analysis before a trade
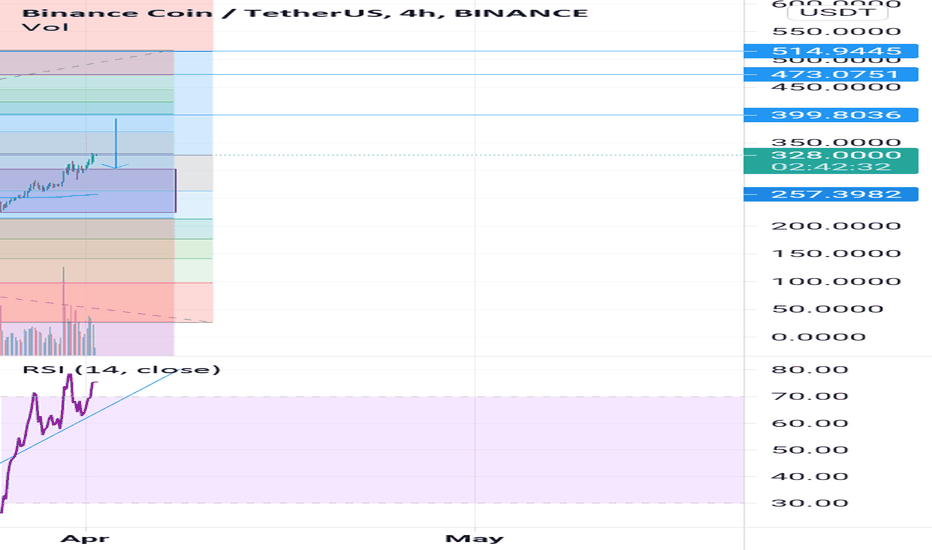
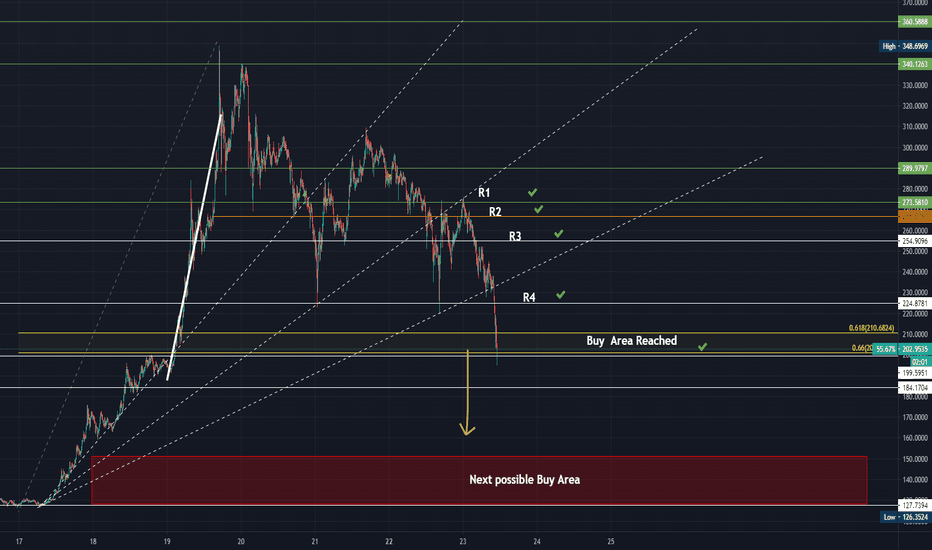
BNBUSDT Next Price Target 130-150If you Find my Charts useful please consider a follow and a thumbs-up as it motivates me to share and grow with you!
- We have Hit every target of my previous ideas with extremely high accuracy
- Next target will be 130-150
- High buy volume at 130
- This is just my current idea.
- There is always a huge chance of different patterns taking shape in these ever-changing charts.
- Trade responsibly.
- Be focused.
- Have a plan.
- Stick to the plan.
- No FOMO.
- Take the time to study YOUR own charts and come up with your own ideas as you are going to trade with your money.
- Never trade what you are not willing to lose
- Remember Stop-loss is your friend.
- Smile!
- Good Trading and Good Luck
If you Find my Charts useful please consider a follow and a thumbs-up as it motivates me to share and grow with you!
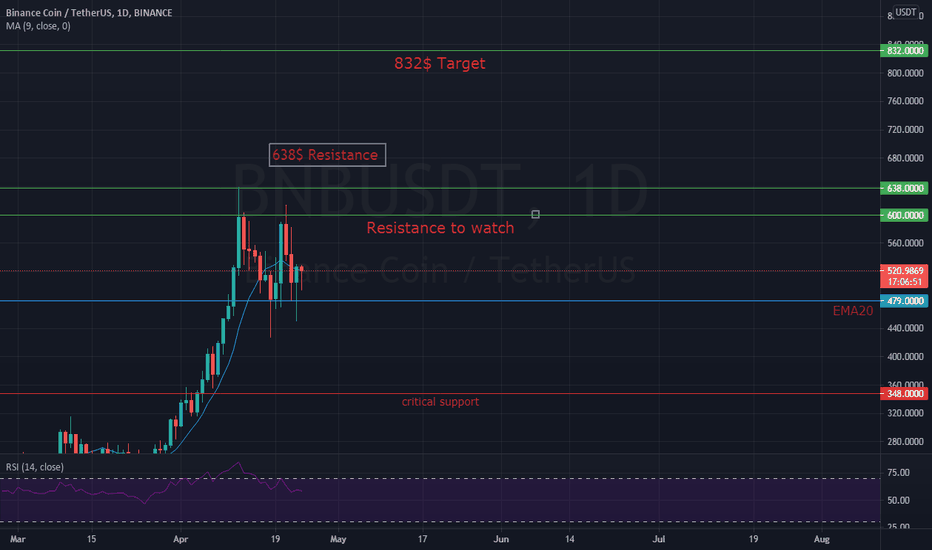
BNBUSDT - ranked third in terms of capitalization.After such a rise, there should be such a sideways movement.
If all goes according to the scenario.
I will buy at the bottom line!
Push like if you think this is a useful idea!
Before to trade my ideas make your own analysis.
Thanks for your support!
BNB Long short term analysisupdated chart from my earlier post!
- I think we can see a similar uptrend as what we've experienced before.
- There will be quite a few buy and sell areas for those who prefer short term trading strategies
- This chart is just my current idea. It can and most definitely will change!
- Please do your own research and trade according to your plan.
- Trade responsibly.
- Potential Short might be on it's way
- No FOMO!
- Keep it clean!
- Smile :)
- Please let me know what you think!
BINANCE:BNBUSDT
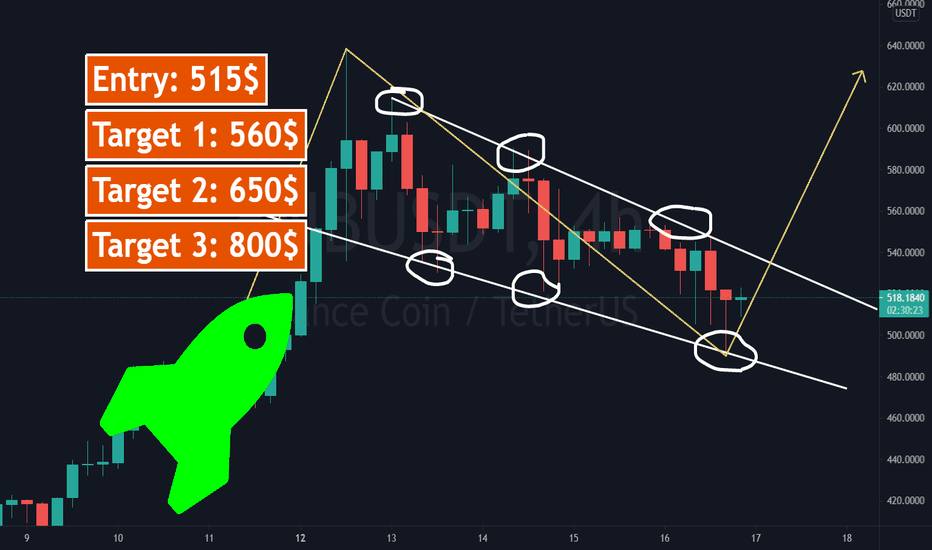
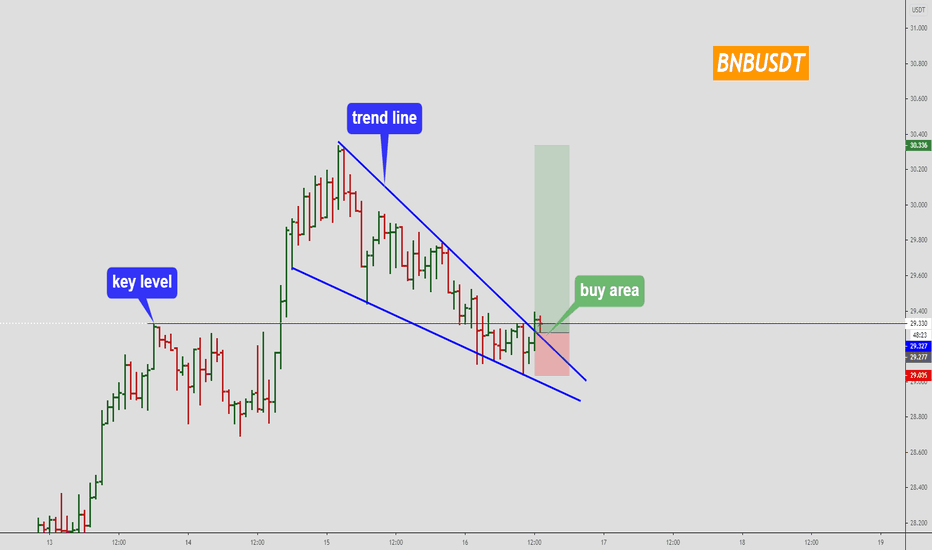
BNBUSDt- Falling Wedge
When a security's price has been falling over time, a wedge pattern can occur just as the trend makes its final downward move. The trend lines drawn above the highs and below the lows on the price chart pattern can converge as the price slide loses momentum and buyers step in to slow the rate of decline. Before the lines converge, price may breakout above the upper trend line.
When price breaks the upper trend line the security is expected to reverse and trend higher. Traders identifying bullish reversal signals would want to look for trades that benefit from the security’s rise in price.
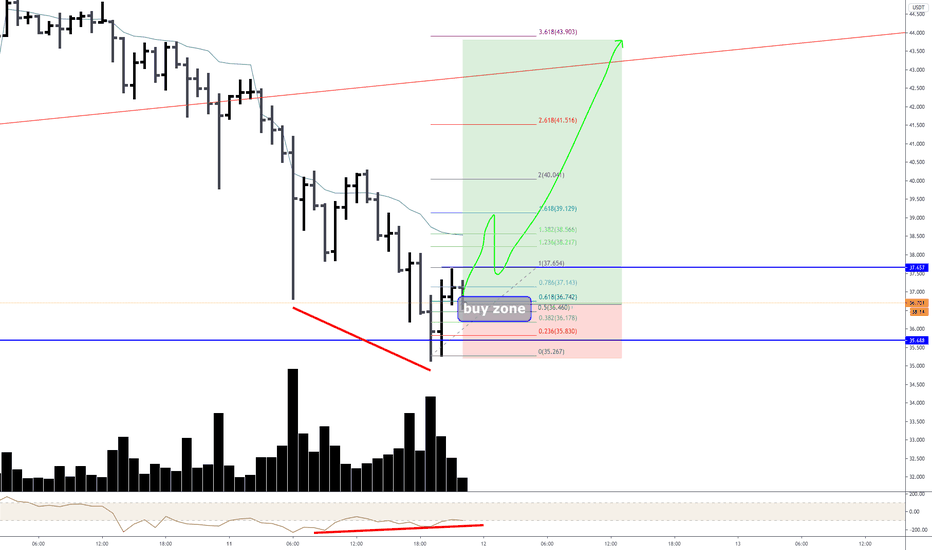
BNBUSDT - nice pattern good buy zone.
after breaked out the trend line.
R/R - 1/3
You will learn the best place where we can trade this instrument at low risk.
Write in the comments all your questions and instruments analysis of which you want to see.
Friends, push the like button, write a comment, and share with your mates - that would be the best THANK YOU.
P.S. I personally will open entry if the price will show it according to my strategy.
Always make your analysis before a trade.
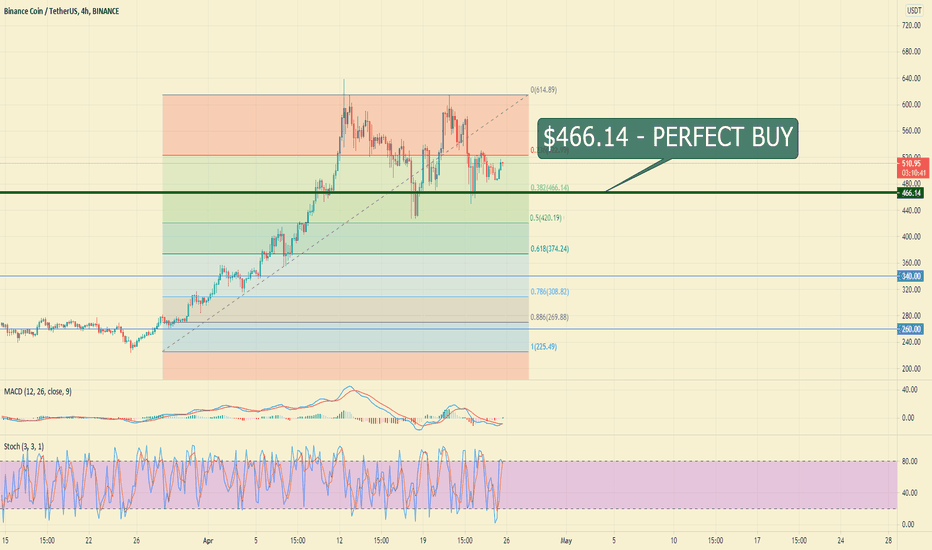
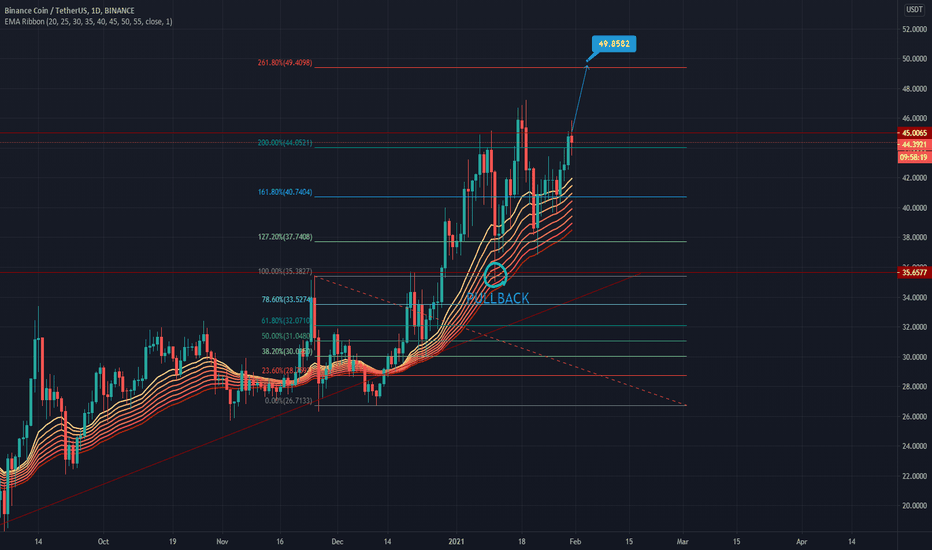
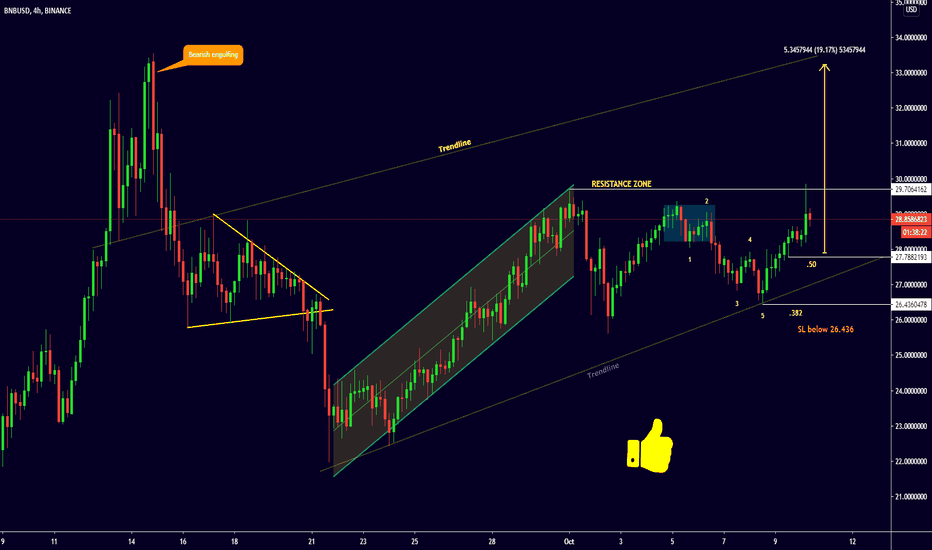
BNBUSD Bullish Setup 10-10-20🎉 Please give us a thumbs up if u like our work and do follow us so that you can get a regular update about upcoming setups and ideas
BNBUSD
Is currently trading in a bullish trend an the price is well above
the .50 Fibonacci level. The price got rejected around .382 Fibonacci and
went bullish. We can expect the price will reach the upper side of the trendpline
💌 Leave your valuable comments and suggestions related to this idea in the comment section.
Thanks for your time. Good day guys 💝
