BNBUSDTPERP

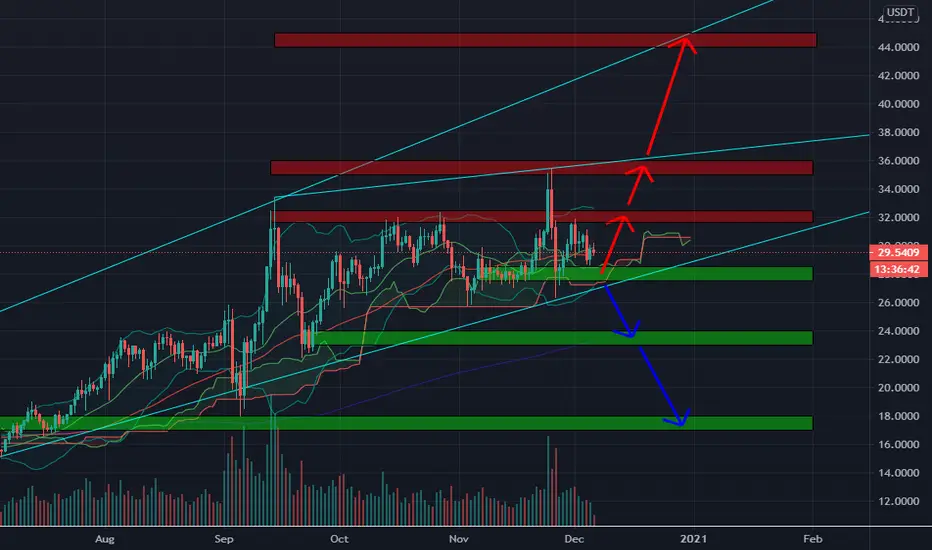
Ⓜ️Binance/USDT (6/12) View + Trading Plan #BNB $BNBThe 28$ zone still shows it to be an important price zone for BNB and we can fully trust the possibility of this zone's support.
Currently, BNB has not yet broken out of this Broadening Rising Wedge pattern and I think BNB will see a strong rally over the next few months to 60-70$.
However, be careful if BNB loses 28$ zone as it will fall back to 24$ and even 18$ very quickly.
📈BUY
-Buy: 27.5-28.5$.SL if B
📉SELL
-Sell: 31.5-32.5$ if B.SL if A
-Sell: 35-36$ if B.SL if A
-Sell: 44-45$ if B.SL if A
♻️BACK-UP
-Sell: 27.5-28.5$ if B.SL if A
-Buy: 23-24$ if A.SL if B
-Sell: 23-24$ if B.SL if A
-Buy: 17-18$ if A.SL if B
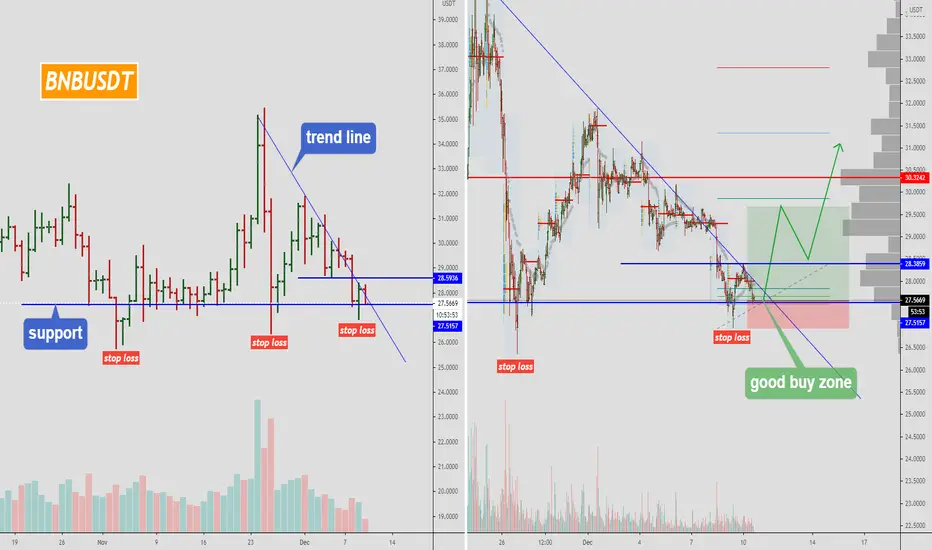
BNBUSDt- Falling Wedge
When a security's price has been falling over time, a wedge pattern can occur just as the trend makes its final downward move. The trend lines drawn above the highs and below the lows on the price chart pattern can converge as the price slide loses momentum and buyers step in to slow the rate of decline. Before the lines converge, price may breakout above the upper trend line.
When price breaks the upper trend line the security is expected to reverse and trend higher. Traders identifying bullish reversal signals would want to look for trades that benefit from the security’s rise in price.
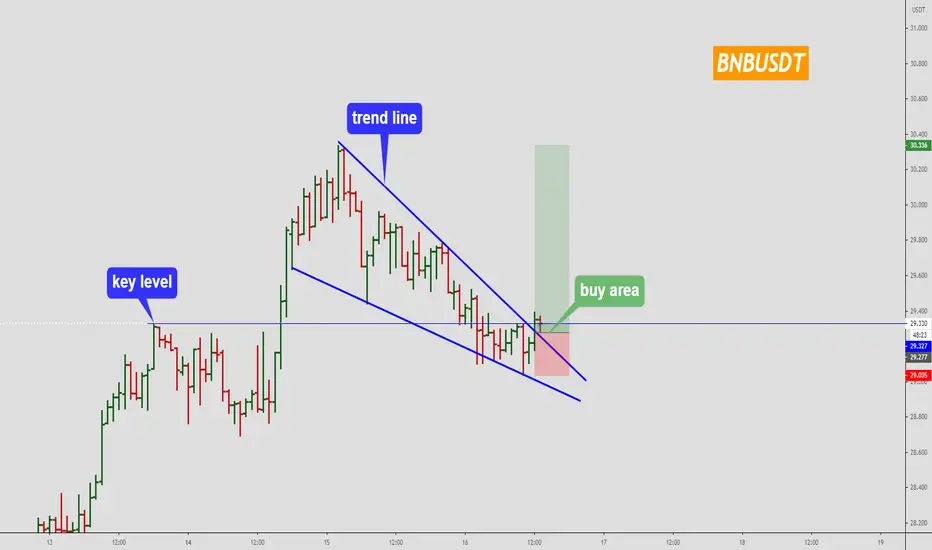
BNBUSDT - nice pattern good buy zone.
after breaked out the trend line.
R/R - 1/3
You will learn the best place where we can trade this instrument at low risk.
Write in the comments all your questions and instruments analysis of which you want to see.
Friends, push the like button, write a comment, and share with your mates - that would be the best THANK YOU.
P.S. I personally will open entry if the price will show it according to my strategy.
Always make your analysis before a trade.
BNB/USDT Bollinger bands1h - bollinger bands in BNB/USDT Squeeze
I think go down
whats your opinion ? up or down ?

Long BNB if you're bearish on bitcoinSpeculative play. Target Boon. I mean moon.
Buy $BNB to reduce trading fees, it's really that simple
How BNB performed winter 2017
Daily Money Box, ping ponged resistance and support
On support
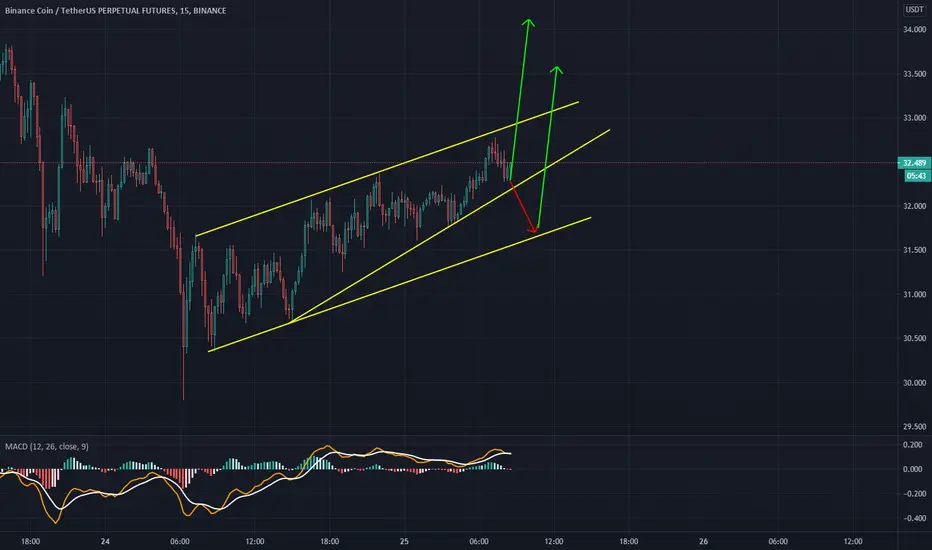
BNB/USDTPERP BINANCE4H candlesticks
If the price breaks out of the parallel uptrend channel, a new TA is needed.
Forecast indicators show future movement.

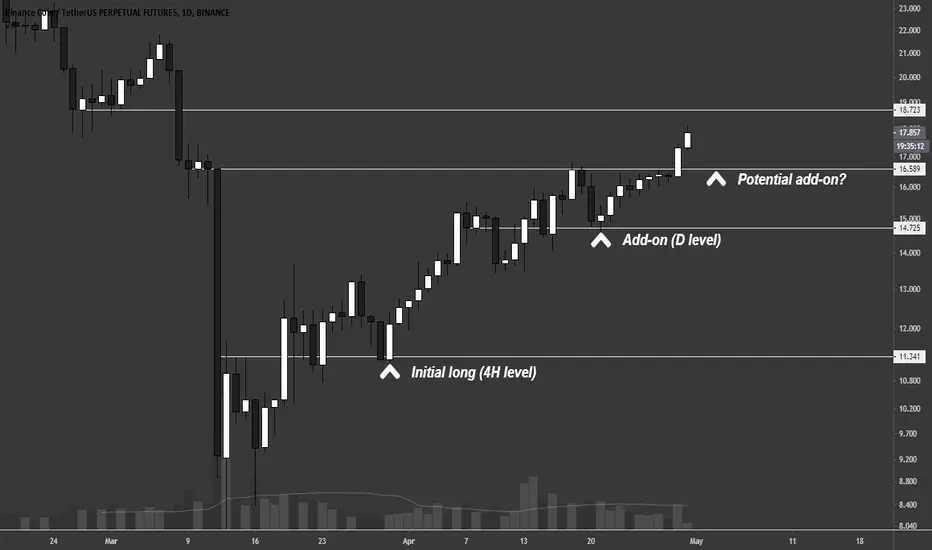
Bulltard add-on in BNBRiding the wave on BNB
The 16.589 resistance level has been beaten, it should act as support if it goes back to test it.
BNB/USDTPERP 2H (Binance) Facing double triangle resistancesBinance coin just pump because of burn and new IEO but now facing resistances.
I'm expecting a pull-back down to supports so that's our short-term set-up:
Sell Entry= 14.734 - 14.927
Take Profit= 14.427 | 14.206 | 14.004
Stop Loss= 15.236
Risk/Reward= 1:1 | 1:1.54 | 1:2.04
Expected Profit= 13.60% | 21.05% | 27.9%
Possible Loss= -13.65%
Margin Leverage= 5x
