Natural Gas Weekly Bear Flag potential but still holding Support- AMEX:NG AMEX:UNG AMEX:BOIL needs that 4 hours trend change otherwise even the big moves will essentially just fade
- still a potential weekly bear flag
- but still holding bottom wedge support and also double bottom on daily.
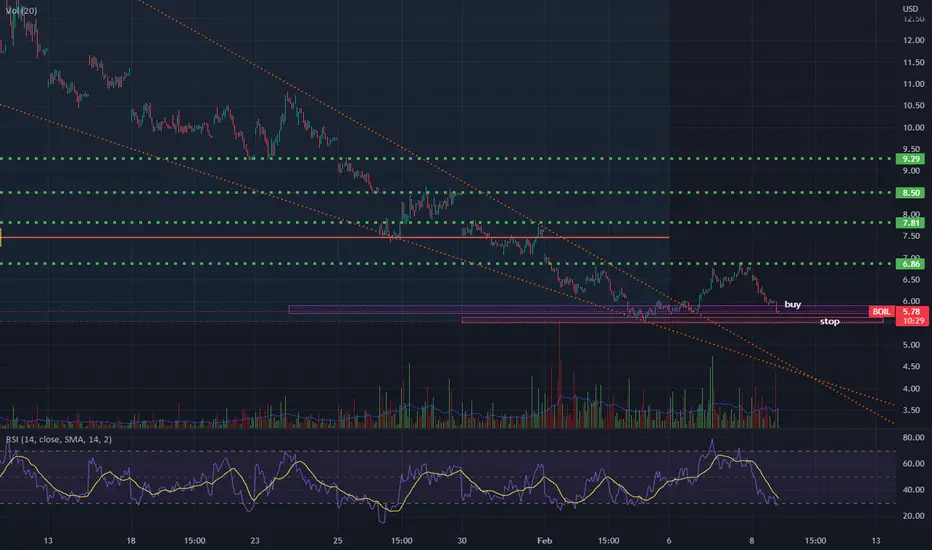
BOIL

Natural gas - bottom callers will be dead before risingMajority of traders are loading up on their AMEX:BOIL longs and natural gas futures long positions.
This is why SSL will be grabbed first between $1.5 to $1.7 before price can increase.

Natural gas - bottom is not in yetIf you see the majority of traders saying that the bottom for natural gas is in, then you should be sure that it isn't.
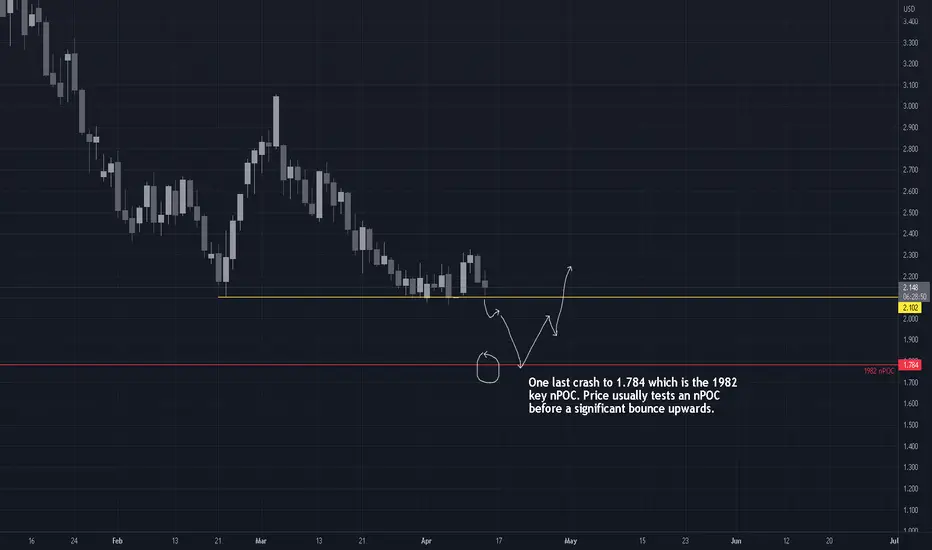
I predict that natural gas will take out these equal lows at 1.91 and we will see 1.784 soon.
The uptrend will start when no one will be talking about it.
Unfortunately, the majority of traders are in long positions and due to market liquidity, these traders need to be taken out before the market makers and institutions will buy it up again.
Natural Gas Long Term Outlook | Importance of 4H Trend change | - AMEX:NG AMEX:UNG AMEX:BOIL cant stress enough we need to change trends, even if it is a very big move it will just fade if no trends are changed
- need to change the 4h and daily trend to the bulls
- likely tightening up in a equilibrium into May, still holding the teal support line.

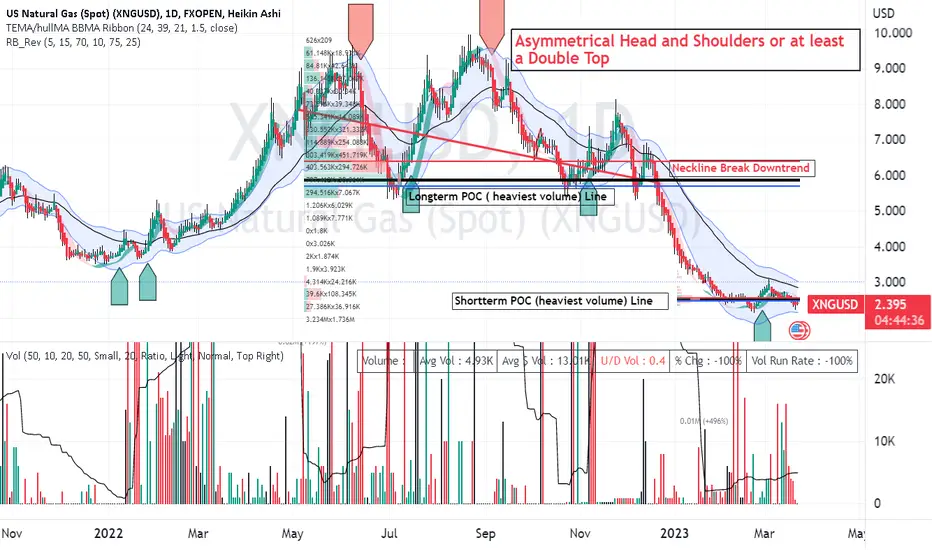
XNGUSD ready to reverse recent downtrend LONGOn the daily chart here XNGUSD had a head and shoulders or double top last summer and fall
and has now trended down to support. I see this as a prime place to take a long position.
The decline of the overvalued USD contributes to this idea as does the persistent demand in Europe
for compressed / liquid NG and the ongoing war there that could eventually grind into WWIII.
ETFs such as BOIL , UNG and UNL may be a good way to make this trade if not in the forex market.
Long natural gas Breakout retest needs to hold the last low
Close above 6 is better
In price 6.04
SL 5.4
TG on the graph
Will hold for a while
Natural Gas crash?Natural gas has crashed when comparing it to the DBC commodity ETF.
If a recession takes hold, demand destruction always prevails and it looks like Nat gas is pricing this in.
This price action could be a leading indicator that many other commodities may be vulnerable to a pullback.
Since Natural Gas is one of the smaller components of this ETF, it can see a large influx of capital that has to stay long by rotating out of other overbought commodities. Natural gas has broken out before the DBC and it has bottomed before the DBC. Nat Gas has the largest divergence from its peers.

Natural Gas: Commodity DivergencesThe correlation between DBC (orange line) and Nat Gas is strong.
However, Nat Gas gas does have price history where it diverges, leads & lags the average DBC price action. The white arrows on the screen display the periods where Nat Gas And DBC (in orange) diverge. Some of the divergences have lead to steep pops & drops of mean reversion.
What were seeing now is a massive divergence of about -33%, Nat gas has crashed and is the number one underperforming commodity in this basket.
Nat gas has retraced back to the Pre Covid low levels. Looking at the DBC ETF its about 33% off the Pre Covid Lows.
Over history the correlation usually tightens up and it has a long way to go to close the gap divergence. This presents one of 3 scenarios..
1. Other commodities in the basket collapse
2. Natural Gas Rallies
3. Both options (Our Base Case)
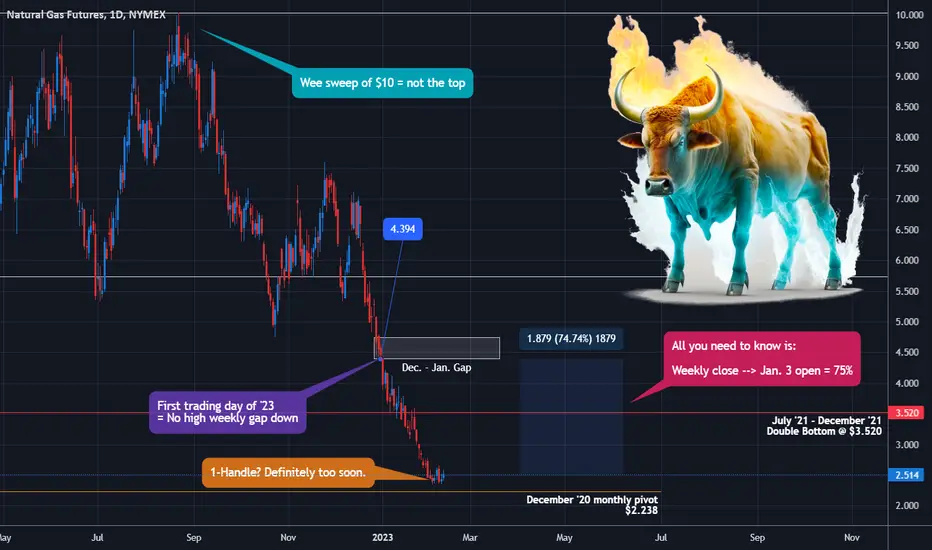
Natural Gas? More Like Natural Go. 4-Handle Coming.Over the course of 48 trading days between the Dec. 13 high and the Feb. 3 low, natural gas has lost 69 percent of its value.
Let's put that into perspective. Just imagine if, over the next 2 months:
Gold went from $1,874 to $590
WTI crude went from $79.72 to $24.17
Bitcoin futures went from $21,775 to $6,750
The SPX went from 4099.75 to 1,270
That's the kind of thing that just happened to natural gas, and naturally, it makes people wonder if they can get long, but they're also scared to get long.
And it's fair to be scared. NG's MMs are the biggest maniacs in any commodity or equity and a fall from $2.50 to $1.25 isn't "just a dollar" anymore, it's 50%, which kind of matters when you're levered long on 2-3x ETFs or just trying to trade big lot COMEX.
Regardless, I believe the time is right to go long. I don't believe the time is right to go long for $18. But I do believe that the time is right to bag the better part of an impending - and sharp - 50-75% move.
Eyes on China
I have to urge readers that you simply must be cautious with any long position at present, for the Wuhan Pneumonia situation in Mainland China is extremely dangerous.
Whatever you choose to believe when it comes to the Chinese Communist Party, I won't give you a hard time. If you want to believe the establishment narrative that Xi Jinping's hysterical Zero COVID weld-people-in-apartment-buildings social credit scheme actually made the virus not kill anyone to the degree that the Mainland, despite being the world's (formerly) most populous country and ground zero of the epidemic has suffered tens or hundreds of times less deaths and cases than the west , okay, you do you.
But when you see Zero-COVID fall, the Party says there were suddenly tens of thousands of new deaths and millions of new cases, and then since Jan. 10, the John Hopkins University tracker has reported ***0.00*** new cases, every single red alarm bell in your whole body should be ringing.
In our lifetimes, we will see the Chinese Communist Party fall. It will probably take Xi Jinping down with it, but it might not. And ultimately all the crimes against humanity the Party has committed, especially the 23-year persecution of Falun Gong and the unprecedented live organ harvesting of its practitioners (and Uyghur Muslims) will become the only thing in the world that matters.
Markets will actually gap down those days and won't come back. Wall Street won't be risk-on, at all, anymore. And thus, the algos won't be market making anymore.
The Call
Last year, I had two extremely successful calls on Natural Gas:
Published in October: Natural Gas / NG - Act II: A Number That Starts With "2"
I don't think anyone believed that at the time.
And in September, I had called when the market had finally turned from bear to bull: Natural Gas / NG - It's Officially a Bear. Now, Hold My Beer
Now, it's nice to have had some success, but please remember:
1. Broken clocks are still right twice a day
2. Past performance is not indicative of future performance
Now, for where we're currently at, there are some key factors:
Natural gas went down in a straight line for 33 trading sessions (thanks, Freemasons!)
The first trading day of the year was a gap dump
A brief sweep of the $10 psyop figure was _not_ the medium or long-term top.
2020 already had months of 1-handle
NG hasn't taken the December '20 monthly pivot at $2.2 and has started to show signs of reversal
We're getting close to summer, which is going to be HOT again because the planet's climate is trashed (just not from that CO2 propaganda nonsense. Earth is just an old man on life support, for real.)
Natural gas is this thing that produces most of the world's electricity, in a world that's using ever more electricity all the time
And so what I would ultimately like to point out is the ONLY thing you need to know as a trader:
A bounce from Friday's session close back to the gap set on the first trading day of the year amounts to a 75% gain.
Now let's say that the MMs aren't going to squeeze shorts that badly or reward bulls, even temporarily. Either way, the algorithm is for sure going to rebalance this extreme of a drop, and even if it were to rebalance 50%, you're still looking at a 35% gain.
I believe that for certain NG is about to bounce. It's just that either:
a) The bottom isn't yet in
b) The bottom is in after a 90% retrace to the $2.35 bottoms (this should occur when Nasdaq goes ham as Wall Street "Big Shorts" tech to retail and Cathie Woods)
Nasdaq NQ QQQ - Reality Will Be a Tough Pill for Permabears
$3.6 - $3.8 is the conservative upside target
$4.2 - $5.0 is the maniac upside target
Either way, I don't believe it's going to V-Bottom and run $18 and feed inflationary pressures, since equities need to go up before they go down, and CPI printing big gains will really get in the way of the narrative being woven by Citadel's PR firms.
I think this spike should come fast and strong and the retrace won't be that bad, but will be consolidate-y.
July of 2023 and straight through the middle of 2024, if humanity makes it functionally that long, is going to be very inflationary and very chaotic.
The status quo, the old normalcy, is long gone, and never coming back. Mankind is walking towards both the end, and its future.
Be careful. You choose your path with your heart and your conduct.
Natural Gas and the Dangers of Swing Trading Leveraged ETFsThinking that the war in Ukraine would cause the price of natural gas to surge higher over the winter, many traders got stuck on the wrong side of a trade. Natural gas futures have plunged more than 90% over the winter.
In this video, I explain that regression analysis was warning that a significant price decline was imminent in late 2022, and I explain that it is now suggesting that a bounce in natural gas prices may soon occur. This video also explains the pitfalls that many novice traders experience when trying to swing trading leveraged ETFs that employ derivatives and which undergo volatility drag over time.
Here is the link to the risk-reward / win-ratio spreadsheet that is referenced in the video.
docs.google.com
Shared with permission from @HeWhoMustNotBeNamed
Note for stats nerds: The log-linear regression channel indicator does not give negative numbers for the Pearson correlation coefficient (r). The indicator gives the absolute value of the Pearson correlation coefficient |r|. So if the correlation is strongly negative or strongly positive, it will appear near 1 in both cases.
Important Disclaimer
Nothing in this post should be considered financial advice. Trading and investing always involve risks and one should carefully review all such risks before making a trade or investment decision. Do not buy or sell any security based on anything in this post. Please consult with a financial advisor before making any financial decisions. This post is for educational purposes only.

Natural Gas Full Bear Control | Potential Equilibrium - NG UNG full bear control, need to see a hourly trend change to the bull for anything to happen.
- potential Equilibrium shape up on daily time frame if bulls can hold above $2
- daily 12 EMA resistance

Natural Gas $UNG $BOIL NG - Future Price Outlook- UNG NG NATGAS 6h 12 EMA is my short term guide
- weekly bear flag potentially confirming
- 52 week low support bulls need to defend
- 1h equilibrium pattern will break Monday

BOIL UPDATE LONGTERMOn the daily chart, BOIL price has never been lower and the relative volume has never
been higher in the past five years. Being mindful, this is leveraged it falls faster than an
the unleveraged counterpart of the same commodity ( UNG INL) However moves in the
opposite directions are also amplified. Horizontal red lines are drawn in consideration
of pivots on the 4H. Price was nearly $600 in 2019. Can you think of a fundamental
reason why price cannot rise from the present price to something closer to that
of 2019. To go from $4 to $600 is 150X in otherwords 15000%. Is there anything
wrong with my math or the chart?

Natural Gas Full Bear Control. Short term 15m EMA 12 Guide- NG UNG is on a downtrend in every time frame, bears are in full control.
- Bulls would hope we hold the 52 week low
- need an hourly trend change back to the bulls for we to potentially get a 4h and daily bounce going and shape up an Equilibrium pattern.
- short term intra-day 15m 12 EMA is our guide for full bear control.
- I definitely wouldn't be shorting all the way down here but also there's no signs for me to be interested long as well atm unless bulls can start to shape up some hourly trend change.

Natural gas is almost done consolidating On the 4th hour chart , natural gas looks to be forming a minor bullish divergence on the MACD. It has also formed a falling wedge , which has a higher probability of breaking to the upside. The current sell off was obvious when natural gas rallied to the upper trend line and couldn't break it. A move to the lower trendline is almost finished , a grind lower to tag it is very possible , and a move to 2.22 is not to be ruled out. The zone that natural gas has entered will , in my opinion, yield a reaction very soon.

$NG $UNG $BOIL Where Price would be for the Next couple weeks- UNG NG BOIL have retraced over 50% fib of the A to B move from the bottom, that's a clear sign that we will likely get an equilibrium base on how significant these swings are.
- NG has a tendency to break a resistance and have no follow through vice versa breaking a support and have no follow through so im looking for a equilibrium tightening up price action the next couple weeks.
- Short term bears still in full control

Natural gas is prepping for a big moveNatural gas is prepping for a big move to the upside after the gap fill that's marked on the chart (2.35 vicinity). The gap coincidently lines up with the lower trend line of a falling wedge , making this area a magnet. The move in Natural gas in the previous weeks was very large , which subsequently required some consolidation before another leg. Assuming the general markets can sustain some footing or stall , despite the Silicone Valley bank debacle, natural gas can make a move to the $4 mark.
AD Basing. Looking for a bullish ABC movement over $2.664Need a bullish ABC movement over $2.664, which was a previous support position . Then we ave $2.836 that broke out. I'm predicting A leg to hit this level. followed by B leg to retest support and finally a move back up to $3 natural gas

natty weekly chart both AD/Stoch RSI double bottomincluding the wave count, Im showing a retest of the b leg of the bullish cypher which is around wave 2... Im buying all dips on natural gas and boil etf

AD showing a double top looking to short to C legfrom the chart on the 30min of ngas, the Ad has created a double top and there is already a bearish cypher pattern currently present. looking to short to C leg around 2.68 natural gas.
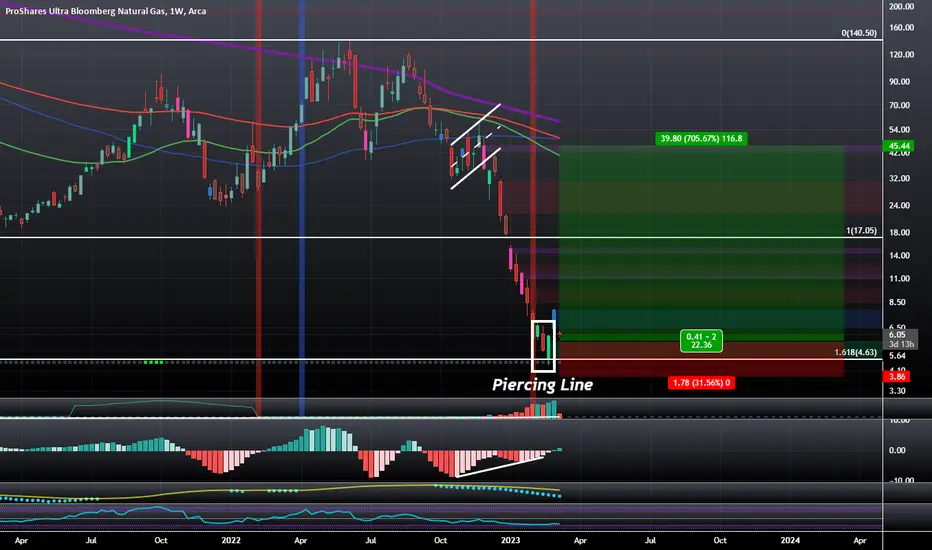
BOIL: Piercing Line Bullish Reversal Visible on Weekly at 1.618BOIL; The 3x Bullish proxy for Natural Gas is showing Bullish Divergence at a 1.618 Fibonacci Extension after confirming a Piercing Line on the Weekly Timeframe at said level.
If it plays out i think BOIL could come back up to fill some gaps, meet the moving averages, and see anywhere from a 200%-700% rise.
I do however think USOIL will see a decline and that the two will move in opposing directions for awhile as that is something that they they tend to do.
As a side note we also have a Daily Bullish 3 White Soldiers on Natural Gas itself as well as a Bullish Shark that can be seen here:
BOIL hit the boiling point FridayInvesting, investing,
Let's put our money to work!
Buying stocks and bonds and funds,
For our future we will perk!
BOIL, and natural gas in general spent what seems like forever capitulating. There was just too much supply but I expected demand will increase which would drive up the price of natural gas. Supply and demand are the main drivers of commodity prices as they determine the amount of a commodity available and the level of desire for it. When supply is low or demand is high, prices tend to rise, while excess supply or low demand can lead to price drops.
When news broke this morning, the price dropped 20% and we landed -20%+ at EOD Monday. If you look at the daily wave master (not pictured), you will see that there is significant chance that this little trooper will drop more. What is more important is that the move looked like it finished after a 60%+ move from the lows backon Frbruary 21st. Now, we wait. Lets see if BOIL and Natural Gas make new lows or if we'll find some support. Need patience on this one.

Natural Gas $NG $UNG $BOIL Tips for Riding your Profit- 4H 12EMALast weeks NG video i mentioned that this is likely a climax bottom and we are heading higher with potential inverse H&S pattern, it ended up playing out in the hourly time frame and bulls were a lot stronger than i expected.
- Looking at the 4h time frame 12 EMA as full bull control support if we don't lose it then we wont be getting 4h and daily consolidation yet.
- im still holding my $BOIL position (it 2x leverage of UNG) its a small position so i'm letting it ride at least 20~30% of course ill still be watching how we consolidate on 4h and daily time frame will tell me a lot if the bull move will continue.
