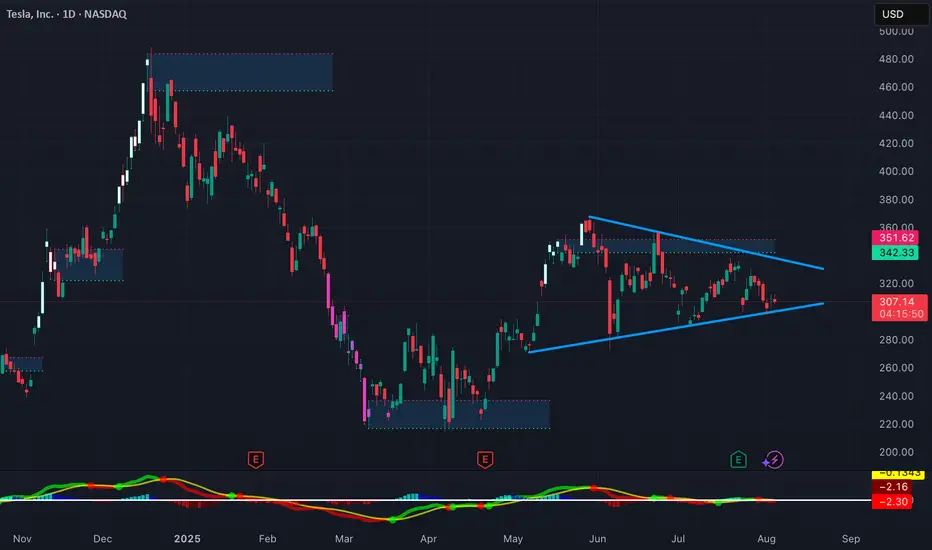
Sitting Right on the 200-Day EMATSLA is sitting right on the 200-Day EMA here while holding this wedge for quite some time. TSLA's Bollinger Bands are starting to squeeze, indicating a significant move is forthcoming, and moving averages (MA 5/10/30/60) are flattening, indicating a loss of bullish momentum. It will be interesting to watch from here.
Bollingbands
Deep Dive Into Bollinger Bands 🗓This article explores the Bollinger Bands indicator—a powerful volatility tool used by traders worldwide. You'll learn how it works, how to calculate it, and how to use it to detect potential breakouts, trend reversals, and overbought or oversold conditions in the market.
📚 Introduction to Bollinger Bands
In the fast-paced world of trading, understanding market volatility is key to making informed decisions. Bollinger Bands, developed by John Bollinger in the 1980s, offer a visual and statistical method to measure this volatility. Unlike simple moving averages, which only tell you the trend, Bollinger Bands expand and contract based on recent price action, helping traders spot overbought, oversold, or consolidation phases.
These bands dynamically adjust to market conditions, making them one of the most popular indicators for trend-following, mean-reversion, and breakout strategies. Whether you’re trading crypto, stocks, or forex, Bollinger Bands can help you identify high-probability setups by combining trend direction with volatility.
📚 How Bollinger Bands Are Calculated
Bollinger Bands consist of three lines:
Middle Band – This is a simple moving average (SMA) of the price, typically over 20 periods.
Upper Band – The middle band plus two standard deviations.
Lower Band – The middle band minus two standard deviations.
Middle Band = SMA(n)
Upper Band = SMA(n) + (k × σₙ)
Lower Band = SMA(n) - (k × σₙ)
Where σₙ is the standard deviation of the price for n periods and k is the multiplier, typically set to 2, which captures ~95% of price action under normal distribution. The middle band shows the average price over the last 20 candles. The upper and lower bands adjust based on how volatile the price has been — expanding in high volatility and contracting in low volatility.
🤖 For those traders who want to implement Bollinger Bands into algorithmic strategy we provide formula it's calculation in Pine Script:
basis = ta.sma(src, length) // Middle Band (SMA)
dev = mult * ta.stdev(src, length) // Standard Deviation × Multiplier
upper = basis + dev // Upper Band
lower = basis - dev // Lower Band
📚 How to Use MACD in Trading Strategies
⚡️Bollinger Band Squeeze (Volatility Contraction and Expansion)
The idea is pretty simple, а squeeze indicates low volatility and often precedes a breakout. The squeeze is the situation when the Upper Band and Lower Band contract, and BB width is at a local minimum. In this case you shall be prepared for the high volatility after the period of low volatility. This strategy doesn’t predict direction — it prepares you for volatility.
Long setup:
Price is in long-term uptrend, you can use 200 EMA as a major trend approximation - price shall be above it.
Bollinger Bands is narrow in comparison to the previous period. Price usually is in sideways.
Open long trade when candle shows a breakout and closes above the Upper Band.
Set a trailing stop-loss at the Middle Band.
Short setup:
Price is in long-term downtrend, you can use 200 EMA as a major trend approximation - price shall be below it.
Bollinger Bands is narrow in comparison to the previous period. Price usually is in sideways.
Open short trade when candle shows a breakdown and closes below the Lower Band.
Set a trailing stop-loss at the Middle Band
📈Long Trading Strategy Example
1. Price candle shall be closed above 200-period EMA. In our example we have BITMART:BTCUSDT.P 4h time frame.
2. Bollinger Bands shall be narrow in comparison with the previous periods.
3. Open long trade when candle closes above the Upper Band.
4. Close trade when price touched the Middle Band.
📉Short trading strategy example
1. Price candle shall be closed below 200-period EMA. In our example we have BITMART:BTCUSDT.P 4h time frame.
2. Bollinger Bands shall be narrow in comparison with the previous periods.
3. Open short trade when candle closes below the Lower Band.
4. Close trade when price touched the Middle Band.
⚡️Mean Reversion (Rebound from the Bands)
This is the most common approach to use Bollinger Bands. The idea is also very simple, we just want to open long if price touches Lower Band and short if price reaches Upper Band. Price tends to revert to the mean (Middle Band), especially in range-bound markets. It's very important to trade in the direction of the major trend to reduce the probability of the large move against you.
Long setup:
Price is in long-term uptrend, you can use 200 EMA as a major trend approximation - price shall be above it.
Open long trade when price touches the Lower Band.
Set the initial stop-loss at the fixed percentage below entry price. Choose this percentage number with your personal risk/money management, you shall be comfortable to lose this amount of money in case of stop-loss hit.
If price reached Middle Band set stop-loss at breakeven.
Close trade when price reached the Upper Band.
Short setup:
Price is in long-term downtrend, you can use 200 EMA as a major trend approximation - price shall be below it.
Open short trade when price touches the Upper Band.
Set the initial stop-loss at the fixed percentage above entry price. Choose this percentage number with your personal risk/money management, you shall be comfortable to lose this amount of money in case of stop-loss hit.
If price reached Middle Band set stop-loss at breakeven.
Close trade when price reached the Lower Band.
🧪 Important: the most common approach to close trades is the Middle Band touch, this is classic mean reversion. We experimented multiple times with different approached and revealed that usually it's better to take profit at the Upper/Lower band for long/short trades and use Middle Band only for setting stop-loss at breakeven. This approach provides better risk to reward ratio.
📈Long Trading Strategy Example
1. Price candle shall be closed above 200-period EMA. In our example we have BITMART:BTCUSDT.P 4h time frame.
2. Open long trade the Lower Band.
3. Put Initial stop-loss 2% below the entry price.
4. When price reached Middle band place stop-loss at the breakeven.
5. Close long trade at the Upper Band.
📉Short trading strategy example
1. Price candle shall be closed below 200-period EMA. In our example we have BITMART:BTCUSDT.P 4h time frame.
2. Open short trade the Upper Band.
3. Put Initial stop-loss 2% above the entry price.
4. When price reached Middle band place stop-loss at the breakeven.
5. Close short trade at the Lower Band.
🧪 Important tip: notice that initial stop-loss is needed only to avoid disaster in case of price moves strongly against you. This percentage shall give enough space to avoid its reaching too often. Mean reversion strategy provides fast trades with the small average gain, so you shall maintain the high win rate (perfectly above 70%). You have to choose stop-loss based on particular asset volatility.
⚡️Combined Approach: Mean Reversion + Trend Following
Skyrexio made multiple researches about Bollinger Bands strategies and we found that we can receive better gains in combination of different approaches. Mean reversion gives you great entry with discount but you don't need to exit that early. Use the trading stop and allow to gain profit while market is moving in your direction.
This approach you can find in our advanced strategy Bollinger Bands Enhanced Strategy which we shared in 2024. Click on the link to read about it and understand how you can combine best features of this popular indicator.
📚 Conclusion
Bollinger Bands are more than just a volatility indicator — they provide a flexible framework for understanding price dynamics and market conditions. By visualizing the relationship between price and standard deviation around a moving average, traders can gain valuable insights into whether an asset is consolidating, trending, or preparing for a breakout.
The real strength of Bollinger Bands lies in their versatility. They can adapt to different trading styles — whether you’re a short-term scalper, a swing trader, or a long-term position holder. From identifying squeeze setups to riding strong trends or capturing mean reversion moves, BBs offer a strategic edge when used correctly.
However, Bollinger Bands should never be used in isolation. Like any technical tool, they work best when combined with momentum indicators like RSI or MACD, volume analysis, and price action signals. Context is key: a signal that works well in a ranging market may fail during high momentum trends.
Ultimately, Bollinger Bands help traders make more informed, disciplined decisions by clarifying where price stands relative to recent history. When paired with sound risk management and broader market awareness, they become a powerful ally in navigating market uncertainty.

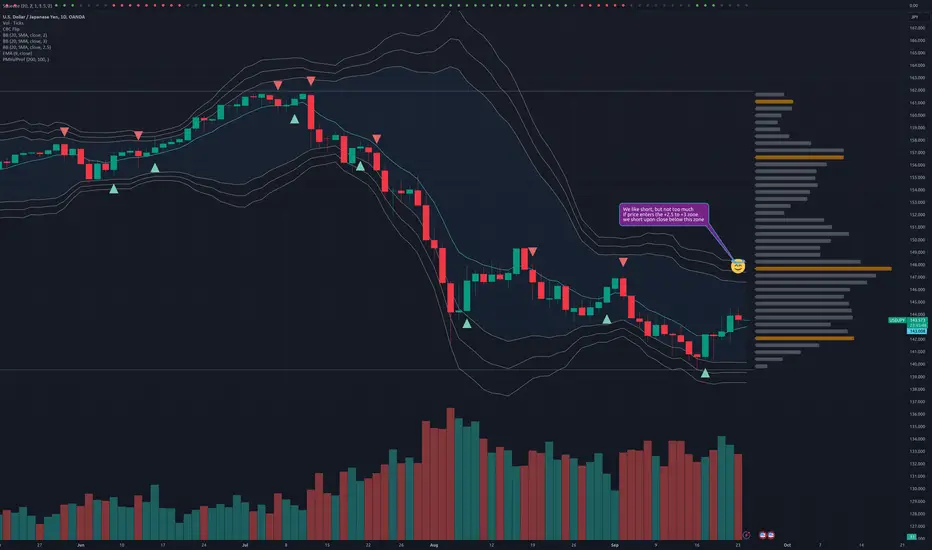
3-sigma short signal
We expect this to rug on the fundamentals, but FOMC had opposite effect
The 3-sigma Bollinger will light any wick that enters it
Let the wick burn and wait for a close outside the 2.5-3 sigma channel to trigger the trade, and watch it explode to the downside
Risk the highest wick in the channel
Target 3x
BoJ is watching you do this
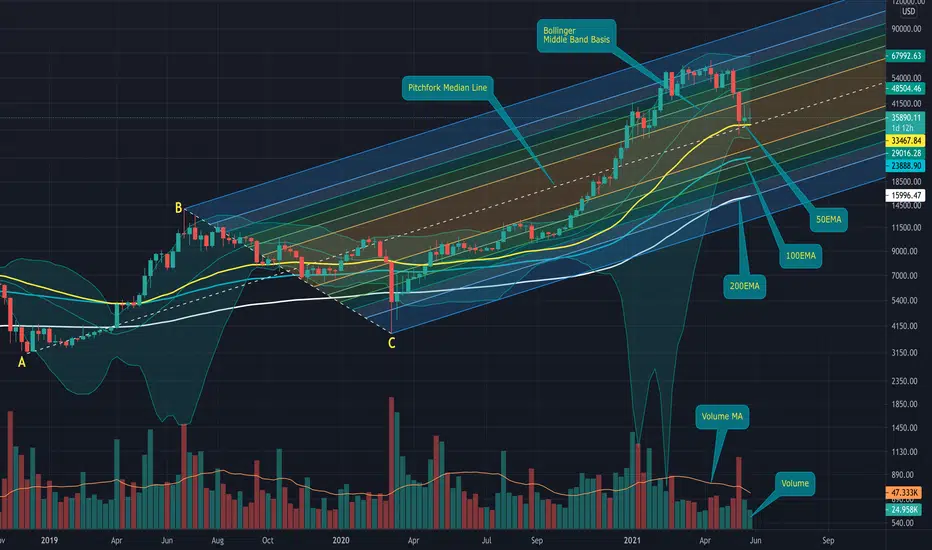
BTC - Crucial times ahead for Bitcoin on the weekly chartBTC - A look at the Weekly Chart:
BTC is still above it’s 50EMA on this weekly timeframe.
BTC is below its Bollinger Bands Middle Band Basis 20 Period SMA on this weekly timeframe. Note that the Lower Band has risen up indicating volatility has slowed and now brought back into equilibrium for this weekly timeframe. Note that the Bollinger Bands Upper and Lower Bands are moving sideways.
If we look at the Longterm Pitchfork Pattern (A,B,C), BTC is still above its Longterm Upwards Pitchfork Median Line.
At the moment, BTC is still below its Volume Moving Average (Orange Line) for this weekly timeframe which is a 20 Period MA. Overall volume is still low for this week.
I have added the 100EMA and 200EMA so you can see where these potential levels of support are at the moment of typing this for this weekly timeframe.
The Average Directional Index (ADX DI) is showing that the trend strength has dropped with the ADX (Yellow Line) dropping to 50.33 and its below its 9 Period EMA (White Line) which is at 58.25. The -DI (Red Line) is at 22.97 above its +DI (Green Line) 15.59. Notice however that the -DI (Red Line) is pointing downwards indicating negative momentum has also dropped. We eventually need the +DI (Green Line) to start curving upwards and eventually cross back over the -DI (Red Line) that will indicate renewed longterm positive momentum for this weekly timeframe.
The Chaikin Money Flow (CMF) is showing that accumulation has dropped massively from its high but the CMF (Green Line) is still in the Accumulation Zone at 0.03. Notice that the CMF (Green Line) is starting to curve slightly sideways. I have added a Least Squares Moving Average (LSMA) (Blue Line) to the CMF, note that the CMF (Green Line) is below its LSMA (Blue Line) which is at 0.15, a very good sign will be if the CMF curves upwards and gets back above the LSMA.
This week and next will be very crucial for BTC, if you are longterm long then you need BTC to stay above the Longterm Pitchfork Median Line and the 50EMA on this weekly chart. If BTC cannot stay above the 50EMA & Pitchfork Median Line on this weekly timeframe then BTC may drop into the Distribution Zone on the CMF for this weekly timeframe.
A very good sign to look out for is if this weekly candle and especially next week’s candle closes green with a higher high and a higher low and especially above that crucial support of the 50EMA and Pitchfork Median Line.
Here is a closer look at the Chaikin Money Flow (CMF):
Here is a closer look at the Average Directional Index (ADX DI):
I hope this is helpful with your trading or hodl-ing.
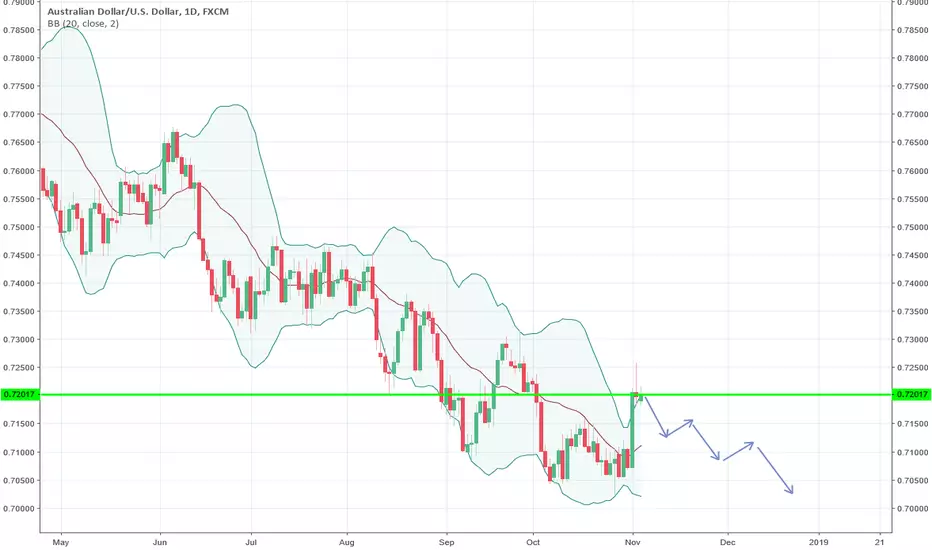
AUDUSD SellMonthly , Weekly trend is downward so there is alignment
Look for entry at 0.72 - Daily Bollinger
Only enter if Hourly closes below
No stop loss - get out of the position wherever it is, after 96 Hours (4 X 24 Hours)
Good luck
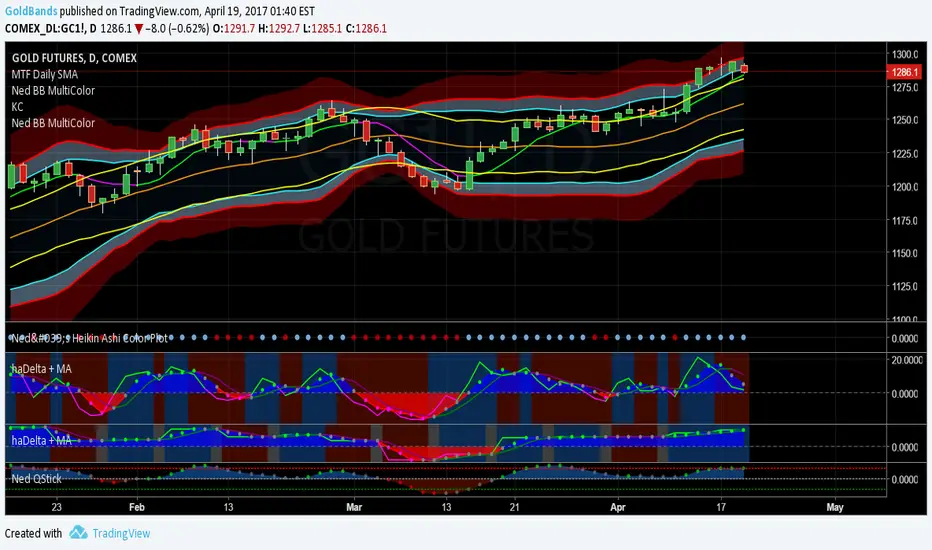
Gold Moves Sideways in OverBought TerritoryAlthough Gold mostly moved sideways today, closing up 3 points on the day. As price moved up in late afternoon trading, I did enter a short position for the following reasons:
1. Price has stalled well into the overbought upper Bollinger Band territory
2. Friday's shooting star followed by Monday's doji indicate to me that the upward momentum is waning
3. Tuesday's candle stopped right at the upper Bollinger Band but not above it.
4. haDelta daily indicator has been red for 2 days
As gold continues to sell off after hours, I will be watching price reaction at the 7 day moving average at 1283.40. If price breaks through that level, I'll be looking for a continued move down to 1261.60, the mid point on the Bollinger Bands.
Baring an unexpected sell-off, it'll take another couple of days for the Heikin-Ashi candles to turn red.
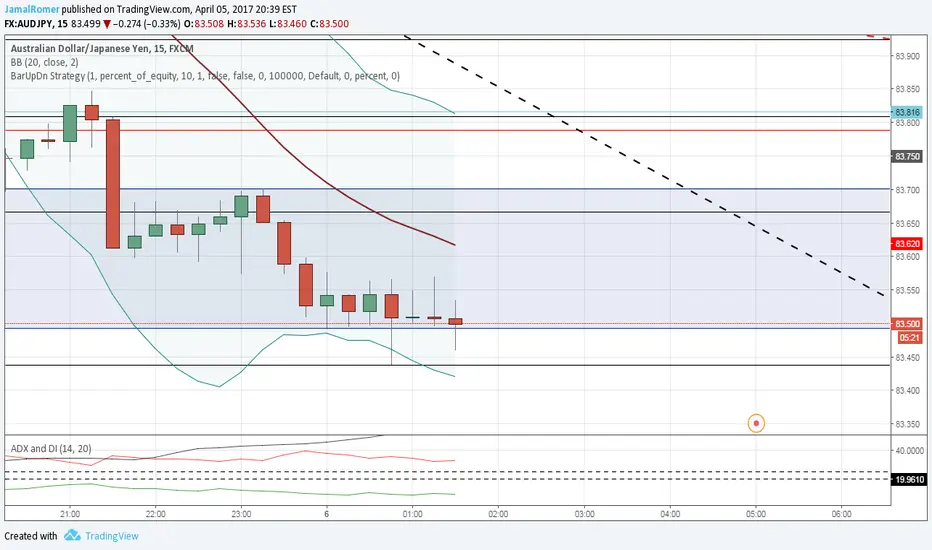
Strong DownTrend AudJpy ?Adx Showed me 3 confirmations that audjpy was going to take a lil journey down.
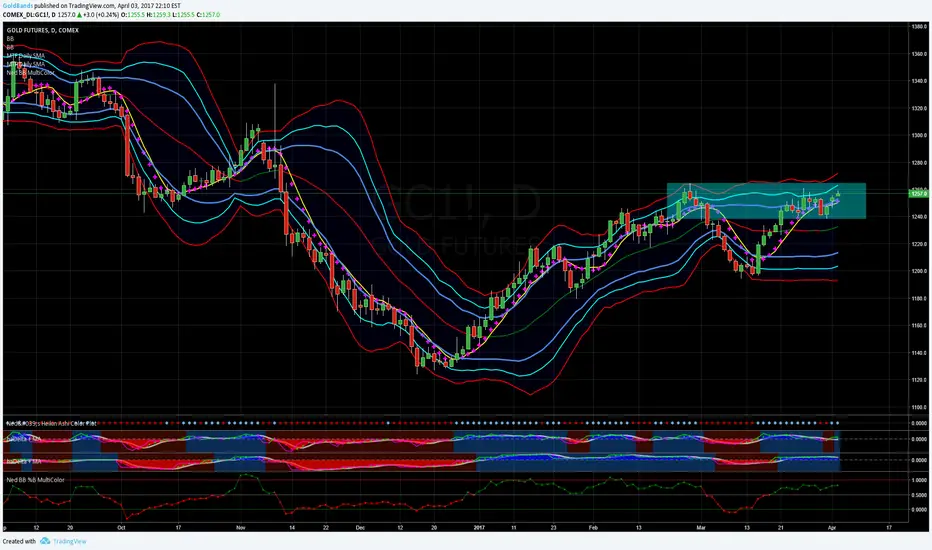
Gold Rises to Top of Month Long RangeOn Monday, Gold continued Friday's move up and rose 2.1 points to close at 1254. I have highlighted the month long range on the chart. Price also closed above the 7 day moving average and the haDelta has turned back to blue. In addition, the upper Bollinger Band has started to move higher to 1271.90 And the Heikin-Ashi chart below shows a strong potential trend change.
Disclaimer: This post is for educational purposes only. Trading is at your own risk.
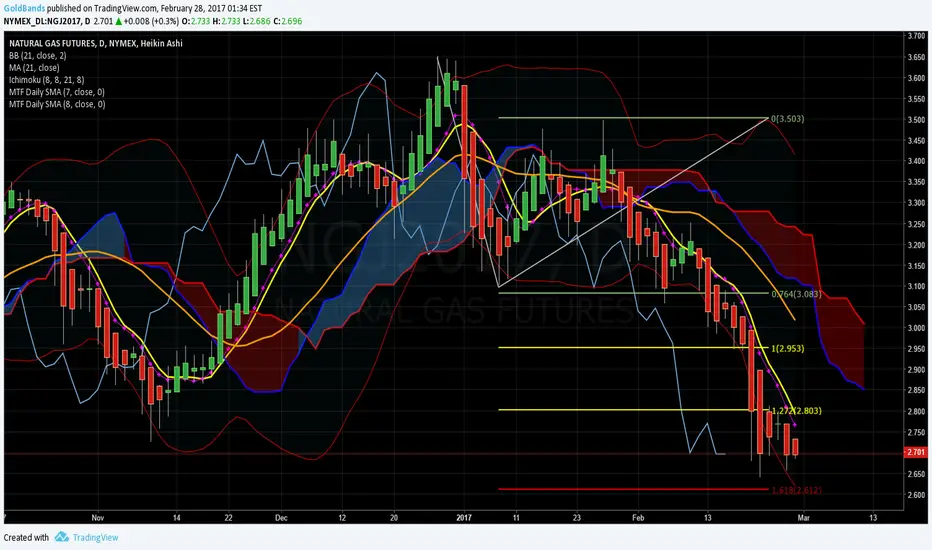
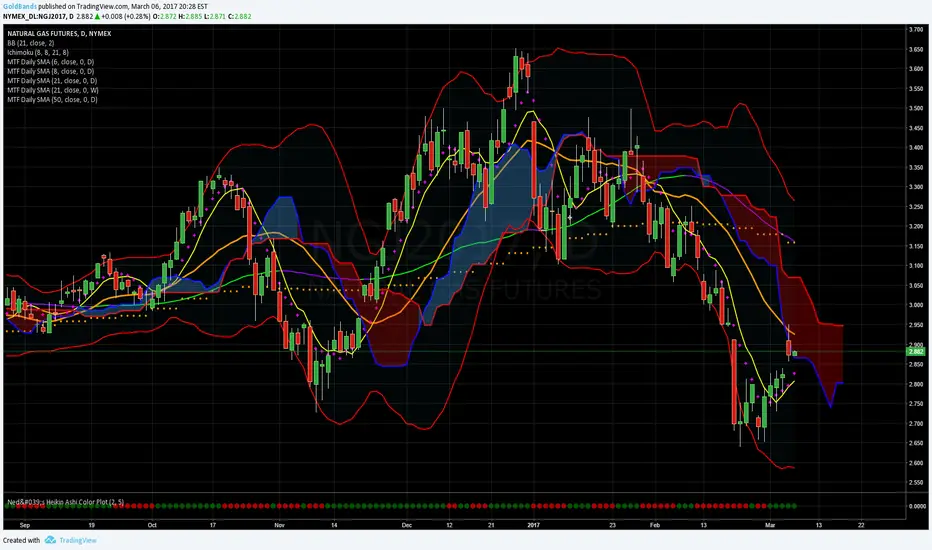
Natural Gas Continues to Descend Through the CloudNatural Gas continued to move lower and through the Ichimoku Cloud. Next stop looks like the 21 day moving average, the gold line in the middle of the cloud. Remember, hitting the 21 day moving average after a breach of the 8 day moving average, is a high statistical probability.
Disclaimer: This post is for educational purposes only. Trade at your own risk.

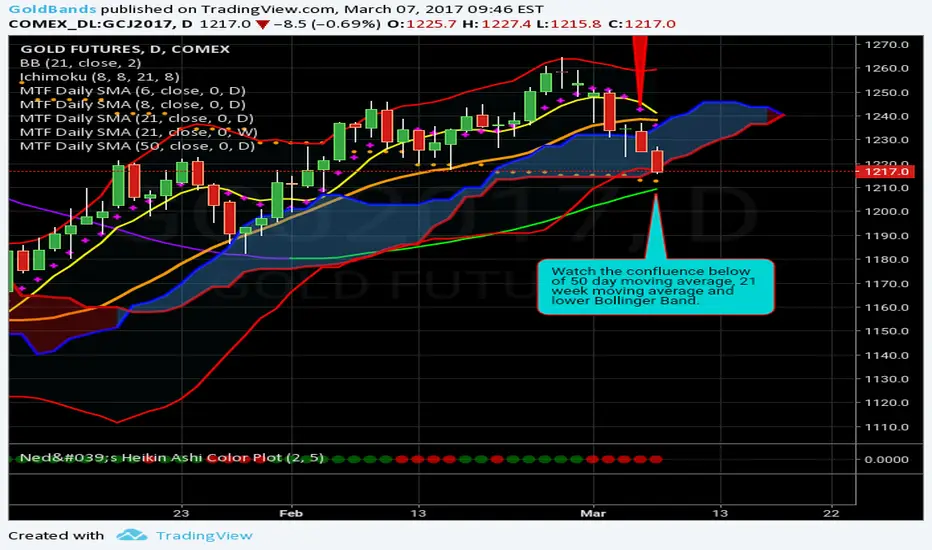
Gold Closes Higher in Wake of Fed Rate HikeGold closed 6.6 points higher in the first full day of trading after the Fed announced a new interest rate hike. Price closed above many of the moving averages, including the 6, 8 50 and 100. It also closed above the 21 week moving average. In addition, as I called out yesterday, price did tag the 21 day moving average as was expected after the close above the 6 day moving average yesterday. However, price was not able to close above the 21 day and this is keeping me from being 100% certain of this bull move. However, I am long and I do expect that price will move up and tag the upper bollinger band.
Also notice that the signal line on the stochastic indicator at the bottom of the chart is now above the 20 line and has crossed over the slow line. And also crossing is the 50 over the 100 day moving average. Lots of indication that a bull move is now starting.
The Heikin-Ashi view shows that we have completed 2 green days now and Friday starts with another strong green candle.
Price did touch that POC on the short and intermediate term Volume Profiles. Let's see if Gold can overcome that resistance level and roll above it.
Finally tonight I'd like to look at the dollar index. We now have a solid Heikin-Ashi candle under the Ichimoku cloud and right at the lower Bollinger Band. If the dollar index can continue to moving lower, look at the 200 day moving average (blue line) below at 98.35 as a target. That would be good indeed for the Gold bulls.
Disclaimer: This post is for educational purposes only. Trade at your own risk.

Gold Opens LowerGold continues descending through the cloud. Let's see what happens at the bottom. There could be a mid morning bnounce back up.
Natural Gas Gaps Up to Start the WeekNatural Gas gapped up Sunday night to open the week. After touching the 21 day moving average, natgas closed lower, just outside the cloud. I closed my position near the high of the day, taking profits. I am now flat, watching to see what happens during the week.
Natural Gas Gaps Down to Start the WeekNatural Gas gapped down at the opening of trading on Sunday and continued it's selloff. While this bearish move is overextended, there's no indication yet of any kind of retracement. The doji candle last Friday is now signaling more downside movement.