Deep Dive Into Bollinger Bands 🗓This article explores the Bollinger Bands indicator—a powerful volatility tool used by traders worldwide. You'll learn how it works, how to calculate it, and how to use it to detect potential breakouts, trend reversals, and overbought or oversold conditions in the market.
📚 Introduction to Bollinger Bands
In the fast-paced world of trading, understanding market volatility is key to making informed decisions. Bollinger Bands, developed by John Bollinger in the 1980s, offer a visual and statistical method to measure this volatility. Unlike simple moving averages, which only tell you the trend, Bollinger Bands expand and contract based on recent price action, helping traders spot overbought, oversold, or consolidation phases.
These bands dynamically adjust to market conditions, making them one of the most popular indicators for trend-following, mean-reversion, and breakout strategies. Whether you’re trading crypto, stocks, or forex, Bollinger Bands can help you identify high-probability setups by combining trend direction with volatility.
📚 How Bollinger Bands Are Calculated
Bollinger Bands consist of three lines:
Middle Band – This is a simple moving average (SMA) of the price, typically over 20 periods.
Upper Band – The middle band plus two standard deviations.
Lower Band – The middle band minus two standard deviations.
Middle Band = SMA(n)
Upper Band = SMA(n) + (k × σₙ)
Lower Band = SMA(n) - (k × σₙ)
Where σₙ is the standard deviation of the price for n periods and k is the multiplier, typically set to 2, which captures ~95% of price action under normal distribution. The middle band shows the average price over the last 20 candles. The upper and lower bands adjust based on how volatile the price has been — expanding in high volatility and contracting in low volatility.
🤖 For those traders who want to implement Bollinger Bands into algorithmic strategy we provide formula it's calculation in Pine Script:
basis = ta.sma(src, length) // Middle Band (SMA)
dev = mult * ta.stdev(src, length) // Standard Deviation × Multiplier
upper = basis + dev // Upper Band
lower = basis - dev // Lower Band
📚 How to Use MACD in Trading Strategies
⚡️Bollinger Band Squeeze (Volatility Contraction and Expansion)
The idea is pretty simple, а squeeze indicates low volatility and often precedes a breakout. The squeeze is the situation when the Upper Band and Lower Band contract, and BB width is at a local minimum. In this case you shall be prepared for the high volatility after the period of low volatility. This strategy doesn’t predict direction — it prepares you for volatility.
Long setup:
Price is in long-term uptrend, you can use 200 EMA as a major trend approximation - price shall be above it.
Bollinger Bands is narrow in comparison to the previous period. Price usually is in sideways.
Open long trade when candle shows a breakout and closes above the Upper Band.
Set a trailing stop-loss at the Middle Band.
Short setup:
Price is in long-term downtrend, you can use 200 EMA as a major trend approximation - price shall be below it.
Bollinger Bands is narrow in comparison to the previous period. Price usually is in sideways.
Open short trade when candle shows a breakdown and closes below the Lower Band.
Set a trailing stop-loss at the Middle Band
📈Long Trading Strategy Example
1. Price candle shall be closed above 200-period EMA. In our example we have BITMART:BTCUSDT.P 4h time frame.
2. Bollinger Bands shall be narrow in comparison with the previous periods.
3. Open long trade when candle closes above the Upper Band.
4. Close trade when price touched the Middle Band.
📉Short trading strategy example
1. Price candle shall be closed below 200-period EMA. In our example we have BITMART:BTCUSDT.P 4h time frame.
2. Bollinger Bands shall be narrow in comparison with the previous periods.
3. Open short trade when candle closes below the Lower Band.
4. Close trade when price touched the Middle Band.
⚡️Mean Reversion (Rebound from the Bands)
This is the most common approach to use Bollinger Bands. The idea is also very simple, we just want to open long if price touches Lower Band and short if price reaches Upper Band. Price tends to revert to the mean (Middle Band), especially in range-bound markets. It's very important to trade in the direction of the major trend to reduce the probability of the large move against you.
Long setup:
Price is in long-term uptrend, you can use 200 EMA as a major trend approximation - price shall be above it.
Open long trade when price touches the Lower Band.
Set the initial stop-loss at the fixed percentage below entry price. Choose this percentage number with your personal risk/money management, you shall be comfortable to lose this amount of money in case of stop-loss hit.
If price reached Middle Band set stop-loss at breakeven.
Close trade when price reached the Upper Band.
Short setup:
Price is in long-term downtrend, you can use 200 EMA as a major trend approximation - price shall be below it.
Open short trade when price touches the Upper Band.
Set the initial stop-loss at the fixed percentage above entry price. Choose this percentage number with your personal risk/money management, you shall be comfortable to lose this amount of money in case of stop-loss hit.
If price reached Middle Band set stop-loss at breakeven.
Close trade when price reached the Lower Band.
🧪 Important: the most common approach to close trades is the Middle Band touch, this is classic mean reversion. We experimented multiple times with different approached and revealed that usually it's better to take profit at the Upper/Lower band for long/short trades and use Middle Band only for setting stop-loss at breakeven. This approach provides better risk to reward ratio.
📈Long Trading Strategy Example
1. Price candle shall be closed above 200-period EMA. In our example we have BITMART:BTCUSDT.P 4h time frame.
2. Open long trade the Lower Band.
3. Put Initial stop-loss 2% below the entry price.
4. When price reached Middle band place stop-loss at the breakeven.
5. Close long trade at the Upper Band.
📉Short trading strategy example
1. Price candle shall be closed below 200-period EMA. In our example we have BITMART:BTCUSDT.P 4h time frame.
2. Open short trade the Upper Band.
3. Put Initial stop-loss 2% above the entry price.
4. When price reached Middle band place stop-loss at the breakeven.
5. Close short trade at the Lower Band.
🧪 Important tip: notice that initial stop-loss is needed only to avoid disaster in case of price moves strongly against you. This percentage shall give enough space to avoid its reaching too often. Mean reversion strategy provides fast trades with the small average gain, so you shall maintain the high win rate (perfectly above 70%). You have to choose stop-loss based on particular asset volatility.
⚡️Combined Approach: Mean Reversion + Trend Following
Skyrexio made multiple researches about Bollinger Bands strategies and we found that we can receive better gains in combination of different approaches. Mean reversion gives you great entry with discount but you don't need to exit that early. Use the trading stop and allow to gain profit while market is moving in your direction.
This approach you can find in our advanced strategy Bollinger Bands Enhanced Strategy which we shared in 2024. Click on the link to read about it and understand how you can combine best features of this popular indicator.
📚 Conclusion
Bollinger Bands are more than just a volatility indicator — they provide a flexible framework for understanding price dynamics and market conditions. By visualizing the relationship between price and standard deviation around a moving average, traders can gain valuable insights into whether an asset is consolidating, trending, or preparing for a breakout.
The real strength of Bollinger Bands lies in their versatility. They can adapt to different trading styles — whether you’re a short-term scalper, a swing trader, or a long-term position holder. From identifying squeeze setups to riding strong trends or capturing mean reversion moves, BBs offer a strategic edge when used correctly.
However, Bollinger Bands should never be used in isolation. Like any technical tool, they work best when combined with momentum indicators like RSI or MACD, volume analysis, and price action signals. Context is key: a signal that works well in a ranging market may fail during high momentum trends.
Ultimately, Bollinger Bands help traders make more informed, disciplined decisions by clarifying where price stands relative to recent history. When paired with sound risk management and broader market awareness, they become a powerful ally in navigating market uncertainty.
Bollingers

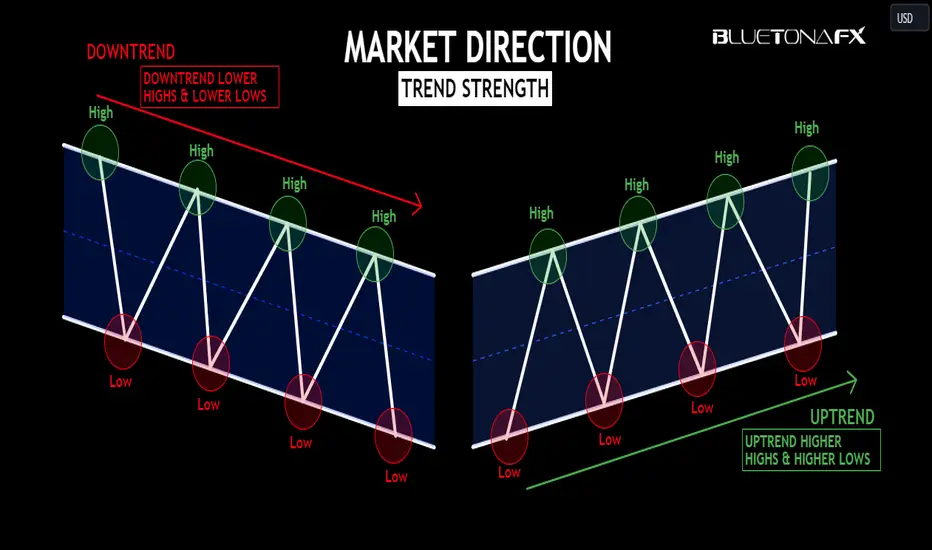
Market Direction - Trend StrengthThe strength of a trend can be a key factor in predicting future price movements. This post will specifically cover how to identify trends, how to determine trend strength, and how to use it to your advantage when trading the markets.
Characteristics of a Trending Market
To begin, let us understand how to identify a trending market.
A trending market is a market that is either making higher highs followed by higher lows (UPTREND) or lower lows followed by lower highs (DOWNTREND).
What does this typically look like? Let's see:
Uptrend
Downtrend
Now that we understand how to identify uptrends and downtrends, let's delve further and discuss how to use trend strength to your advantage when trading the markets.
Fibonacci Retracement Tool
The Fibonacci retracement tool is used in trending markets to determine how strong the trend is. It uses natural numbers to determine the high-probability price levels that the market will hit and continue in its initial direction. This method will use four Fibonacci levels: 38.2%, 50%, 61.8%, and 78.6%.
One thing to mention is that in a trending market, the chart is made up of two waves: impulsive and retracement. After an impulsive wave, a retracement wave will usually form; after a retracement wave, the impulsive wave will usually form.
The impulsive wave represents the strong momentum of buyers and sellers. The retracement wave shows the weakness of buyers and sellers.
Therefore, we must look at the retracement wave when it comes to deciding the strength of a trend. For example, in an uptrend, the impulsive wave will be bullish; therefore, the retracement wave will be bearish. In a downtrend, the impulsive wave will be bearish; therefore, the retracement wave will be bullish.
The retracement wave shows the strength of the opposite side of the market. For example, if the impulsive wave is bullish, buyers are stronger. Then, in the retracement wave, sellers will try to dominate the buyers.
Therefore, the deeper the retracement goes, the stronger sellers will be than buyers, and the weaker the bullish trend strength will be.
With the Fibonacci retracement tool, there are three scenarios to determine trend strength:
Strong Trend Strength: 38.2% Fibonacci Retracement
Moderate Trend Strength: 50%–61.8% Fibonacci Retracement
Weak Trend Strength: 78.6% Fibonacci Retracement
The above examples show why the Fibonacci retracement tool can be extremely effective in determining not only how strong a trend is, but also how likely it is to continue past the beginning of the impulsive wave.
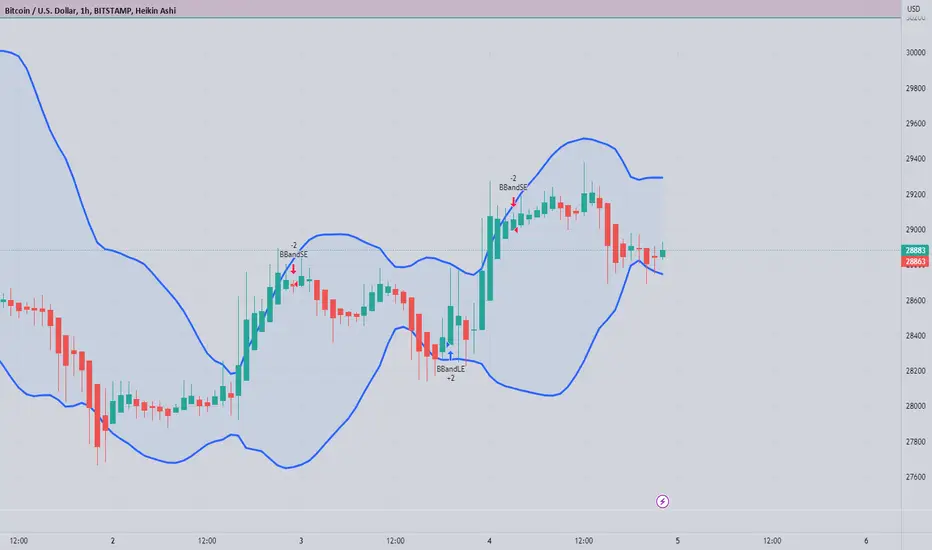
Bollinger Bands
Bollinger Bands are very effective in reading trend strength. Bollinger Bands are based on price volatility, which means that they expand when the market is trending and there are big prices, and they contract during sideways consolidations when the market ranges.
Bollinger Bands consist of two outer bands (top and bottom bands) on each side and a moving average in the centre between the outer bands (middle band).
One of the main reasons Bollinger Bands are so effective in reading trend strength is that they do not lag as much as other indicators because they always change automatically with the price.
Three important points to note when using Bollinger Bands to read trend strength:
If price pulls away from the outer band and heads towards the middle band as the trend continues, this is a key indication that the trend strength may be weakening.
During strong trends, prices stay close to the outer band and significantly away from the middle band.
Repeated pushes into the outer bands that do not actually reach the band indicate a lack of trend strength.
Let's see a chart example of Bollinger Bands reading trend strength:
As you can see, using Bollinger Bands can provide traders with very useful information about trend strength and the balance between bulls and bears.
Price Rejection
We do not always need indicators or tools to read trend strength; it is possible to do this just by looking at a naked chart. The way rejected continuations or reversals happen on charts can be a huge indicator of being able to read trend strength. Before understanding the price rejection, it is important to know about the wick or shadow of the candlestick.
Upper wick
The upper shadow shows that the price went up and then came down again. This indicates that buyers wanted to increase the price, but sellers dominated the buyers to push the price back down.
Lower wick
The lower shadow represents that the price went down and then came back up. This indicates that sellers wanted to lower the price, but buyers dominated the sellers to push the price back up.
Identifying price rejection
Traders should first wait for the price to reach a strong support or resistance level. Then, at the support or resistance level, candlesticks will likely make wicks opposite the trend due to the strength of the level. For example, wicks or shadows will form on the upper side at the resistance zone, while at the support zone, wicks or shadows will form on the lower side of the candlesticks.
These wicks or shadows are identified as price rejections in the market.
Price rejections are very important, especially in identifying trend strength, because they accept or reject the identification of key levels in the market. For example, if you are unsure whether a support zone will hold or break, you can see whether price rejection will occur at that level.
Let's see a chart example of price rejection and how you can use it to identify trend strength:
The chart above is proof alone that trend strength can be identified by just looking at the price action of a chart.
Understanding the strength of a trend does not have to be complex. Trend strength can be identified simply by using the three different techniques we have covered in this educational post.
The best thing we can all do as traders is to be simplistic and not overcomplicate things; this becomes especially easier when you accept that nothing in the market is certain.
Each market has its own unique market conditions and will not trade rationally all of the time. Therefore, when a trade does not go your way even though your trend strength signals were high and you followed the market, understand that it is just one trade and that the market is completely neutral. It is neither personally on your side nor personally against you.
Trade safely and responsibly.
BluetonaFX
Bollinger Bands; Key to boost your profitThe Bollinger Bands indicator is one of the popular technical analysis tools used in Forex trading. Here are some ways you can use Bollinger Bands in Forex trading:
Identifying support and resistance levels
The Bollinger Bands indicator can help you identify support and resistance levels. If the price of a currency pair approaches the lower line of the Bollinger Bands, this may suggest that it is a support level. On the other hand, when the price approaches the upper line, it may suggest that it is a resistance level. You can then look for confirmation of these levels using other indicators or technical analysis methods to decide whether to enter a long or short position.
Identifying trends
The Bollinger Bands indicator can also help you identify trends. If the price of a currency pair exceeds the upper line of the Bollinger Bands, it means that the uptrend will continue, and if the price falls below the lower line, the downtrend will continue. Then you can look for confirmation with other indicators or technical analysis methods to decide whether to enter a long or short position.
Price fluctuation analysis
The Bollinger Bands indicator can also help you analyze price fluctuations. When the prices of a currency pair are close to the lower Bollinger Bands line, it means that the currency pair is undervalued, so you can consider buying. On the other hand, when prices are near the upper line of the Bollinger Bands, it means that the currency pair is overvalued, so you can consider selling.
Detecting periods of volatility
The Bollinger Bands indicator can also help detect periods of volatility. When the Bollinger Bands lines are narrowed, it means that the currency pair is in a period of low volatility, so this may suggest that the following trend or price movement may be sharp. On the other hand, when the lines are widened, it means that the currency pair is in a period of high volatility, so the price movement may be more stable.
In conclusion, the Bollinger Bands indicator can be a useful tool in Forex technical analysis. It can help identify support and resistance levels, identify trends, analyze.
At Manticore investments we use it in conjunction with Haiken Ashi candles and RSI in our scalping - swing strategy. This combination allows us to more effectively read the supports and resistances of the bollinger bands and whether the price will break through them or not.
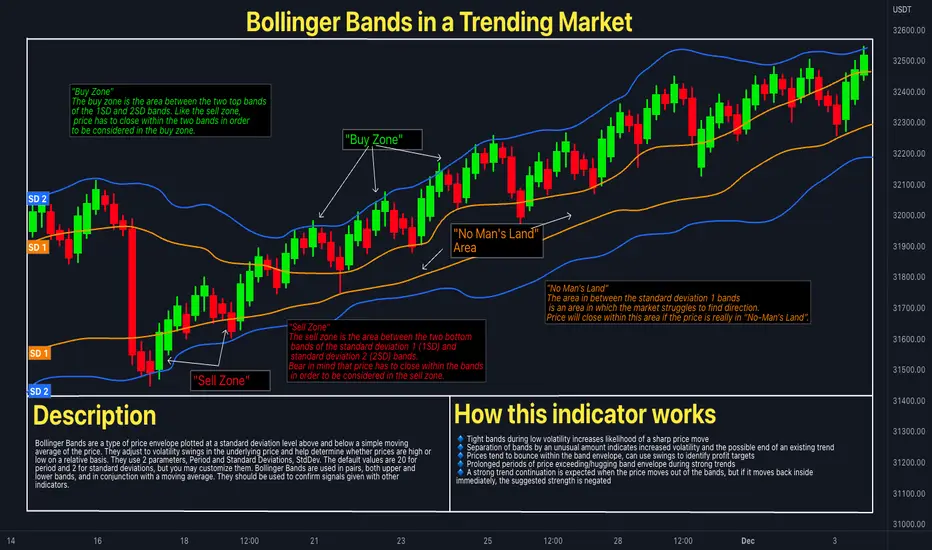
📊Bollinger Bands In A Trending MarketBollinger Bands are a widely used chart indicator for technical analysis created by John Bollinger in the 1980s. They offer insights into price and volatility and are used in many markets, including stocks, futures, and currencies. Bollinger Bands have multiple uses, such as determining overbought and oversold levels, as a trend following tool, and for monitoring for breakouts.
📍 Strategy
Bollinger Bands measure deviation and can be helpful in diagnosing trends. By generating two sets of bands using different standard deviation parameters, traders can gauge trends and define buy and sell zones. The bands adapt dynamically to price action, widening and narrowing with volatility to create an accurate trending envelope. A touch of the upper or lower band is not a signal in and of itself, and attempting to "sell the top" or "buy the bottom" can lead to losses. Standard deviation is a statistical measure of the amount of variation or dispersion of a set of prices or returns from its average value. The higher the standard deviation, the wider the Bollinger Bands, indicating greater price volatility, and vice versa. Traders may use standard deviation to set stop-loss and take-profit levels or to help determine the risk-to-reward ratio of a trade.
📍 Calculation
First, calculate a simple moving average. Next, calculate the standard deviation over the same number of periods as the simple moving average. For the upper band, add the standard deviation to the moving average. For the lower band, subtract the standard deviation from the moving average.
Typical values used:
Short term: 10 day moving average, bands at 1.5 standard deviations. (1.5 times the standard dev. +/- the SMA)
Medium term: 20 day moving average, bands at 2 standard deviations.
Long term: 50 day moving average, bands at 2.5 standard deviations.
👤 @AlgoBuddy
📅 Daily Ideas about market update, psychology & indicators
❤️ If you appreciate our work, please like, comment and follow ❤️
Bitcoin price leveling outUsing Bollinger bands with momentum on the 1 hour and 4 hour time frames for dollar cost averaging, it seems that Bitcoin is beginning to level out and stabilize in price action.
This could be the bottom of this downward trend we have seen since the middle of November of 2021, however, I believe caution needs to be used and careful planning. Based upon the market's recent events of unpredictability and unstable volatility, I believe dollar cost averaging is the best approach over the long term in dealing with this unusual market while protecting your investment.
Whether or not this trend continues, it really doesn't matter as this is a good middle range point to pick up a few more positions in it for either a nice little profit if the market does rise, or a stable accumulation point for a continued downtrend.
The only thing that is really clear at the moment, is that the market is at a pivotal point. Risk mitigation and budget management skills are a requirement as this really could go either way.
