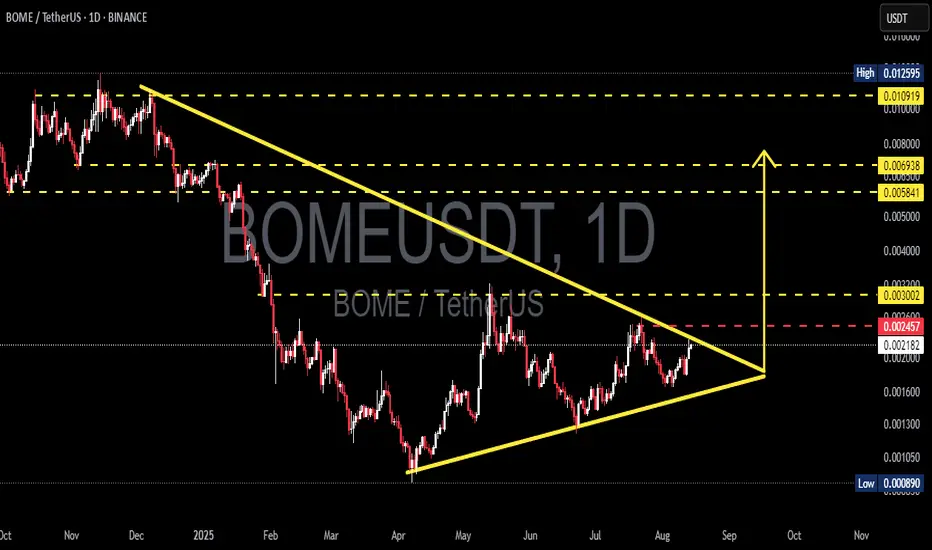
BOME/USDT — Symmetrical Triangle on the Verge of a Explosion?BOME/USDT has spent the past several months moving inside a Symmetrical Triangle pattern, formed by a series of lower highs from the peak around 0.0125 and higher lows from the April 2025 bottom at 0.000890.
This formation signals a major consolidation phase where buying and selling pressure are converging toward a single decision point (apex).
When price action approaches the tip of such a triangle, it often results in a volatility surge — either to the upside (breakout) or downside (breakdown).
Currently, price is testing the critical 0.00245–0.00255 zone, which will act as the gateway to the next major move.
---
Key Levels to Watch
Major Resistance:
0.00245–0.00255 → Upper trendline + horizontal resistance.
0.003002 → Initial breakout target & historical resistance.
0.005841–0.006938 → Strong supply zone from the previous rally.
0.010919 → Psychological target before the peak.
0.012595 → Main chart high.
Key Support:
0.00205–0.00215 → Rising trendline (dynamic support).
0.00170–0.00130 → Minor historical supports.
0.000890 → Yearly low and major support.
---
Pattern Characteristics
The Symmetrical Triangle is a neutral formation typically accompanied by:
Declining volume during consolidation.
Strong volume expansion upon breakout.
Initial move targets often equal the height of the triangle from the breakout point — providing significant upside/downside room.
---
Bullish Scenario
1. Breakout Confirmation: Daily close above 0.00255 with strong volume.
2. First Target: 0.003002.
3. Next Target: Sustained momentum → 0.00584–0.00694.
4. Extended Target: Breaking through the supply zone could drive price to 0.0109–0.0126.
5. Invalidation: Price re-enters the triangle and closes below 0.00220–0.00215.
---
Bearish Scenario
1. Rejection: Failure to break 0.00255 followed by a daily close below 0.00215.
2. Downside Target: 0.00200 → 0.00170–0.00130.
3. Breakdown Risk: A move below the rising trendline could trigger a retest of 0.000890.
4. Invalidation: Price reclaims 0.00245 and holds.
---
Trading Notes
Long consolidations like this often precede sharp moves — patience is key.
Wait for confirmation: Avoid entering prematurely; look for a clear breakout with volume.
Reward/Risk potential is attractive for swing traders in this setup.
#BOME #BOMEUSDT #Crypto #Altcoin #PriceAction #SymmetricalTriangle #Breakout #SupportResistance #ChartPattern #CryptoAnalysis
Bomeusdtperp
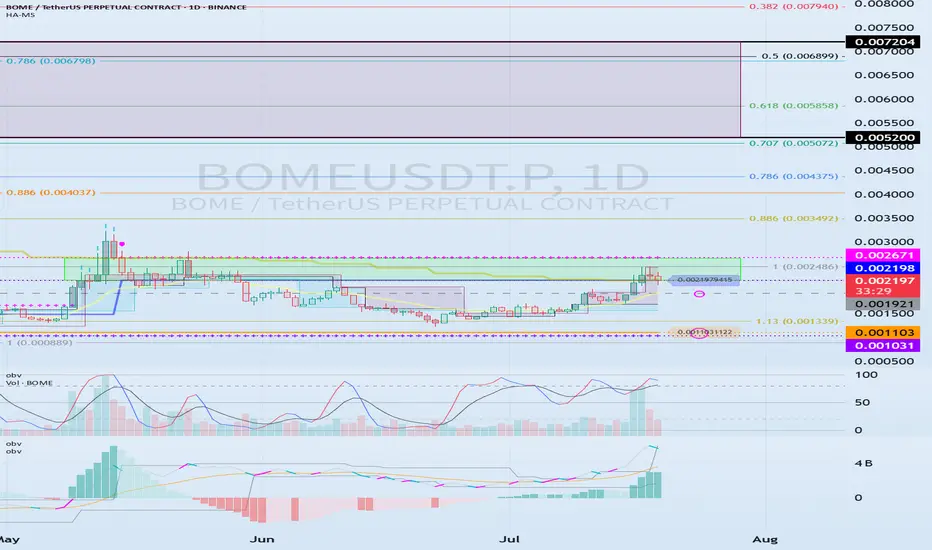
0.002198-0.002671 The key is whether it can break above
Hello, traders.
If you "Follow", you can always get new information quickly.
Have a nice day today.
-------------------------------------
(BOMEUSDT.P 1D chart)
BOME is a BOOK OF MEME, which is a meme coin and belongs to the Solana Ecosystem.
If the price breaks through the 0.002198-0.002671 section upward and maintains, it is expected to rise to around 0.005200-0.007204.
As a condition for this,
- The K of the StochRSI indicator should show an upward trend with K > D below the overbought section.
- The PVT-MACD oscillator indicator should show an upward trend. (If possible, it should be above the 0 point.)
- The OBV indicator of the Low Line ~ High Line channel should show an upward trend. (If possible, it should be above the High Line. It should maintain a state where at least OBV > OBV EMA.)
When the above conditions are met, if the 0.002198-0.002671 section breaks through upward, it is expected to continue the upward trend.
If not and it falls, you should check if it is supported near 0.001921.
This is because I think that the upward trend can continue if it receives support near the 0.001921 point, which is the volume profile section.
Therefore, if it falls below 0.001921, you should stop trading and watch the situation.
You can trade with a SHORT position in futures trading, but since it falls below the volume profile section, you should be aware of the volatility.
Therefore, if you insist on trading, a short and quick response is required.
-
(15m chart)
The trading method is simple.
Buy near DOM(-60) ~ HA-Low, and sell near HA-High ~ DOM(60).
However, if it falls from DOM(-60) ~ HA-Low, it is likely to show a stepwise downtrend, and if it rises from HA-High ~ DOM(60), it is likely to show a stepwise uptrend.
Therefore, you should maximize your profits by taking a split transaction format.
Other indicators can be used as points where you can conduct split transactions depending on the situation.
That is, sell about 25% at the support and resistance points drawn on the 1M, 1W, and 1D charts, and sell about 10% at the support and resistance points on the 15m chart to maximize your profits.
While conducting transactions in this manner, you may wonder if you can actually drag the transaction to around 0.005200-0.007204, but it is possible.
It is good to hold to make a big profit, but since the current price range is in the support and resistance range, I think it is an unstable range to just hold.
-
Thank you for reading to the end. Wishing you a successful trade.
--------------------------------------------------
BOMEUSDT 1DBOME ~ 1D Analysis
#BOME This trade is very high risk. Buy gradually from here with a short -term target of at least 10%+.
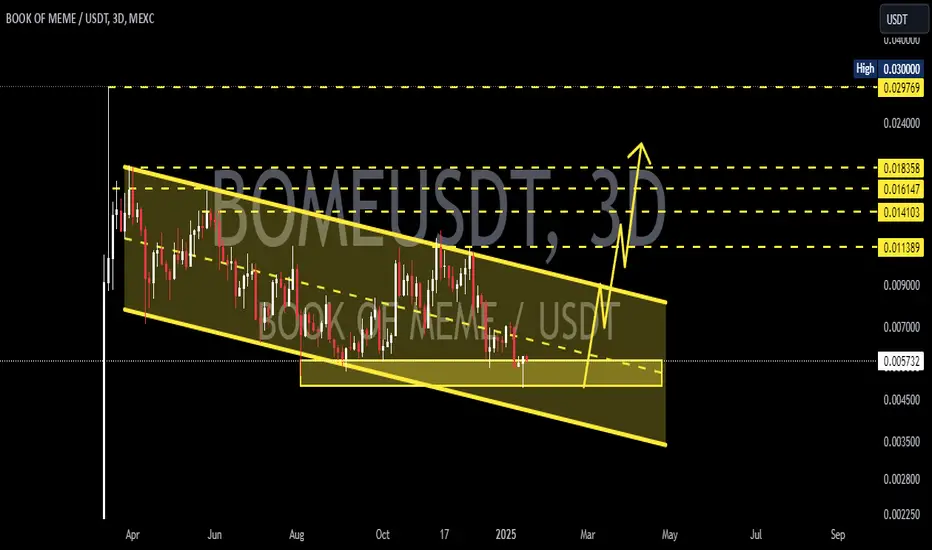
BOMEUSDT 3DBOME ~ 3D
#BOME This trade is very high risk. But if you still have Conviction on this coin,. This support block is very attractive to start buying back,.
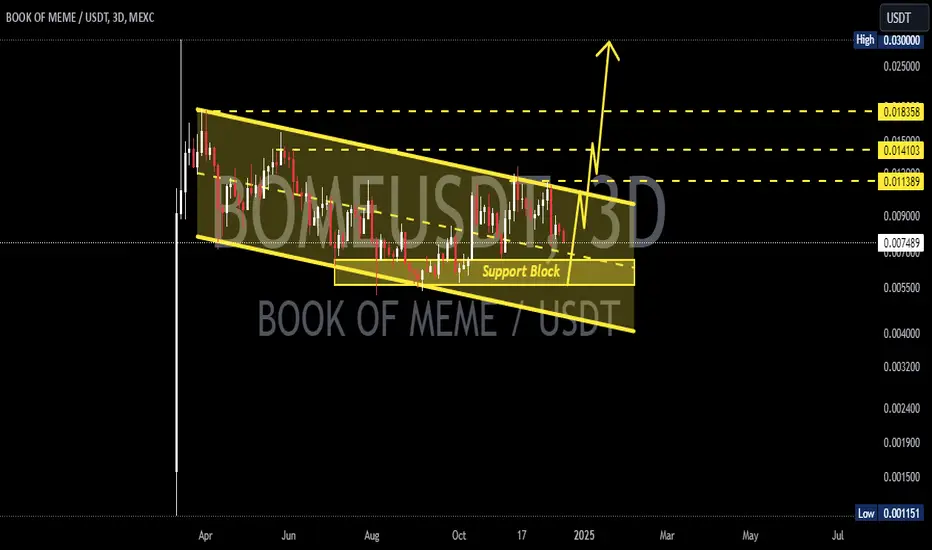
BOMEUSDT 3DBOME ~ 3D
#BOME Still rejected from the resistance line of this pattern. If you still have Conviction on this coin,. This support block would be a very good buying place for now,. With a minimum target of 20%++
BOME to the athBOME is one of MEME coins, alt season is here and meme should go like every alt season. TA and PA is bullish
NOT A FINANCIAL ADVICE
ALWAYS USE STOPLOSS AND MANAGE YOUR RISK
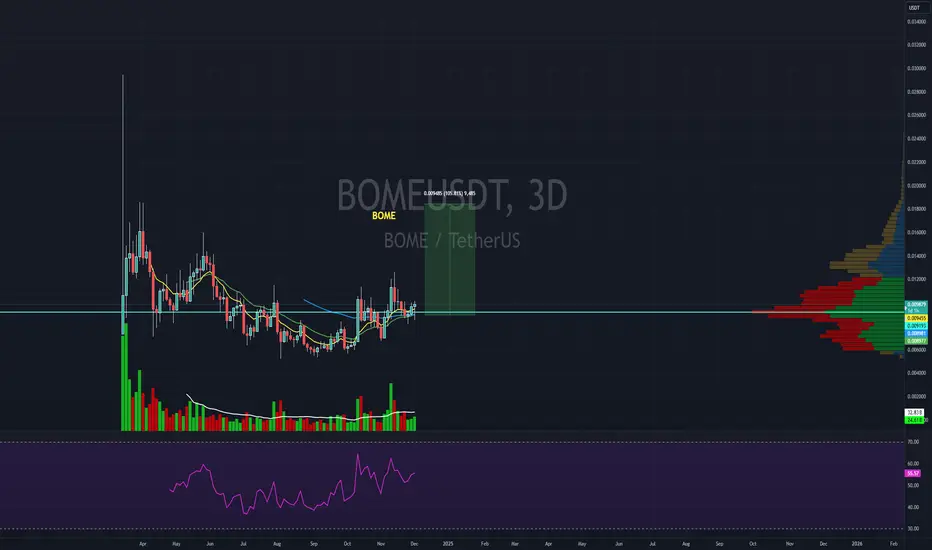
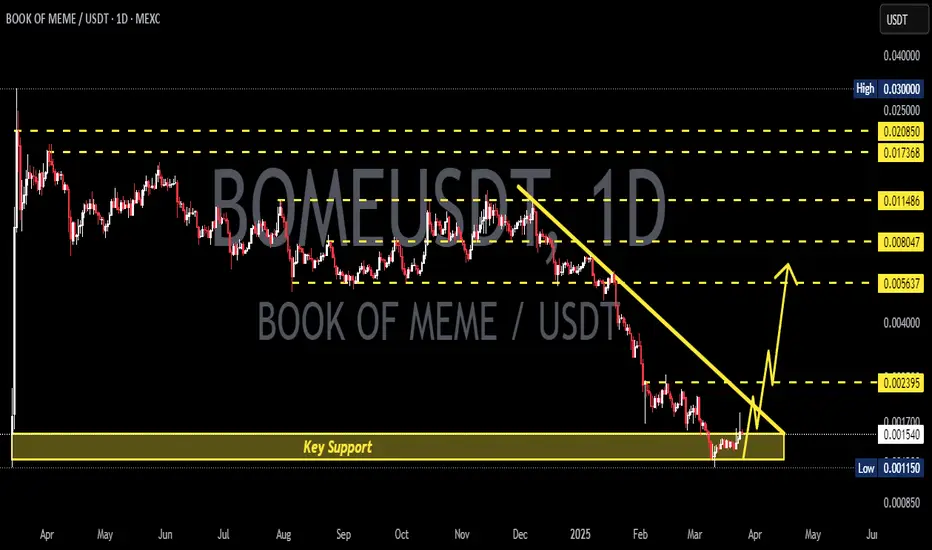
Book of Meme BOME price looks "tasty"#BOME is another #Solanamemcoin that looks good.
It's a little expensive now, but if the price of OKX:BOMEUSDT drops to at least 0.0077-0.0081, it will be just right to take a “tasty” long.
🔝 And the prospects for #BOOKofMeme price growth are at least +250-300%.
_____________________
Did you like our analysis? Leave a comment, like, and follow to get more
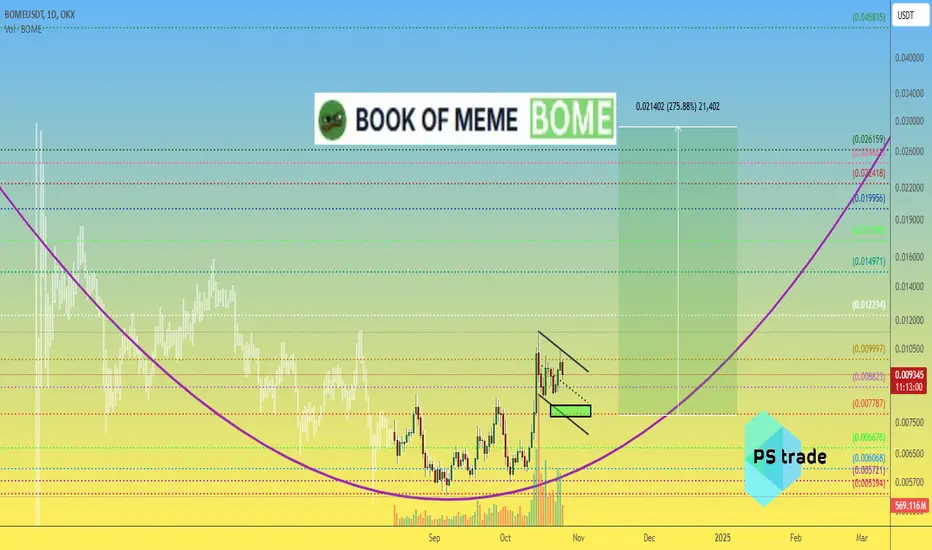
BOMEUSDT - The Next Memecoin Rocketing on the Solana Wave!BOMEUSDT, the trending memecoin on the Solana blockchain, is capturing attention as Solana itself starts to surge. With a breakout on the horizon, this coin is poised for a potential trend change that could lead to significant gains. As the Solana ecosystem heats up, all eyes are on BOMEUSDT.
Now's the time to watch for key resistance levels—if they break, we could see explosive movement. Stay tuned and be ready to ride this wave, but remember to manage your risk!
BOMEUSDT Currently trading at $0.0081
Buy level: Above $0.0082
Stop loss: Below $0.0067
TP1: $0.0099
TP2: $0.011
TP3: $0.014
TP4: $0.018
Max Leverage 3x
Follow Our Tradingview Account for More Technical Analysis Updates, | Like, Share and Comment Your thoughts

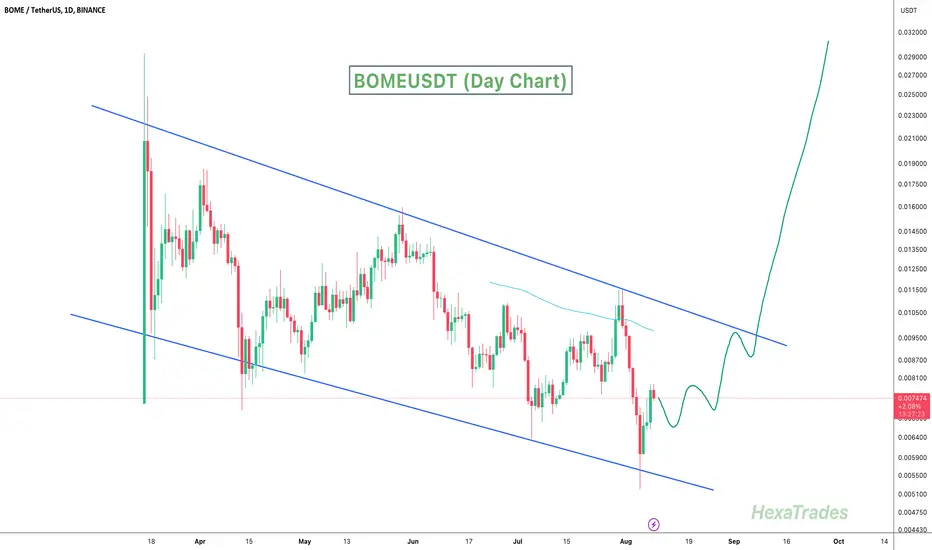
BOMEUSDTBOME ~ 1D
#BOME This green gem meme is moving in a descending channel for now.
We have Conviction on this green gem which will performance when the bulls have returned.
Perhaps small gradual buying is very attractive in this descending channel, bulls will be in control when this descending channel is successfully broken.
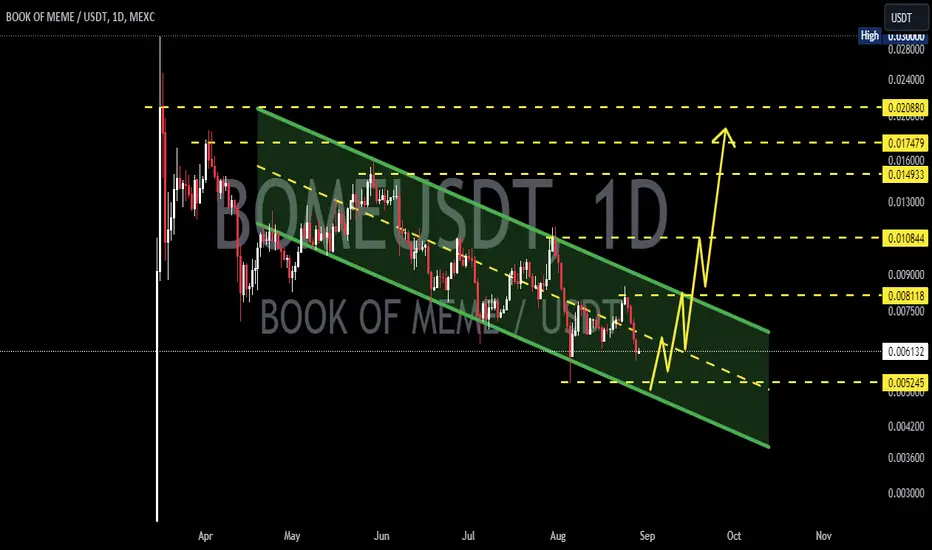
BOMEUSDT Descending ChannelBOMEUSDT technical analysis update
BOME price has been trading inside a descending channel pattern for the last 150 days and is now bouncing off the channel support line. We can expect a bullish move from the current level. If the price breaks out of the channel pattern, we can expect a strong bullish move in BOME.
Regards
hexa