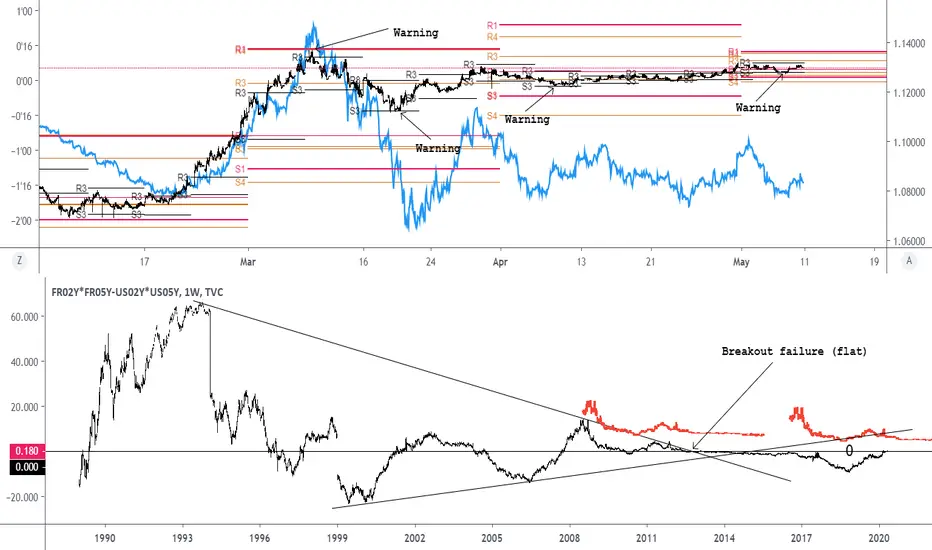
FR US yields vs EURUSDInterest rates are crucial in the movement of currencies. The blue is EURUSD. Those things are not 100 percent correlated but it is something that needs to be paid attention to.
In this post I will demonstrate the relationship between French American bond yields (interest rates) differential and EURUSD.
We use 2 principal yields 2 yearly and 5 yearly composite differential.
As you see, once the yields differential hits the resistance or reversal level (here we use DeMark and Camarilla reversal levels) - there is a reaction in EURUSD. EURUSD keeps moving some 30 pips more (fakeout?) and then turns as well.
On weekly differential chart we see that the differential is at 0 level after a poor bullish breakout. There is also fractal pattern in play.
We also see DeMark monthly pivot squeeze on 60 min (DeMark squeeze predicts volatility and turns in the markets).
You may also use German yields instead of French ones - not much difference actually.
Both American and European yields are in their lowest levels. German ones dropped below 0.
Bondyields
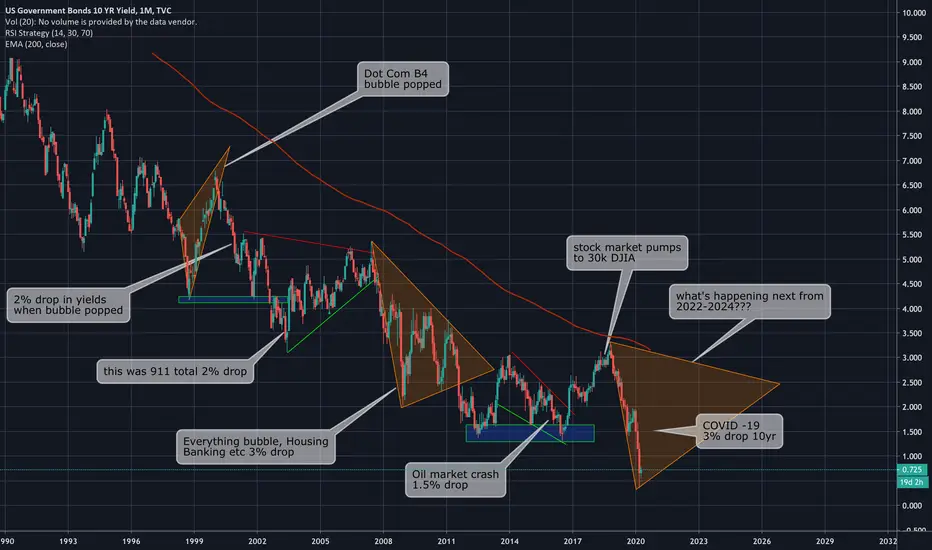
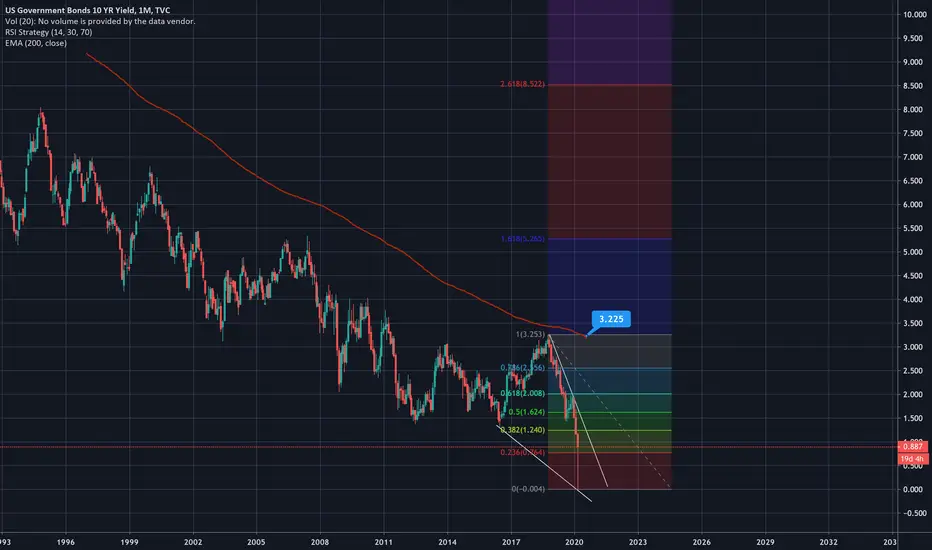
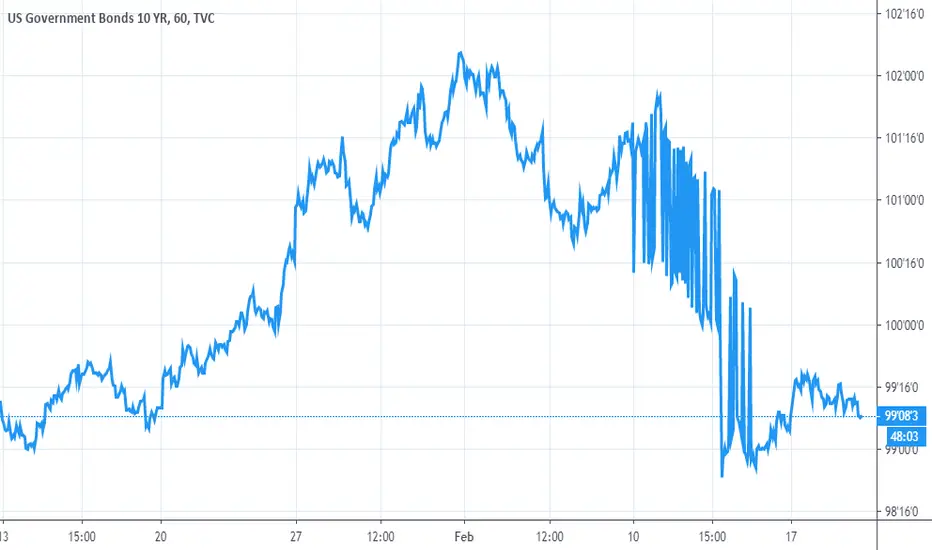
US 10Y Bond Yield - Lets Get Down To BusinessIf this is the bottom of bond yields. (See Related Idea)
If this is a 1-2 pattern.
If this is an ending diagonal in the latter half of the correction.
Then we are in for some turbulent times.
They cannot keep these rates down much longer.
This is a spring loaded knife ready to get violent.
Won't be long before we see the end of this.

Bond Yields Birds Eye View - General OverviewThis looks like a possible bottom in the bond yields aka interest rates.
Yet another ending diagonal.
Waiting for a couple more confirmatory waves to form before I post an update.

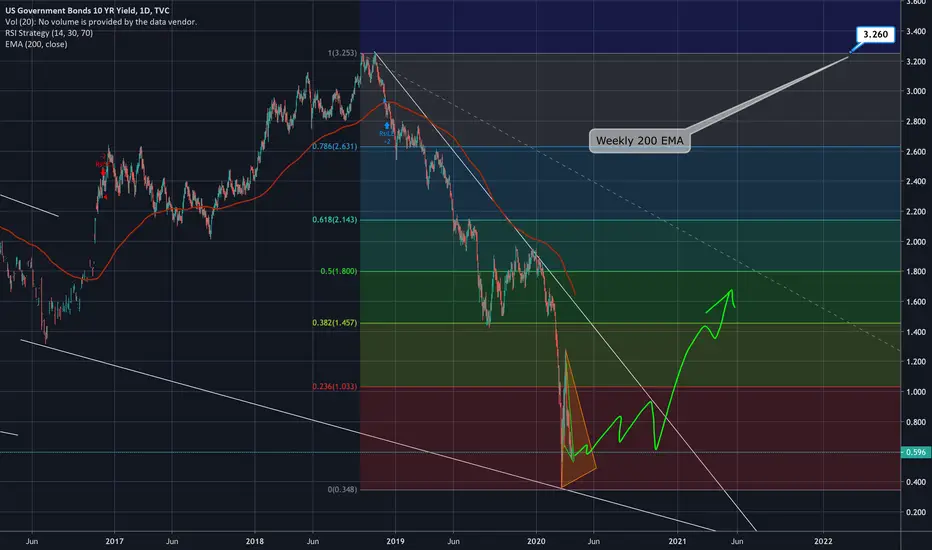
US10YJust doing a bit of analysis and you can all see what I think I've found, so this begs the question is the bottom in on stock market?
And if yes the market has in fact bottomed WTF is going to happen in 2-3 years from now?
10 yr10 year looks ready to break up which could be signaling risk on will be back over the next 2-3 years Fam
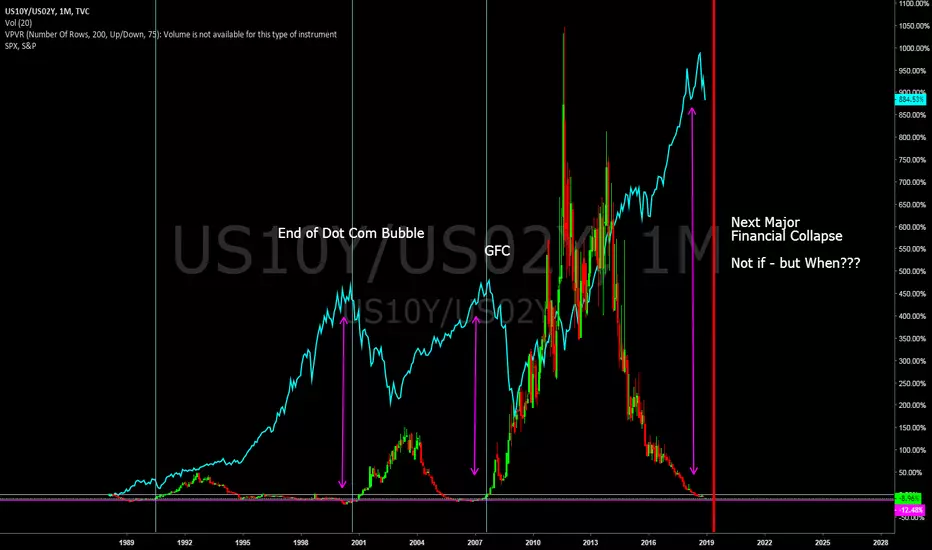
Relationship between US10Y/US02Y Bond yields and the S&P50010/2 year US bond yield ratio is once again approaching 1 and we have already had inversion between the 5/3 yield ratio. Is generally an early indicator of recession.
S&P500 is once again showing volatility after a very extended bull run.
Next major financial collapse is now simply a matter of time.
10 yr yieldI honestly think this is a BTFD here fam the 10 yr looks primed to reverse. And this implies the stock market will boom long term heading into 2021-2024 when the yield finally tests the 200 ema and probably fails leading to another big crash. I think a Trump victory in 2020 all but solidifies this narrative that I am looking at here with the 10 yr

US 2Y yield indicates further FED cuts are almost guaranteedThe FED has already cut the rates by 50 bps in an "emergency meeting" last week. The US02Y indicates that that was not enough and more cuts are needed. If history is any indication, we're looking at another cut of 50 bps or even 75 bps very soon .

Long The Dips On BondsWith the markets pricing in a 95% chance of a 25bps to 50bps rate cut, longing 20 year bonds seems like one of the highest confidence trades in the market.
I am bullish on 20 year bonds specifically, and will continue to be until we see a rate hike which I believe is far, far away. We are likely heading into a global recession within the next 12-18 months, so I rather be on the long side of risk-off assets in anticipation of a move higher.
Junk bonds high risk as economy deteriorates and spreads widenWith inflation rearing its head of late, and sectors of the economy prone to deteriorate due to coronavirus, narrow junk bond spreads will likely widen - pushing down the prices of high yield bonds.
US 10 year Treasuries at most risk as yield curve inverts.The short end of the bond market and very long end are safest bets. But inflation pressure and slowing economy will cause the 10 year yields to rise and prices to fall.
US 10 year bonds high risk as yield curve shifts (inverts?)Safety in the bond market is at the very short end (as short rates rise, can reinvest at higher rates) and the very long end (rates should decline as economic news deteriorates due to stalled Chinese economy). Most risk is in the 10 year range.


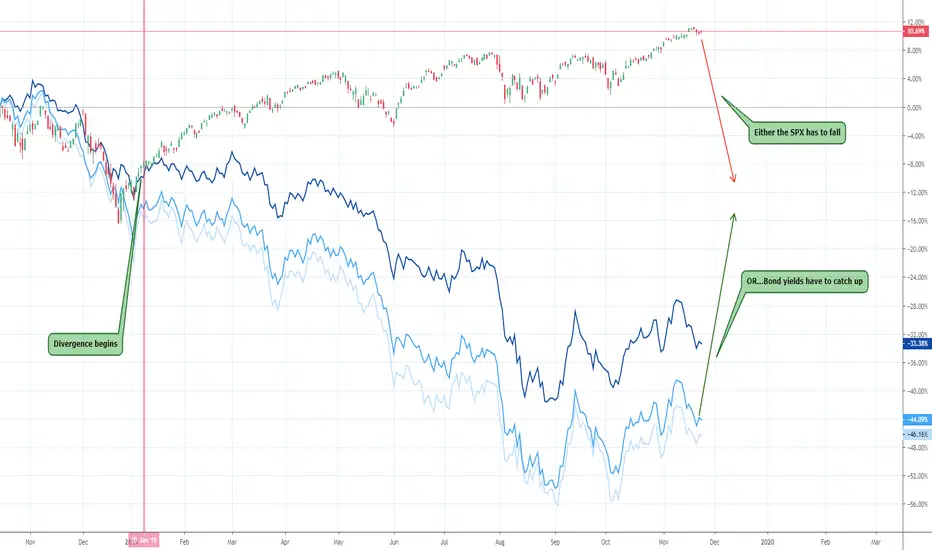
The correlation: Bond yields indicate SPX CORRECTIONUS treasury yields and the S&P 500 have a positive correlation. The two usually move lockstep to a certain degree and when they diverge, they don't stay divergent for too long.
This time, however, at the beginning of 2019, the divergence occurred and has continued for nearly 12 months now.
The idea behind the correlation is that bond prices are typically inverse to the equity prices, due to the yield of bonds being related to the SPX.
From darkest blue to lightest: 30-year yield, 10-year, 5-year.
The area at which the divergence began, the S&P 500 gained over 25% while bonds fell about 35%. This leaves us with three alternatives.
1. The S&P 500 corrects 50% to catch down with the bond yields (least likely)
2. Bond Yields for the 30, 10 & 5Year all rally 50% (not likely)
3. The two meet somewhere in the middle. Meaning bond yields rally 15-25% or so, while the S&P 500 drops 10-15%. (a most likely scenario)
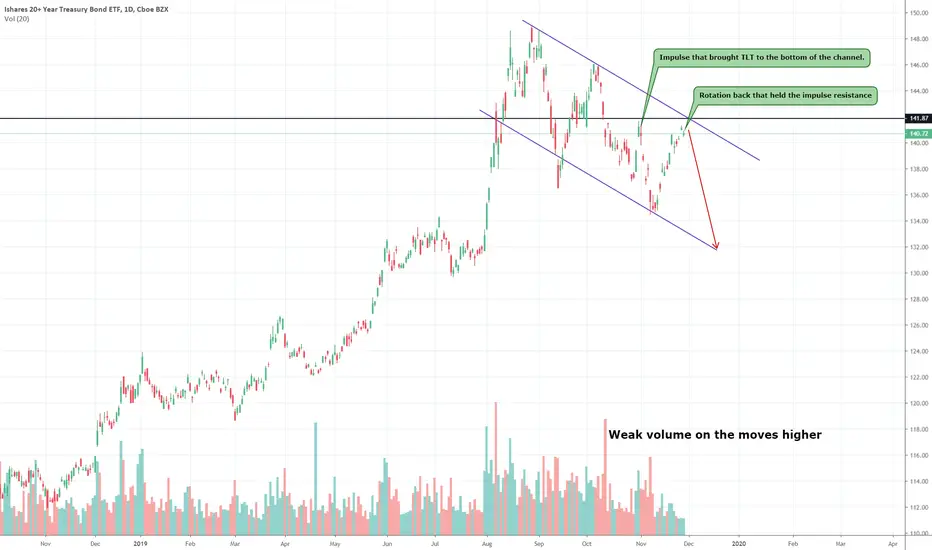
TLT weakness & bond weakness, TLT down to $132TLT is a 20+ year bond ETF that made strong highs throughout the rate-cutting cycle and rightfully so. The inversion of bonds vs the equity market has caused bond yields to drop and because of that since the price of bonds is directly inversely correlated to their yields, prices in TLT and other bonds have been increasing. The low rates have come to a halt as the rate-cutting cycle has stopped, or so we think it has. TLT has since then entered a downtrend in a channel and looks to be continuing in that respect. Bond yields are so low, that the convergence with the SPX is imminent, we've seen a slow increase in yields which will further push the price of TLT down. Another factor is that the equity market is continuously showing strength and looks to be on the rise for the next few months based on FED policy to pump more money into the economy. The volume on TLTto the upside has decreased as well and every swing lower is accompanied by strong volume.
Disclaimer: This idea is for educational purposes only, this does not constitute investment advice. TRADEPRO Academy is not liable for any market activity based on this idea.
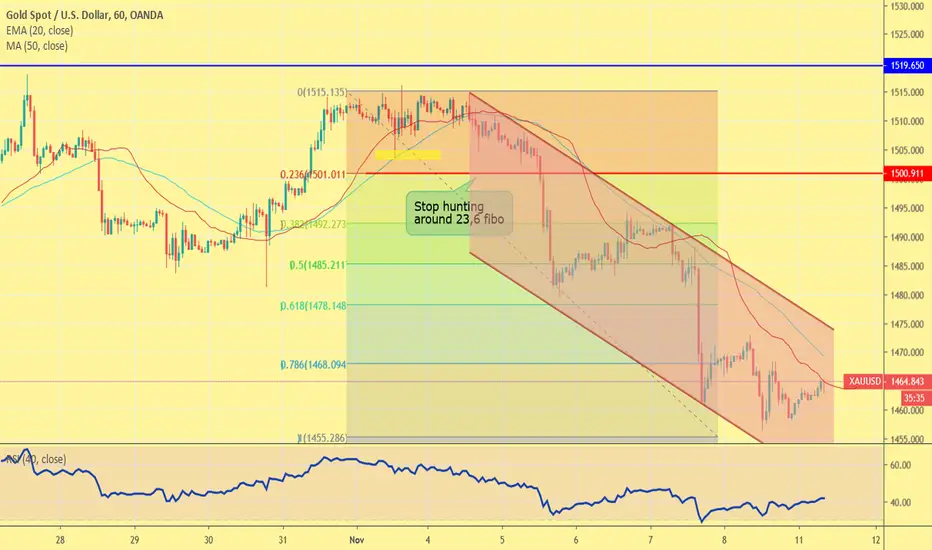
Looking for More Downside Pressure on Gold because of the YeldsGold declined 0.63% against the USD and closed at $ 1459.26 per ounce on Friday, amid strength in the US dollar. In the Asian session, the pair XAU/USD is trading around $ 1465.
Gold traders are going to continue to follow the movement in US Treasury yields and the direction of the U.S. Dollar this week. Of particular interest will be the 10-year U.S. Treasury bonds reaction to the 2.06 percent yield (the high from August). Taking out this level could trigger a steep break in gold.
On the technical picture, given the series of doji’s, hammers and pin bars around the resistance 1519.65 it was apparent the level was a key focal point. Therefore, we warn that any weak break of this level increased the odds that price action remains in a complex correction. Yet it didn’t even break before bearish momentum returned.
The yellow metal is showing convergence with its 20-day MA and trading below its 50-day moving average on the hourly chart. Furthermore, on the daily chart the 20-day MA has crossed below the 50-day MA and both of them are now pointing lower. As the long-term bias is for an eventual break to new highs, the bearish bias is over the near-term, and will later seek evidence the correction from the 1557.07 high is nearing completion.
The bearish channel can be used to aid with profit objectives. If a deeper correction extend, we can also use the bullish trend line from the August low. That said, the 1381.91 -1400 zone should also be considered as potential support along the way.
Potential catalysts that could influence the price action next days are U.S.-China trade relations, reports on U.S. consumer inflation and retail sales, and two-days of testimony by Federal Reserve Governor Jerome Powell.
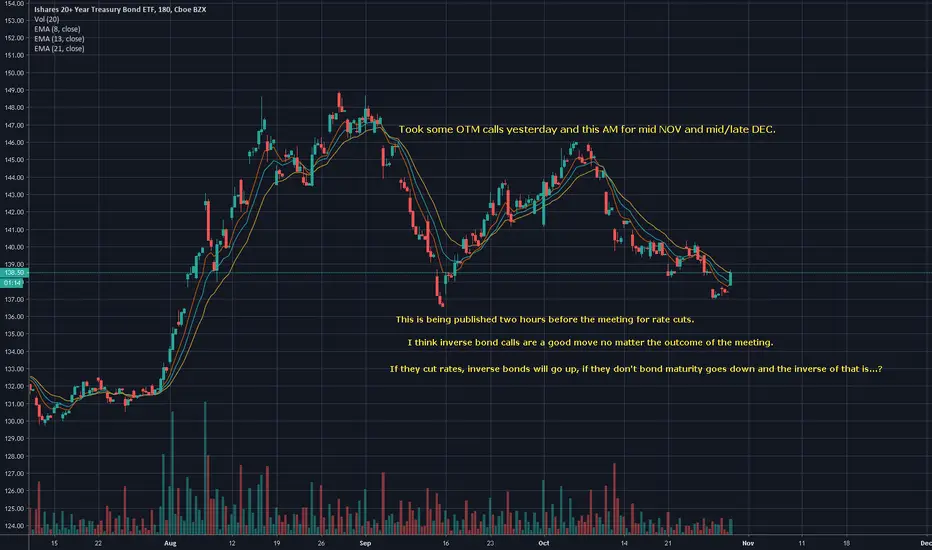
TLT Inverse Bond Play Before MeetingThe play for OTM calls on TLT right now is a good risk to reward for myself given the numerous positive potential outcomes. If they don't cut rates, I expect TLT to make a very nice upward move due to bond prices going up and maturity going down.
If they cut rates, I still expect bond maturities to go down and for TLT to go up.
With the current landscape I am feeling very comfortable with the prices I got for my OTM calls and the ROI.
I'll update later today after the meeting which is less than two hours away currently.
Happy trading everyone, try and be as positive of an impact as you can be everyday. Good luck with any of your plays today
-golddolphin
10Y US TREASURY NOTE|PREMIUM[LONG-TERM]YIELD ANALYSIS|PART 2/2"US10y : Series on Bonds - Sept 20th 2019(7-8 minute read)
For the past couple of month yield curves, particularly the 10 year vs the short term maturities have been a popular topic in the mainstream media, mostly because of the yield curve inversion . This analysis aims to provide a well detailed approach to some of the crucial factors regarding the US Treasuries yield curve. Relatively to part one(linked below as #1), this is a much more complex analysis.
Before I start analysing the yield on the US10 year treasury, addressing some of the criticism from my previous analysis that they are too complex to understand. If it takes me several hours and even days or weeks to notice a pattern, it should take at least 30 mins to properly understand my charts. Most people on this platform have an unrealistic expectation of understanding an unknown method of chart analysing within 30 seconds . In this yield analysis I am utilizing Elliott Waves, Pitchfork Trends, Ichimoku cloud , Harmonic Patterns and EMA/Moving averages in addition to my fundamental approach.
Beginning with this analysis by analysing the pitchfork . It is the most complex and largest part of the analysis. It took me about a month to perfect it and from my thorough understanding, the pitchfork base formed after the mild early 90's recession(w) . You can see my initial sketch for this analysis here: ibb.co To my credit, the same pattern can be observed after the FED rates breakout from bullish cone in my previous analysis on the cycles of FED rates(linked as #2) . It is hard to understand the yield curve without a through understand of monetary policy. I will get back to this point on the pitchfork later in the conclusions.
After the dot.com bubble, a bullish triangle( wedge ) formed in the US10Y . This pattern lasted until the real beginning of the recovery in 2012, after the financial crisis of 08'. At the same time it formed the bottom in yields labelled as e(z), which still stands as the main support. Since the recovery, thanks to Trump's tax reform , the yields managed to make a top close to the long-term resistance ~3.3% in late 2018 . However, there was a hard rejection near the 200 monthly MA and the pitchfork median . Persistently, since the early 90's, I noticed that the 100 Monthly EMA (blue line) has been the primary resistance, in addition to the ichimoku cloud. On the bearish side in yields, it is important to emphasize here the recent yield curve inversion.
The significance of the latest inversion is that is that it has predicted the previous 6 recessions. Now obviously, this pattern may not occur again since we are at such low rates anyways. Personally, I do not see the yield curve as the factor foreshadowing the next recession, it is more of a symptom of a recession. The actual issues that are cooling off the global economy which obviously has a major impact on the US economy, are the downtrend in trade caused by the trade war, Brexit and the economic pessimism in the Euro Zone . I will not discuss these factors in this analysis(you can read about them in my previous posts).
To conclude this analysis on the US 10 year treasury note; without a trade deal, it simply illogical to be long in this market . In addition to the drop in yields(Where's the positive correlation kicking in??), with the recent earnings miss from Fedex (FDX) and the poor performance of the transportation sectors and the rise of defensive sectors(XLU) (XLI-Linked as #3); it is very surprising that some of the cyclical equities haven't taken a major bearish hit yet . These are the fundamental factors necessary for a cycle extension and a healthier economy.
In case a recession happens and that is obviously inevitable( to FED's/ECB's surprise ), from this analysis after the 10 year note breaks the current support at e(z)~1.3-1.5%, several bottom supports from the pitchfork can be observed . The US10Y is currently in a Bearish Rectangle. Contrary to the negative yields that have occured in a good number of the OECD economies, in my opinion the US yields should follow the drawn pitchfork and form a bottom close to 0, but not necessarily cross the line and turn negative in the medium term. This concludes the two part analysis on the US 10 year Treasury note.
Hope that anyone reading this post found it useful and enjoyed it!
|Step_Ahead_oftheMarket|
P.s. Would appreciate some feedback charts or simple comments expressing your opinion on the bond market, thanks!
>>I do not share my ideas for the likes or the views. This channel is only dedicated to well informed research and other noteworthy and interesting market stories.>>
However, if you'd like to support me and get informed in the greatest of details, every thumbs up or follow is greatly appreciated !
Some of my popular analysis relevant to the bond market:
1. Part one- ZB1! US 10 Year Treasury note Price analysis :
2. FED Rates SuperCycle Analysis :
3. XLI- US Industrials :
Full Disclosure: This is just an opinion, you decide what to do with your own money. For any further references or use of my content for private or corporate purposes- contact me through any of my social media channels.


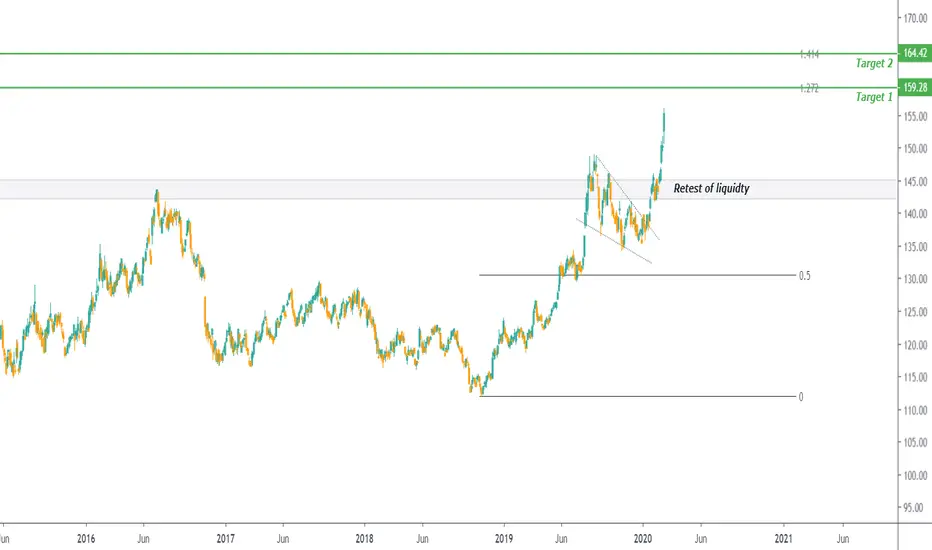
Short this pair or wait for 109, then shortI'm am going contrary to most published Ideas on this pair. If you look at the trend line and bond yield comparisons, this pair is destined to hit 104...

2 Ways to ride this trendForecast: I am expecting Bund to continue its uptrend going forward next 2 weeks. Currently, this week weekly candle close as an inside bar, suggesting consolidation period. Bund will either expand this coming week or next week.
First: Expansion next week, How to get in?
Trade entry: Long the Daily demand zone, with stop below
Confirmation: Reclaim last week low and eventually reclaim both H4 Support and Last week mid range
Invalidation: Daily candle close below Demand zone
Second: Expansion this week, first wait for monday range to develop, trade will be active afer confirmation is seen
Trade entry: Long at either last week high or weekly open after low of the week is in
Confirmation: Break of previous swing high OR Monday being a down candle and Price reclaim Weekly Open
Key levels mentioned:
- Monthly Open
- Last week high / low / mid - range
- Daily Demand zone
- H4 Support level
